Stay Informed and Stay Ahead: Market Watch, October 8th, 2024.
Q4 and 2025 Forecast for S&P 500
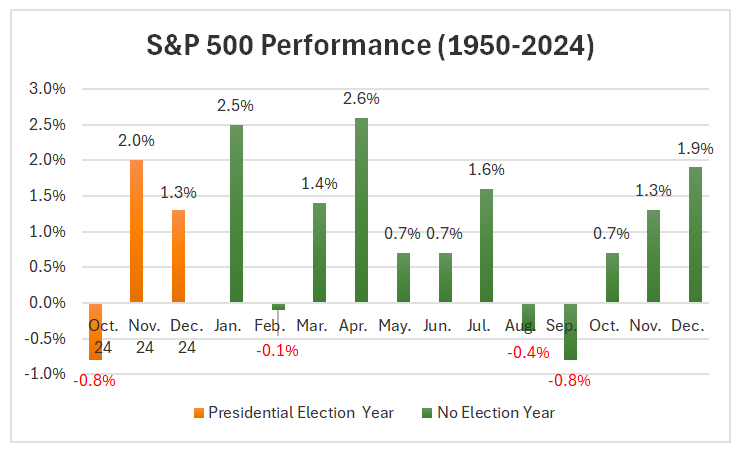
As we enter the final quarter of 2024, historical trends provide insights into potential movements for the S&P 500 index amid this pivotal election year.
Q4 2024 Forecast:
-
October: Based on S&P 500 historical data sets, the forecast is set to decline -0.8%, reflecting typical election-related volatility. However over the past decade, October has averaged a gain of 1.6%, with a return of 2.4% in the last five years.
-
November: Expected rebound of +2.0%, driven by positive investor reactions to election results.
- December: Anticipated gain of +1.3%, buoyed by seasonal holiday spending.
Overall, the last quarter of 2024 suggests a net positive performance from November through December, effectively offsetting October’s losses and positioning the market for a strong year-end finish.
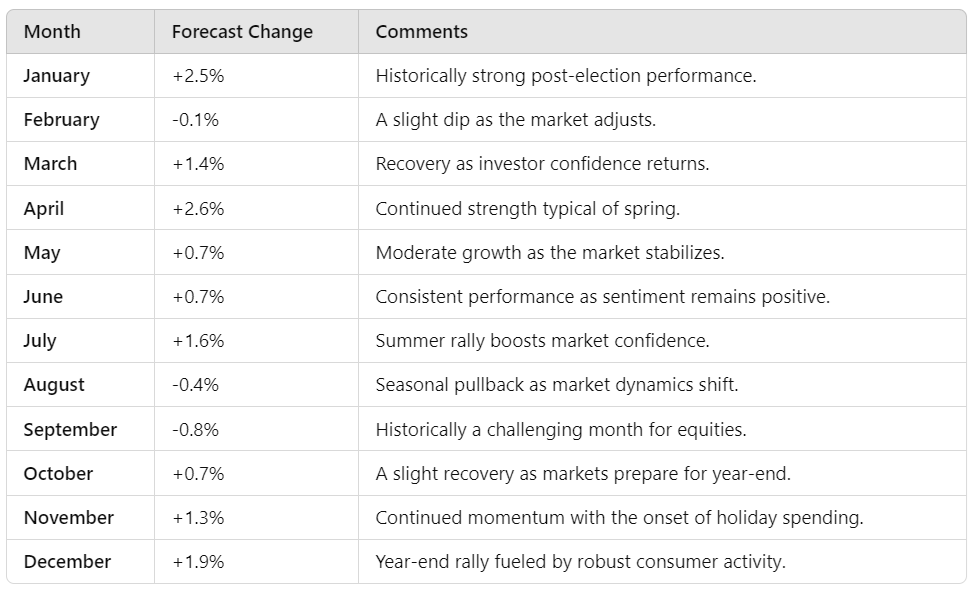
S&P 500 Performance Forecast for 2025
Looking ahead to 2025, distinct performance patterns are anticipated in the aftermath of the presidential election year. Below is a month-by-month breakdown of projected changes:
Summary
The overall outlook for 2025 points to a positive trajectory following the election year. Notable highlights include a strong start in January, potential dips in February and August, and a robust finish in November and December. This pattern indicates a market resilient to election-year volatility, suggesting steady growth as investor confidence rebuilds.