A Golden Cross is a basic technical indicator used in financial markets, particularly in the analysis of stock prices. It is formed when a shorter-term moving average crosses above a longer-term moving average, signaling a potential bullish trend reversal or continuation.
Here’s a step-by-step explanation of how a Golden Cross is formed and interpreted:
- Moving Averages: Moving averages are widely used technical indicators that smooth out price data over a specified period. They help identify trends by reducing short-term price fluctuations. Commonly used moving averages include the 50-day, 100-day, and 200-day moving averages.
- Shorter-term Moving Average: The Golden Cross starts with the shorter-term moving average, typically the 50-day moving average. This moving average calculates the average closing price of an asset over the past 50 trading days. The shorter-term moving average is more responsive to recent price changes, making it sensitive to short-term trends.
- Longer-term Moving Average: The longer-term moving average, often the 200-day moving average, calculates the average closing price of an asset over the past 200 trading days. It is less responsive to short-term fluctuations and provides a broader perspective on the overall trend.
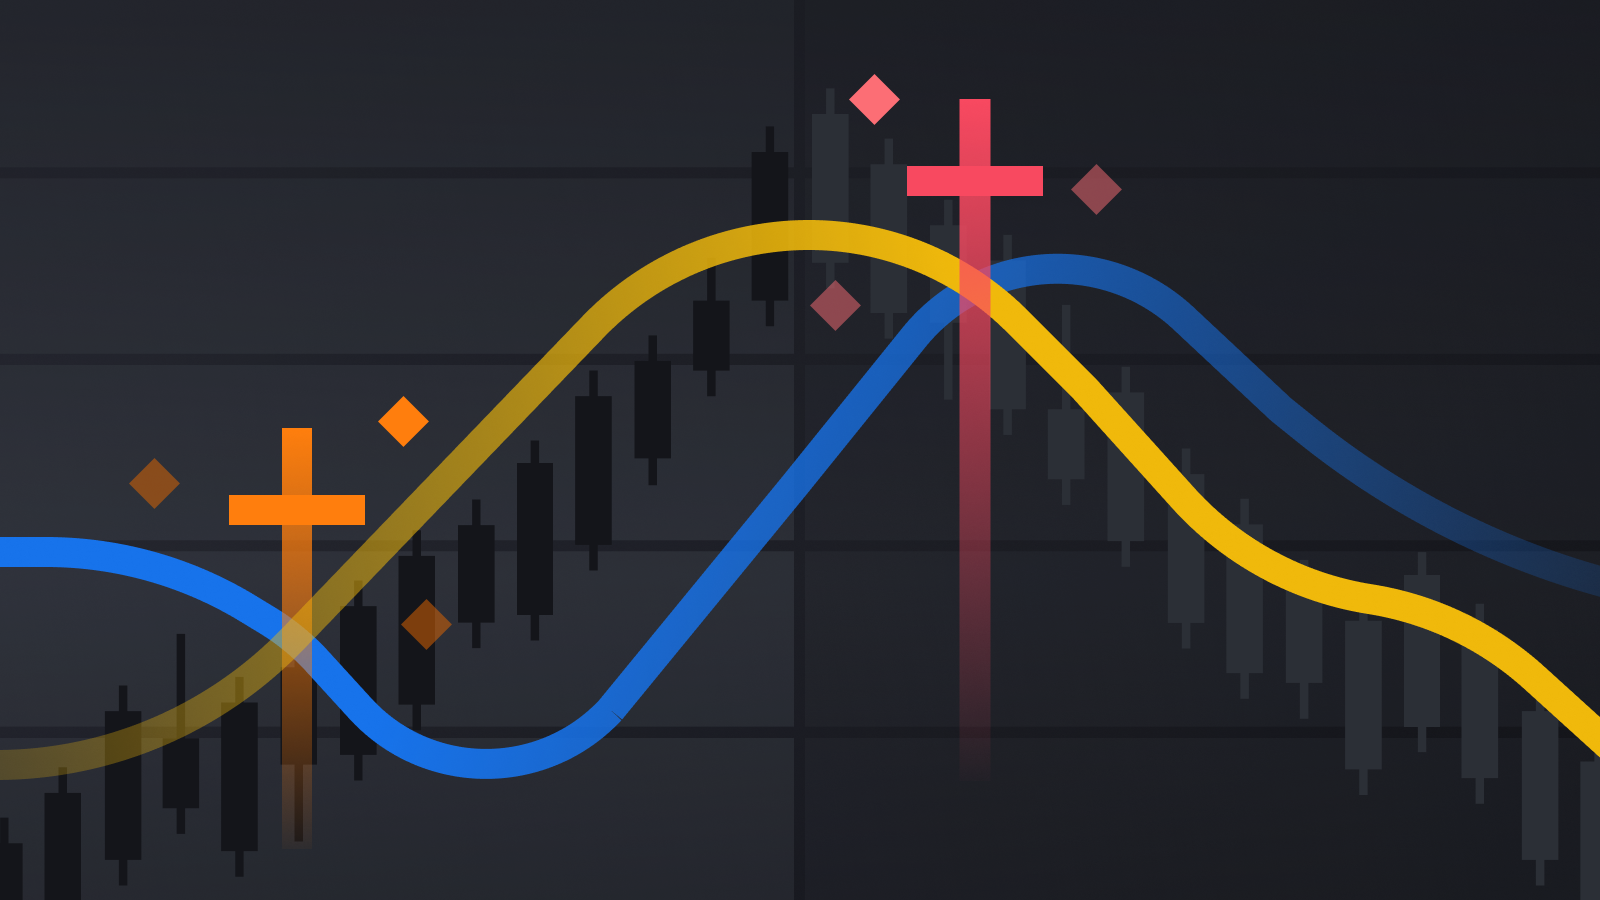
- Cross Occurrence: The Golden Cross occurs when the shorter-term moving average crosses above the longer-term moving average on a price chart. This implies that the average price over the shorter period has surpassed the average price over the longer period. The crossover is considered a bullish signal, indicating the potential for an upward trend.
- Bullish Interpretation: Traders and investors interpret a Golden Cross as a confirmation of a bullish trend or a reversal of a previous downtrend. It suggests that buying pressure is increasing, potentially leading to higher prices in the future. Traders may use this signal to enter new long positions or add to existing ones.


