
MARKETS TODAY August 17th, 2023 (Vica Partners)
Overnight/US Premarket, Asian markets finished mixed, China’s Shanghai Composite gained 0.43% while Japan’s Nikkei 225 lost 0.44%, the Hong Kong’s Hang Seng was down 0.01%. S&P futures opened trading at 0.27% above fair value.
European markets finished lower, France’s CAC 40 lost 1.01%, Germany’s DAX down 0.79% and London’s FTSE 100 off 0.68%.
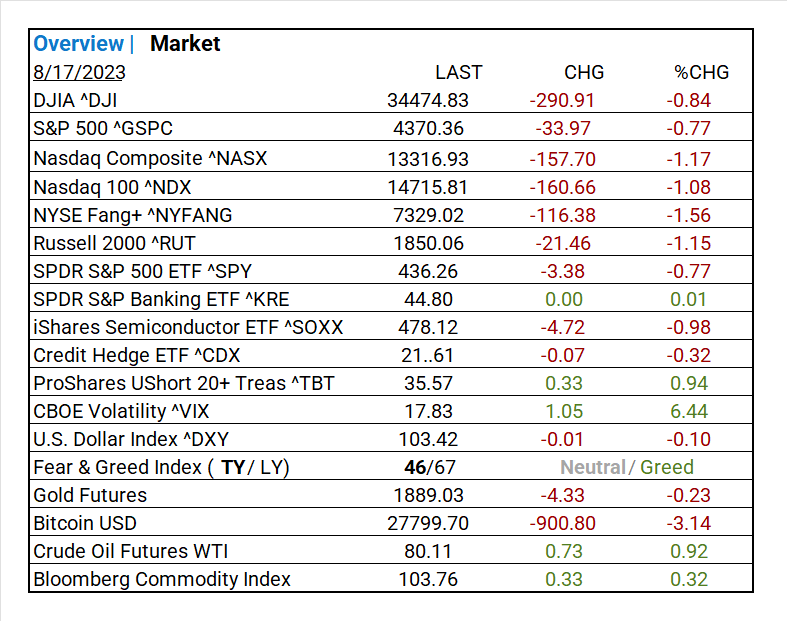
Today US Markets finished lower, the NASDAQ lost 1.17% the DOW down 0.84% and the S&P 500 off 0.77%. 10 of 11 S&P 500 sectors declining: Energy +1.11% outperforms/ Consumer Discretionary -1.58% lags. On the upside, Industries: Communications Equipment, Oil, Gas & Consumable Fuels, Gas Utilities. ProShares UShort 20+ Treas ^TBT, >2-year US Treasuries, Oil, the Bloomberg Commodity Index.
In US economic news, US claims came in lower from last week and just below forecast while continuing claims which increased. Philly Fed easily beat consensus and ends twelve months of declines. U.S. leading economic indicators in-line.
Takeaways
- US. leading economic indicators in-line
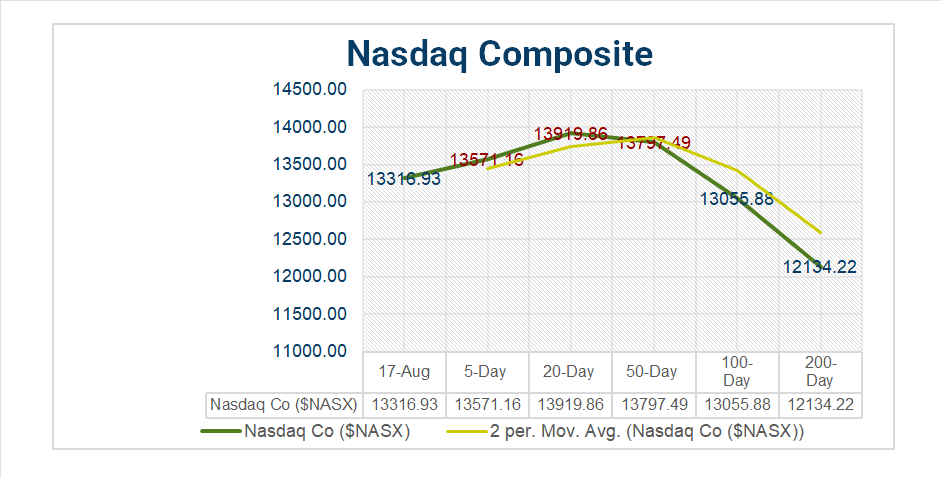
- All three of the major U.S indexes decline for 2nd consective day
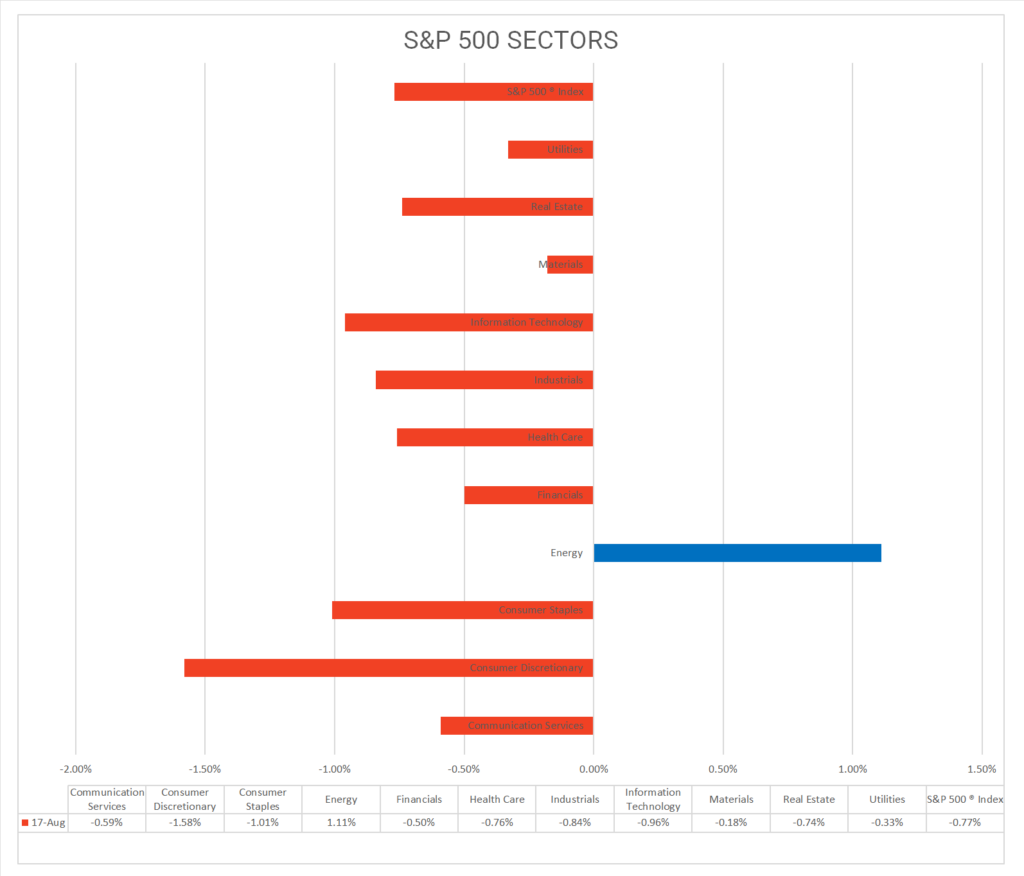
- 10 of 11 S&P 500 sectors declining: Energy +1.11% outperforms/ Consumer Discretionary -1.58% lags.
- Trending Industries: Communications Equipment +2.18%, Oil, Gas & Consumable Fuels +1.22%, Gas Utilities +0.88%
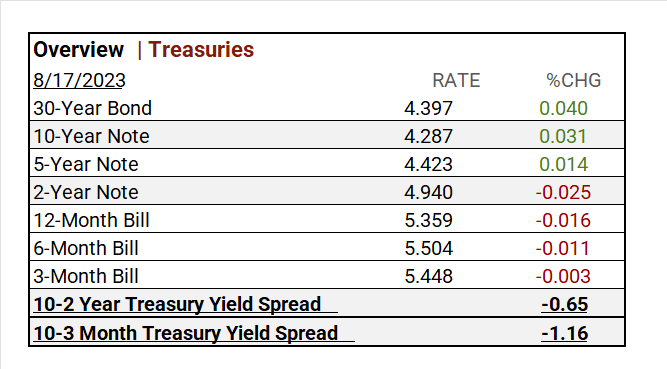
- US Treasury yields >2-years up
- ProShares UShort 20+ Treas ^TBT +0.94%
- Oil and the Bloomberg Commodity Index rise
- Walmart (WMT) important “economy metric” earnings beat
- Tomorrow is options expiration!
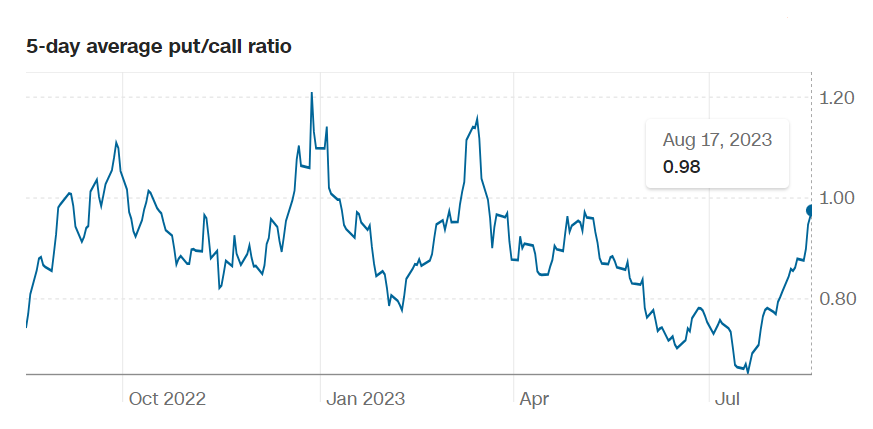
Pro Tip: The 5-day average put/call ratio indicates when the ratio of puts to calls is rising, it is a sign that investors are growing cautious. A ratio above 1 is considered pessimistic.
Sectors/ Commodities/ Treasuries
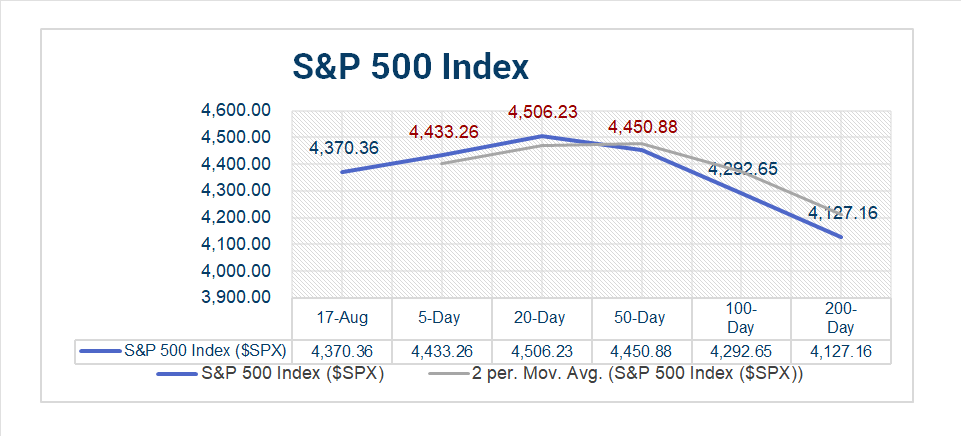
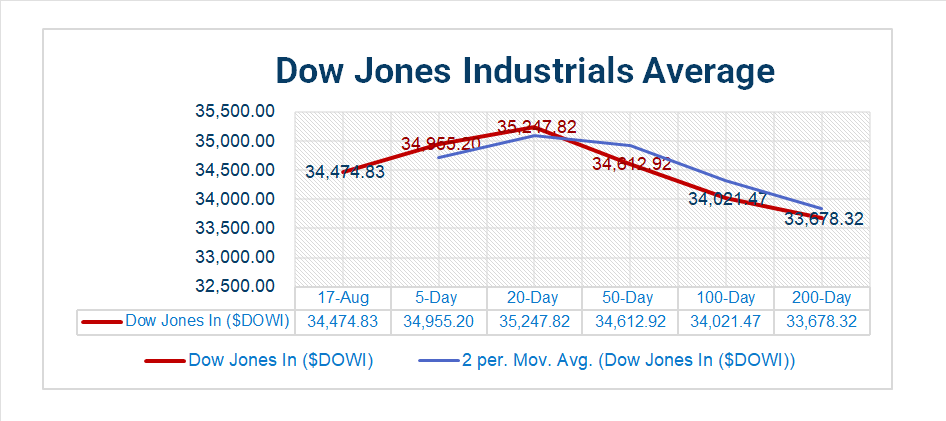
Key Indexes (5d, 20d, 50d, 100d, 200d)
S&P Sectors
- 10 of 11 S&P 500 sectors declining: Energy +1.11% outperforms/ Consumer Discretionary -1.58% lags.
- Trending “on the Day” Industries: Communications Equipment +2.18%, Oil, Gas & Consumable Fuels +1.22%, Gas Utilities +0.88%, Metals & Mining +0.66%, Containers & Packaging +0.58%
- *1 Month Leaders: Energy +6.22%, Health Care +2.07%, Communication Services -0.20%
- *YTD Leaders: Communication Services +39.41%, Information Technology +35.62%, Consumer Discretionary +30.14%
- *S&P 500 +14.71% *as of Aug-16-2023
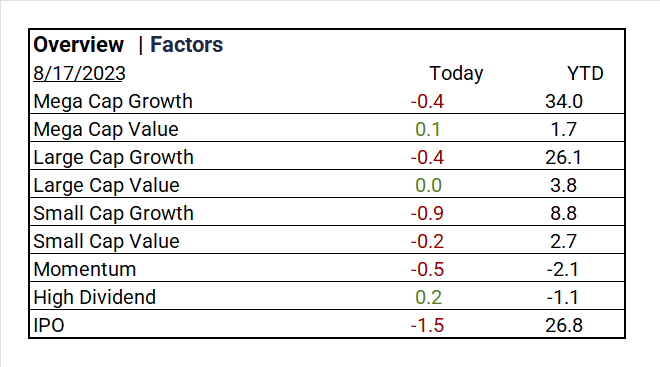
Factors
US Treasuries
Earnings
Q2 ’23 Top Line Top Line
- Q1 ’23 Actual: 79% of companies beat analyst estimates by an average of 6.5%
- Q2 Forecast: S&P 500 EPS was expected to decline <7.2%>/ Fiscal year 2023 EPS flat YoY
Q2 Actual (TBA)
Notable Earnings Today
- +Beat: Walmart (WMT), Applied Materials (AMAT), Adyen (ADYEY), Ross Stores (ROST), Keysight Technologies (KEYS), Nice ADR (NICE), Bill Com (BILL), Globant SA (GLOB)Lumentum Holdings Inc (LITE), Torm A (TRMD)
- – Miss: Coloplast A (CLPBY), Soquimich B ADR (SQM), Lenovo Group Ltd PK (LNVGY), Tapestry (TPR), Bilibili (BILI), Madison Square Garden Sports (MSGS)
Economic Data
US
- Initial jobless claims Aug. 12: act 239,000, fc 240,000, prior 250,000
- Philadelphia Fed manufacturing survey Aug.: act 12, fc -10, prior -13.5
- US. leading economic indicators July: act -0.4%, fc -0.4%, prior -0.7%
Vica Partner Guidance August ’23, (updated 8-16)
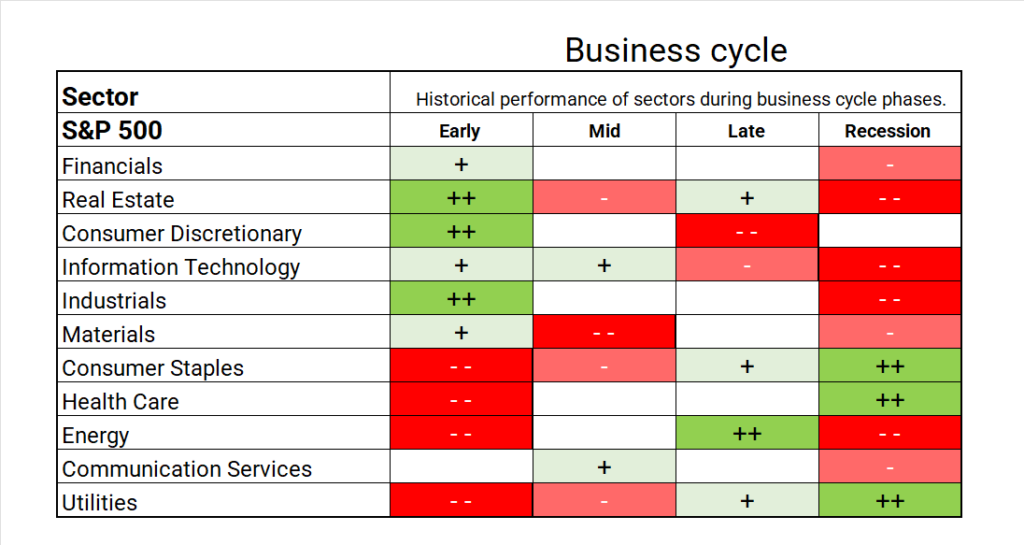
- Q3+/4 highlighting: Energy sector trending in current late business cycle. Industries; Energy Equipment & Services, Oil, Gas & Consumable Fuels, Interactive Media & Services, Construction Materials, Media, Broadline Retail, Health Care Providers & Services, Containers & Packaging, Office REITs, Ground Transportation, Communications Equipment, Machinery Biotechnology, Pharmaceuticals, Capital Markets, Construction & Engineering, Building Products, Machinery.
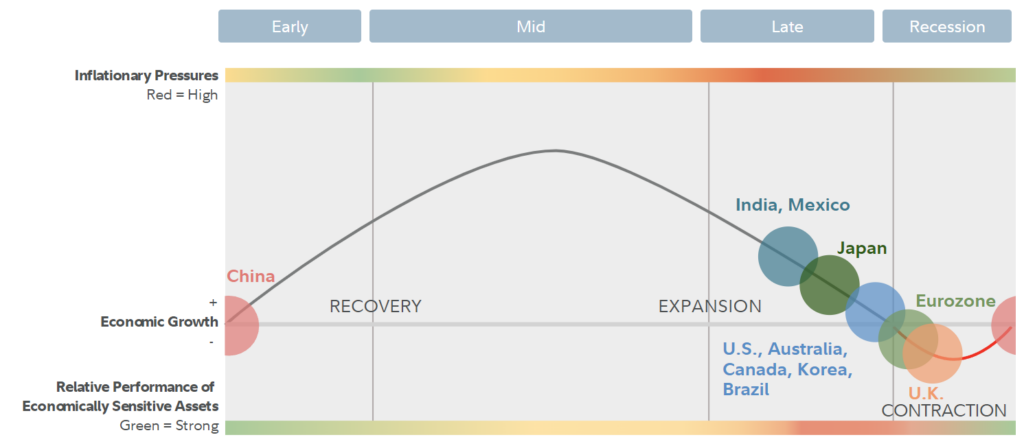
- Mid Term: Q4 sector shift to Utilities and Health Care. Slight regression on Semiconductor & Semiconductor. Specialized REITs have upside. Undervaluation for Chinese Mega Cap Tech. Japan equities still a better value than US. Smart money has already started investing in Real Estate/ builders for a good 18 months out.
- Cautionary: Current shorter term “hard” shift from Growth to Value. Industries: Independent Power and Renewable Electricity Producers, Automobiles, Automobile Components, Consumer Finance, Passenger Airlines, Hotel & Resort REITs. Materials on China deflation. Credit default swap (CDS) to pick-up through Q4/Q1. >20 Year Treasuries price erosion.
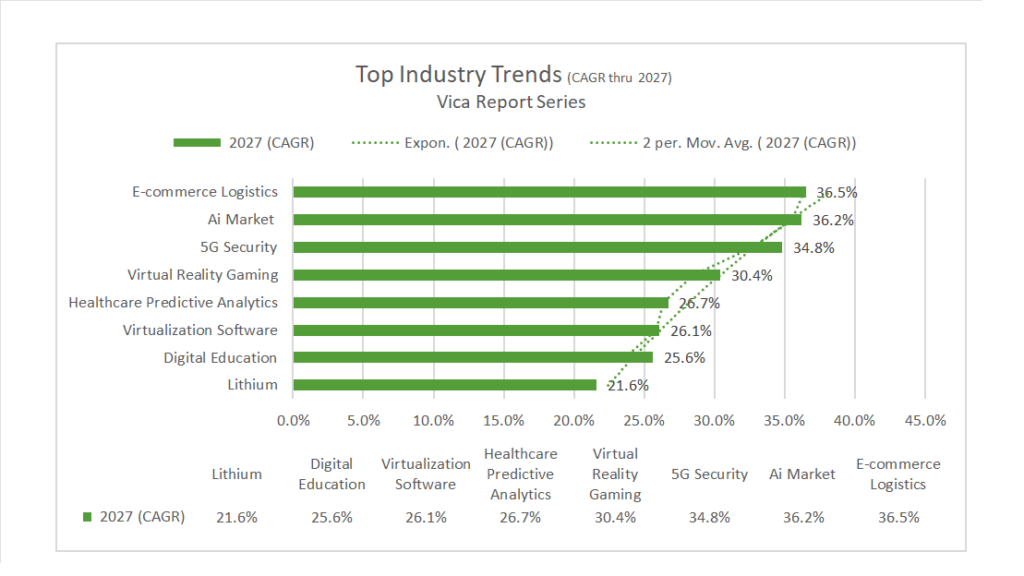
- Longer Term: NASDAQ 100^NDX/FANG+ ^NYFANG companies will continue to outperform “BIG allows you to invest at scale”. TOP Sector outperform includes AI and Semiconductor Equipment, Key materials like Lithium and Uranium. Forward looking CAGR growth below:
- Company: we continue to emphasize longer term business *quality and strength of balance sheet for all investments. * Strong Mega Cap longer support – NVIDIA (NVDA), Meta Platforms (META), Microsoft (MSFT), Alphabet (GOOG, GOOGL), Amazon (AMZN), Apple (AAPL), Tesla (TSLA), Taiwan Semi (TSM), ASML Holding NV (ASML).
- BIG Picture: Market bottoms are made on bad news and with deflationary signals the current market rally should come as no surprise. The combination of current Fed tightening, higher oil prices and a strong dollar should have given us a final bottom in ’23?
- Our biggest concern with the current rally is that the Government is not as effective as Free Markets in managing capital. Stock repurchases are just another way to deploy Capital. Consider that about 63% of the typical business cost is labor. I wholeheartedly trust the Free Market to better spend on CAPEX, R&D, and other.
- As for Bonds as an alternative investment for Stocks, a >10-year bond should have a return that exceeds nominal GDP, assuming inflation remains above >3%.
- The argument for Fed further tightening has its pundits. Raising rates to counter jobs (1.6 jobs available for every job seeker) in a rapidly changing economy will NOT moderate on demands.
- The Fed would benefit by rethinking its 2% inflation target and adjusting it to 3%. This would account for more accurate wages, energy transitions and account for expanding services in BIG tech. In addition, add more protection from deflation.
News
Company News/ Other
- Walmart Lifts Sales Outlook, Fueled by Consumers Looking for Deals – WSJ
- Vietnamese EV Maker VinFast Surges in Nasdaq Trading Debut – Bloomberg
- Ant Group’s Alipay updates app’s international interface to support Visa, Mastercard, other major credit cards ahead of 2023 Asian Games – South China Morning Post
Energy/ Materials
- Oil Claws Back Above $80 a Barrel as Tight Supply Reclaims Focus – Bloomberg
- Big California Pension Fund Hands Over Trove of Climate-Related Documents Demanded by House GO – Bloomberg
Real Estate
- Mortgage Rates Hit 7.09%, Highest in More Than 20 Years – WSJ
- Too Many Vacant Lots, Not Enough Housing: The U.S. Real-Estate Puzzle – WSJ
Central Banks/Inflation/Labor Market
- S. Leading Economic Index Declined Again in July – WSJ
- Fed Staff Grow Wary of Asset-Price Risks Following Stock Run-Up – Bloomberg
- European Central Bank Raises Rates, Says Pausing Is an Option – WSJ
Asia/ China
- China cuts US Treasury holdings to 14-year low amid persisting security concerns, geopolitical tensions – South China Morning Post
- China must fulfil economic goals despite slowdown, premier says as he seeks enhanced domestic momentum – South China Morning Post
- U.S. Plans New Tariffs on Food-Can Metal From China, Germany and Canada – WSJ


