Week Ahead: March 9, 2026
Executive Takeaway: Markets are repricing risk rather than breaking structure. Equity volatility expanded while Treasury demand and credit markets remain stable — conditions that historically lead to consolidation rather than systemic drawdowns.
Market Regime Snapshot
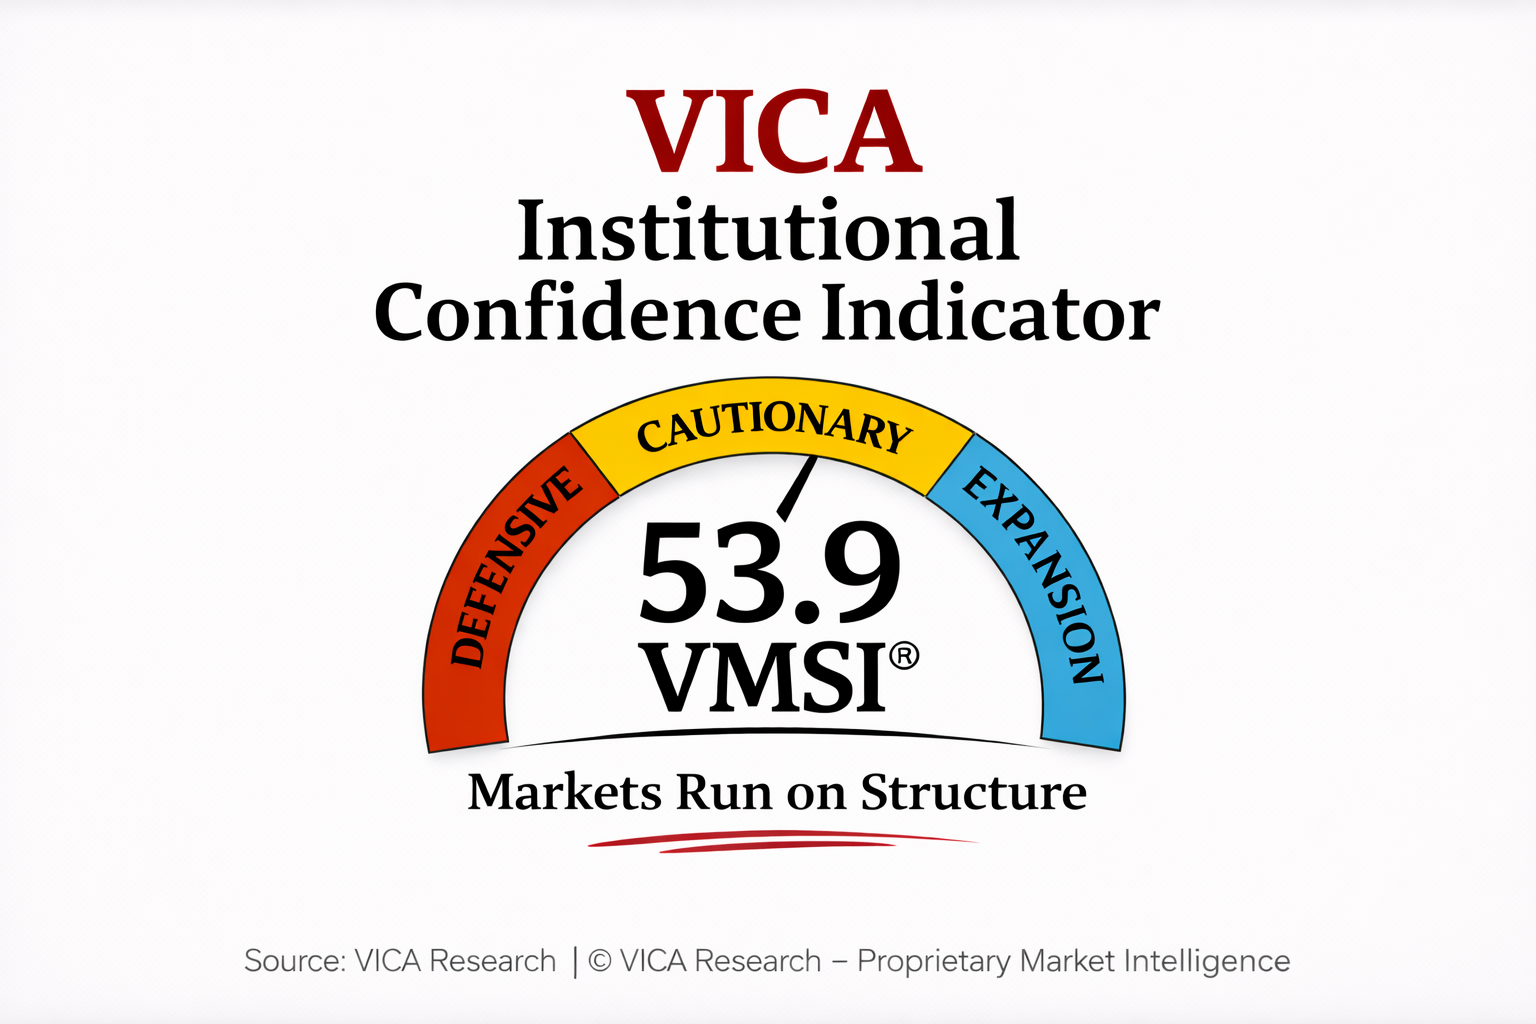
VMSI Sentiment: 53.9 — Neutral / Cautionary Equity Structure: Short-term weakness, long-term trend intact Risk Transmission: Hedging activity, not systemic stress

Markets enter the week following a coordinated repricing across equities and volatility. The S&P 500 declined 1.24%, the Dow fell 2.65%, while the Nasdaq gained 0.29%. Small-cap equities weakened more materially with the Russell 2000 declining 3.20%, signaling broader cyclical risk reduction.
Credit markets softened but remain orderly. High-yield credit (HYG) now trades below short-term moving averages with RSI near 27, indicating short-term risk reduction rather than systemic credit deterioration. Investment-grade credit (LQD) continues to hold near longer-term support despite a 0.33% weekly decline.
Treasury markets continue to absorb demand across the curve. Short-duration Treasuries (SHY) remain near intermediate support with volatility near 2%, while intermediate duration (IEF) trades close to its 50-day average. Long-duration Treasuries (TLT) declined 0.37% but remain near longer-term trend levels.
below short-term moving averages with RSI near 27, indicating short-term risk reduction rather than systemic credit deterioration. Investment-grade credit (LQD) continues to hold near longer-term support despite a 0.33% weekly decline.
Treasury markets continue to absorb demand across the curve. Short-duration Treasuries (SHY) remain near intermediate support with volatility near 2%, while intermediate duration (IEF) trades close to its 50-day average. Long-duration Treasuries (TLT) declined 0.37% but remain near longer-term trend levels.
The divergence between rising equity volatility and relatively stable Treasury volatility indicates portfolio hedging rather than systemic liquidity stress. When equity volatility expands while duration remains supported and credit spreads widen only modestly, markets historically transition into short consolidation regimes rather than extended drawdowns.
The primary catalyst this week will be U.S. inflation data, which will determine whether Treasury yields stabilize or extend higher.
Market Structure
The S&P 500 now trades below its 5-, 20-, and 50-day moving averages while remaining above the longer-term 200-day trend, indicating short-term pressure within an intact macro structure.
Momentum indicators confirm near-term weakness with RSI readings near 38–40 and directional momentum favoring downside. Historically, when indices move below short-term averages while remaining above the 200-day trend and credit conditions remain stable, markets tend to transition into 10–15 trading-day consolidation phases rather than structural breakdowns.
Volatility Regime
Equity volatility repriced higher during the week as hedging demand increased following the equity pullback. Treasury volatility remains comparatively contained, indicating volatility expansion concentrated in equity markets rather than across the broader financial system.
Systemic market dislocations historically occur when equity volatility and Treasury volatility expand simultaneously, a condition not currently present.
Rates and Duration
Treasury markets remain structurally stable across the curve.
Short-duration Treasuries (SHY) continue to trade within a narrow volatility band with ATR near 0.12%, reflecting stable funding conditions. Intermediate duration (IEI, IEF) remain near trend support with RSI readings near 44–47.
Long-duration Treasuries (TLT, EDV, ZROZ) weakened modestly but remain above longer-term trend levels with duration volatility near 8–12%, reflecting positioning adjustments rather than disorderly selling.
Credit Conditions
Credit markets softened modestly but remain functional.
High-yield credit (HYG) declined modestly and trades below short-term averages while maintaining volatility near 4%, indicating gradual risk reduction rather than spread dislocation.
Investment-grade credit (LQD) remains structurally stable while short-duration high yield (SJNK) and emerging-market debt (EMB) reflect moderate repositioning as investors adjust exposure to global growth risk.
Historically, equity declines accompanied by moderate credit deterioration rather than rapid spread expansion reflect risk recalibration rather than systemic market stress.
Factor Rotation
Factor dispersion continues across equities.
Value equities (VTV) remain structurally strong, trading above their 50-day (+4.3%), 100-day (+9.4%), and 200-day (+15.4%) moving averages.
Growth equities (VUG) remain under pressure, trading below their 50-day (−6.6%) and 100-day (−2.6%) averages while remaining approximately 6% lower year-to-date.
Institutional capital continues rotating toward balance-sheet durability and lower-duration equity exposure.
Global Risk Signals
Global equity markets weakened during the week.
Emerging markets (EEM) declined 0.54%, trading below short-term averages while remaining above longer-term structural support. Japanese equities (EWJ) declined 1.30%, reflecting tactical weakness within a broader trend.
China large-cap equities (FXI) remain under pressure, trading 6–9% below intermediate trend levels.
The U.S. Dollar Index (DXY) trades above its 5-, 20-, and 50-day averages with RSI near 65, reflecting persistent global demand for dollar liquidity.
Dollar strength combined with emerging-market weakness while U.S. equities remain above long-term support historically reflects global liquidity tightening rather than domestic demand contraction.
Event Risk
Macro catalysts this week will determine whether volatility stabilizes or expand.
Wednesday’s CPI report is expected to show 0.3% monthly inflation with core inflation near 0.2%.
Thursday’s data includes initial jobless claims (forecast 215k) and housing starts near 1.33 million.
Friday’s releases include GDP revision (1.5%), Core PCE (0.4%), and personal income growth near 0.5%.
Inflation outcomes will determine whether Treasury yields stabilize or extend higher.
VICA Institutional Market Sentiment Index (VMSI)

Institutional sentiment remains above neutral, indicating continued participation despite increased volatility.
Bottom Line
Markets are repricing risk rather than signaling structural instability. Equities declined, volatility increased, and credit softened while Treasury markets remain stable.
Institutional positioning reflects hedging and exposure reduction rather than capital flight.
The next directional move will depend primarily on inflation data and the Treasury yield response.
About the VICA Institutional Market Sentiment Index (VMSI)
The VICA Institutional Market Sentiment Index (VMSI) is a proprietary multi-factor model designed to track shifts in institutional risk behavior across global markets.
The index integrates cross-asset signals including momentum, liquidity flows, volatility hedging demand, credit conditions, and safe-haven allocation trends.
Unlike retail sentiment indicators, the VMSI focuses on institutional positioning and capital flow dynamics, providing a forward-looking lens on systemic risk and market conviction.
Important Notice
This report and the proprietary VICA Institutional Market Sentiment Index (VMSI) are confidential works of authorship protected by intellectual property laws. Unauthorized reproduction, redistribution, or use without express permission from VICA Research is strictly prohibited and monitored.
This material is provided for informational purposes only and does not constitute investment advice or a recommendation to buy or sell any security.
VICA Research
A new VICA Research platform and VMSI dashboard experience will relaunch in March 2026, providing expanded institutional data tools, deeper analytics, and enhanced access to proprietary sentiment indicators.
Capital does not follow headlines. It follows structure.
