May 1, 2025 | VICA Research
Weekly Snapshot
VMSI Score: 35.2 (Defensive)
S&P 500: +0.36% | Nasdaq: +1.52% | Dow: +0.21%
VIX: 24.60
Momentum: 39.6 | Liquidity: 33.1 | Volatility: 55.8 | Safe Haven Demand: 73.5
Despite another strong equity advance, the VICA Market Sentiment Index (VMSI) remains anchored in the Defensive Zone, highlighting continued institutional caution beneath the surface. Volatility remains elevated, liquidity is not convincingly returning, and risk appetite is yet to shift meaningfully.
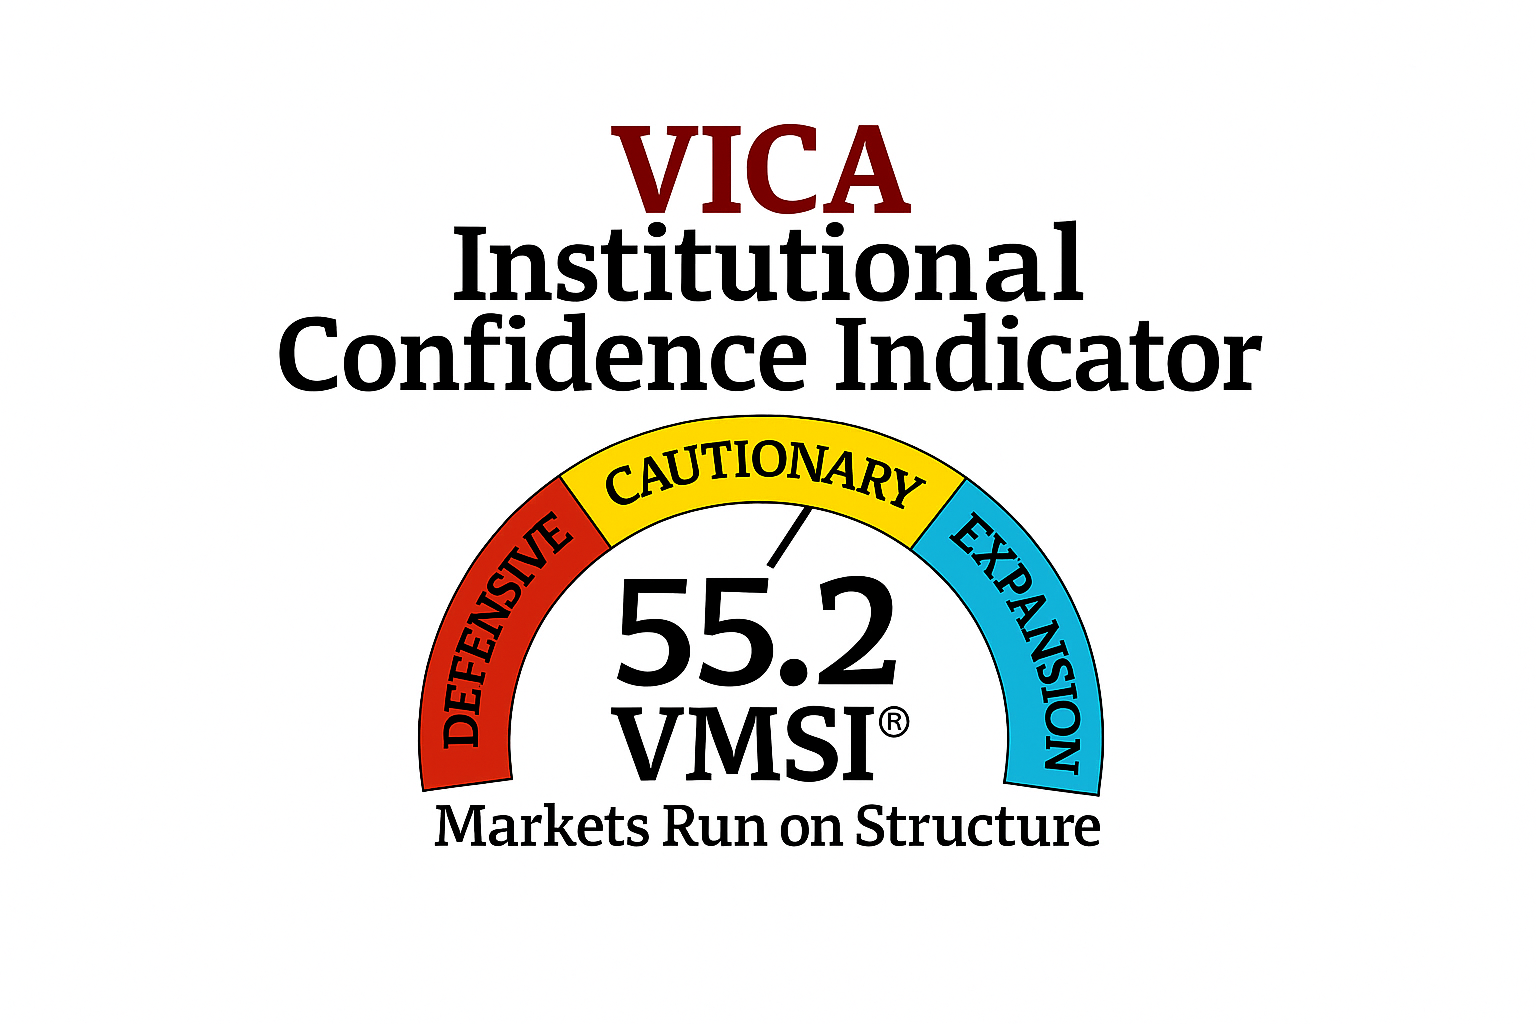
What is VMSI?
The VICA Market Sentiment Index tracks institutional capital flows, risk posture, and macro volatility weekly. Built for tactical allocation — not behavioral shifts.
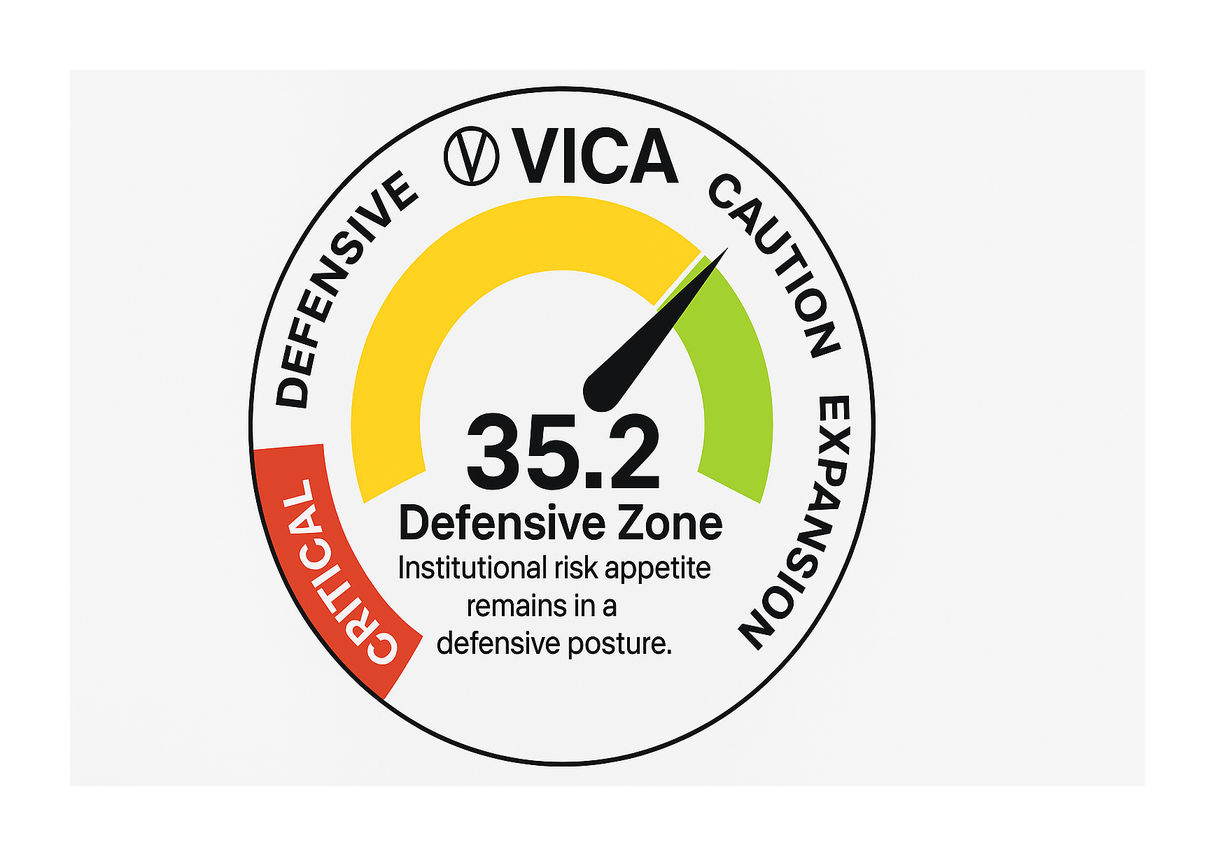
VMSI Gauge Chart — Displaying Current Sentiment and Risk Level
VMSI Gauge Score – May 1, 2025
Sentiment Score: 35.2 (Defensive Zone)
The VMSI gauge shows sentiment has improved marginally from last week’s 31.2 but remains within the Defensive Zone. Institutional flows are still skewed toward safety, and the posture reflects guarded optimism rather than full re-engagement.
Insight: Institutions are probing risk, not embracing it.
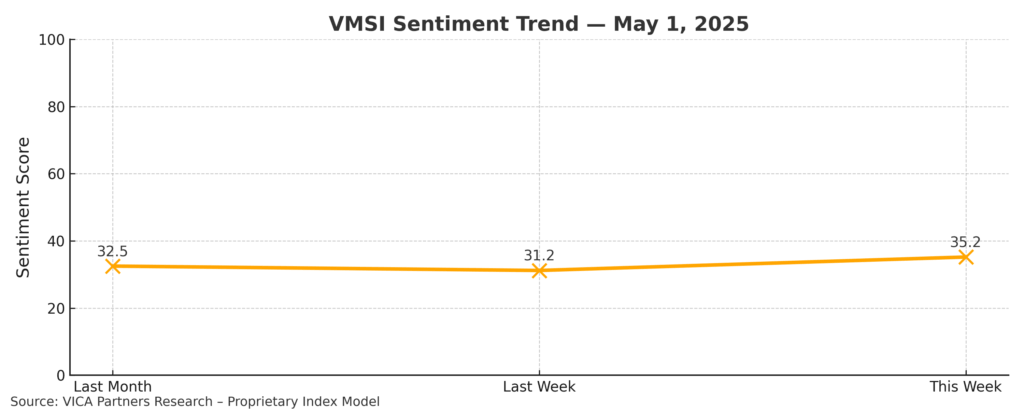
VMSI Timeline – Sentiment Shifts Over Time
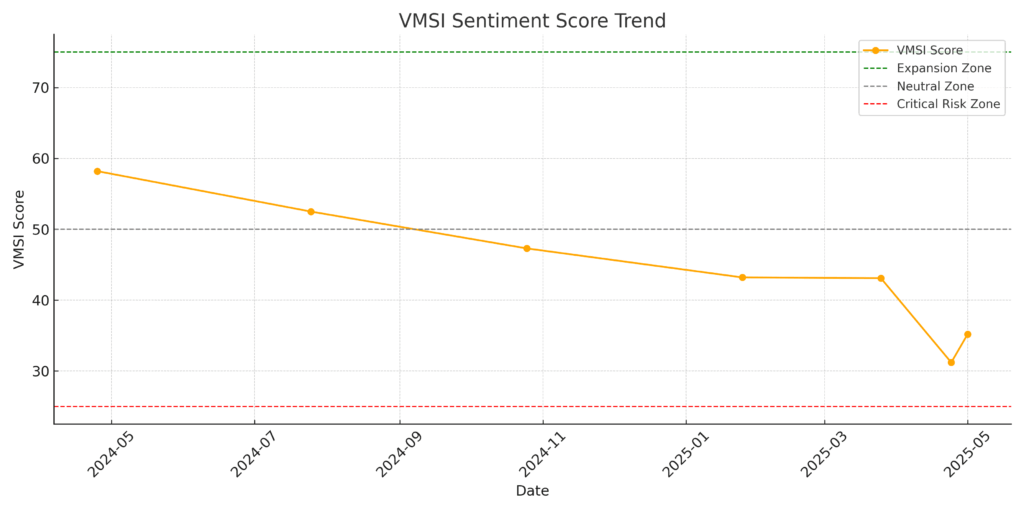
VMSI Score Timeline Trend – May 1, 2025
Sentiment rebounded from extreme levels but remains well below March levels. The short-term recovery in VMSI suggests tentative improvement but insufficient conviction to indicate a full cyclical shift.
Insight: Bounce from the bottom, but no breakout.
Market Momentum – Institutional Accumulation Trends
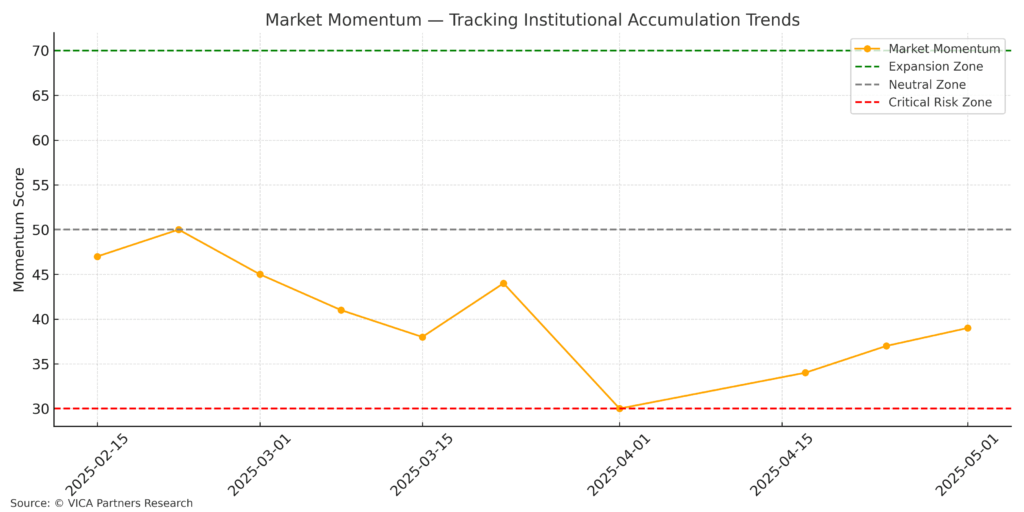
Market Momentum Trend – May 1, 2025
Despite new index gains, technicals indicate the rally may be driven by short-covering and selective flows. Most averages remain below key resistance levels. RSI, MACD, and stochastics point to a sharp bounce but not broad institutional accumulation.
Insight: Momentum is improving but remains reactionary.
Liquidity Flows – Capital Movement Patterns
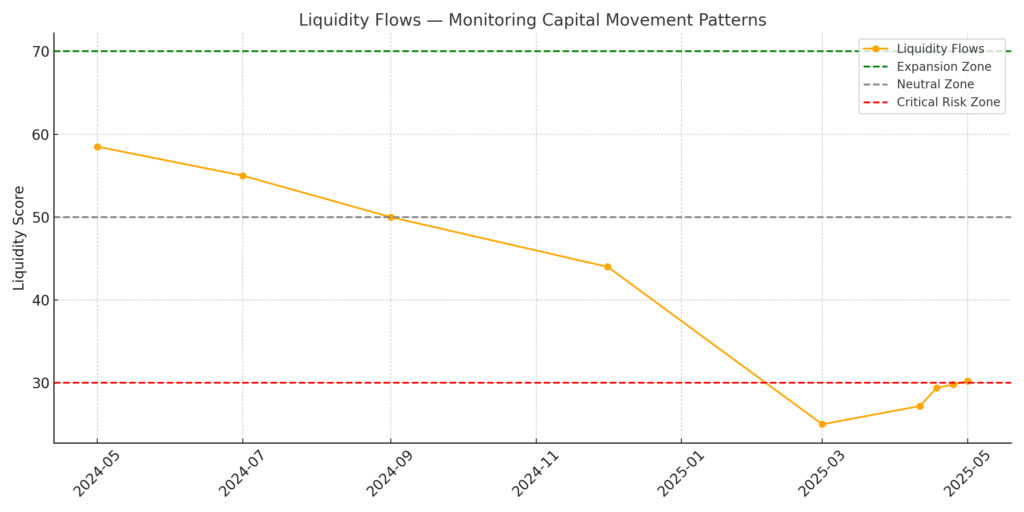
Liquidity Flows Trend – May 1, 2025
Redemptions from equity ETFs have slowed, and inflows into sector-specific and Treasury ETFs continue. However, risk-on flows into cyclicals remain absent. High-yield and tech ETF activity is muted.
Insight: Liquidity is returning to safety, not growth.
Volatility & Risk Hedging – Market Uncertainty Barometer
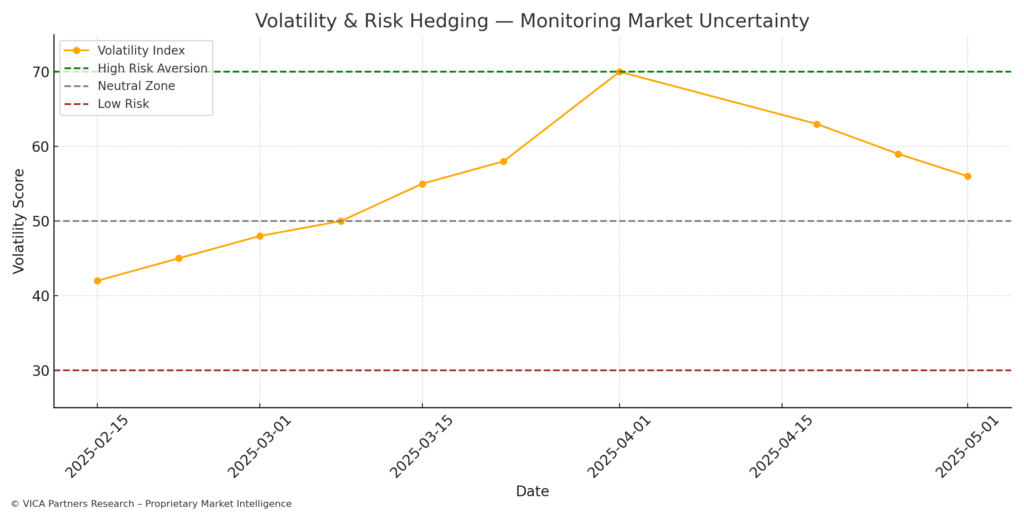
Volatility & Risk Hedging Trend – May 1, 2025
The VIX has cooled slightly to 24.60 but remains well above historic norms. Technical indicators for the VIX suggest that the market remains hedged and cautious. Demand for protection is steady despite equity strength.
Insight: Risk protection remains in place, reflecting skepticism of equity gains.
Safe Haven Demand – Flight to Quality
Chart Insert: Safe Haven Demand Trend – May 1, 2025
Bond inflows, precious metal strength, and long duration positioning continue to reflect elevated safe haven demand. The 10-Year Treasury yield declined to 4.15% as investors rotate back into quality.
Insight: Flight to safety remains the dominant institutional bias.
Defensive Sector Performance – Risk-Off Rotation within Equities
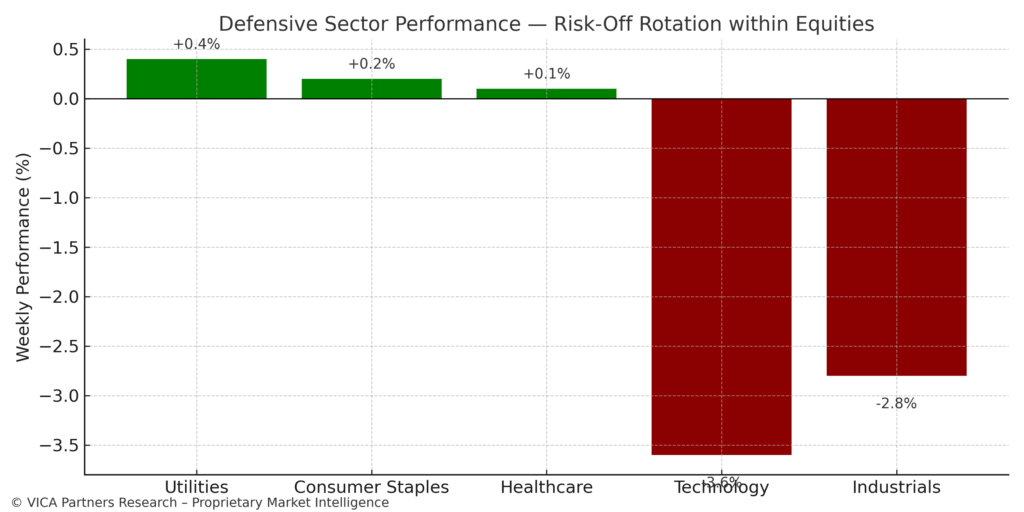
Sector Rotation Performance – May 1, 2025
Defensive sectors continue to outperform with Consumer Staples, Utilities, and Healthcare showing strength. Tech and industrials have rallied off lows but still lag.
Insight: Equity leadership still favors defense over growth.
Institutional Positioning (as of May 1)
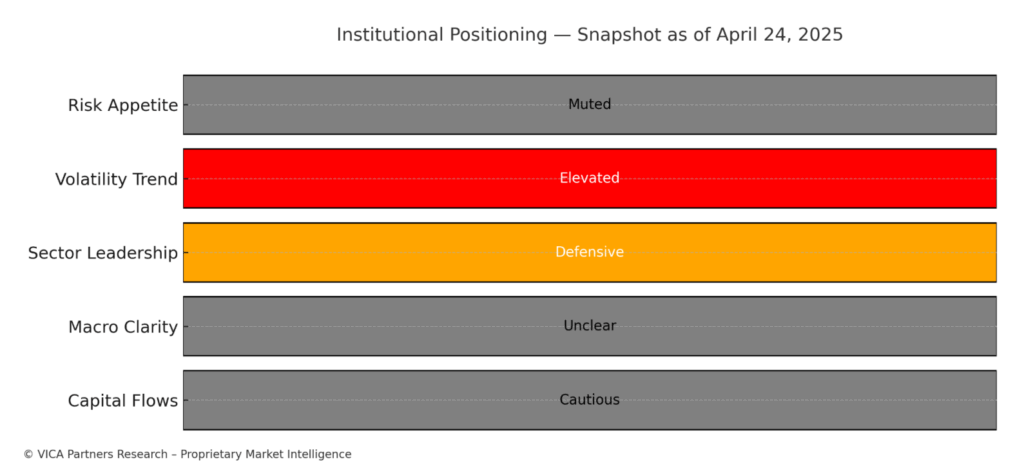
Institutional Positioning Snapshot – May 1, 2025
Short interest remains elevated, Treasury positions are net long, and VIX futures show a blend of hedging and mild short positioning. The VICA “Pro Dashboard” confirms no major risk-on allocation shifts.
Insight: Institutions remain in protection mode. Tactical exposure is replacing conviction.
Pre-Recovery Alert – Contrarian Signals & Outlook Ahead
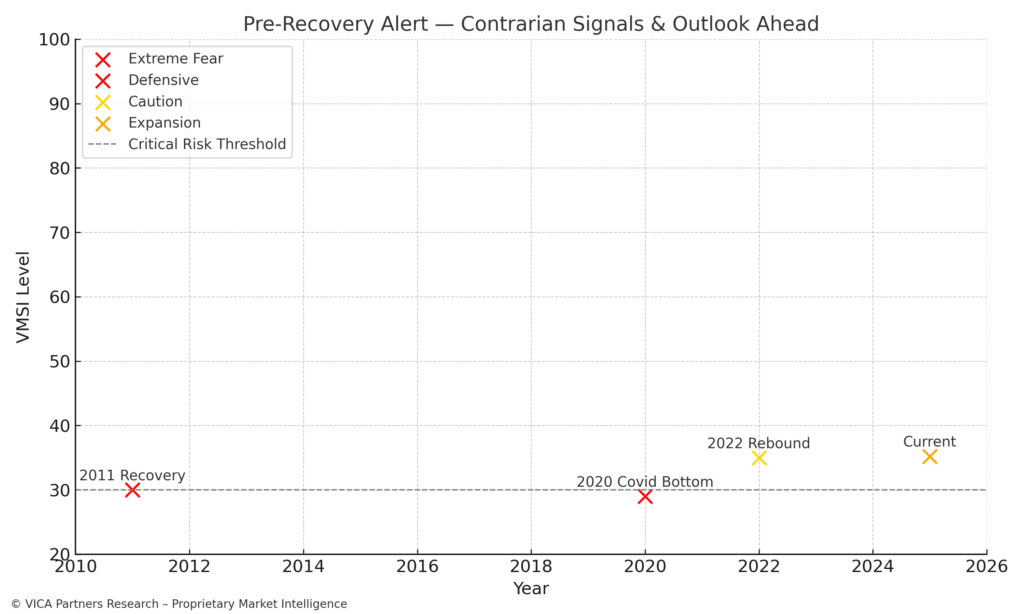
Pre-Recovery Signal Reference Chart – May 1, 2025
Sentiment, volatility, and liquidity indicators point to early-stage repair. However, macro clarity and earnings conviction remain absent. This reflects a cautious inflection rather than a confirmed reversal.
Insight: Green shoots are emerging, but the soil remains dry.
About the VICA Market Sentiment Index (VMSI)
The VICA Market Sentiment Index (VMSI) is a proprietary multi-factor sentiment model developed by VICA Research. It is designed to measure institutional risk behavior, capital allocation posture, and volatility positioning — calibrated for forward-looking asset deployment, not emotional or media-based reaction.
Each weekly score integrates structural market indicators, liquidity patterns, sector rotations, and volatility metrics. These signals are weighted dynamically across tactical and strategic timeframes.
VMSI Index Scale:
- 🔴 0–25: Critical
- 🟧 26–49: Defensive
- 🟨 50–74: Caution
- 🟩 75–100: Expansion
VMSI is engineered for institutional-grade positioning and recalibrates weekly based on the latest cross-market data.
The Index is published every Thursday following U.S. market close.
Disclaimer: This report and the proprietary VICA Market Sentiment Index (VMSI) are confidential works of authorship protected by intellectual property laws. Unauthorized reproduction, copying, redistribution, or use without express permission from VICA Research is strictly prohibited and monitored.
Primary Data Inputs: Nasdaq Market Stats, WSJ Market Data Center, ETF Flows Dashboard, NYSE/Nasdaq Short Interest, CFTC Commitment of Traders, VIX Technicals, Major U.S. Index Performance (S&P 500, Nasdaq, Dow), Treasury Yield Curves, CPI Data, Credit Spreads, Michigan Sentiment, and VICA “Pro Dashboard” analytics.
Source: VICA Partners Research – Proprietary Index Model