May 8, 2025 | VICA Research
Weekly Snapshot VMSI Score: 38.6 (Defensive Zone) S&P 500: +0.58% | Nasdaq: +1.07% | Dow: +0.62% VIX: 22.48 Momentum: 39.0 | Liquidity: 30.2 | Volatility: 59.2 | Safe Haven Demand: 78.4
Markets rallied across major indices this week, but the VICA Market Sentiment Index (VMSI) held firm within the Defensive Zone, rising modestly to 38.6. Institutions are less fearful, but conviction remains elusive. Despite lower volatility and better breadth, capital flows and macro positioning still favor caution.
What is VMSI?
The VICA Market Sentiment Index tracks institutional capital flows, risk posture, and macro volatility weekly. Built for tactical allocation — not behavioral shifts.
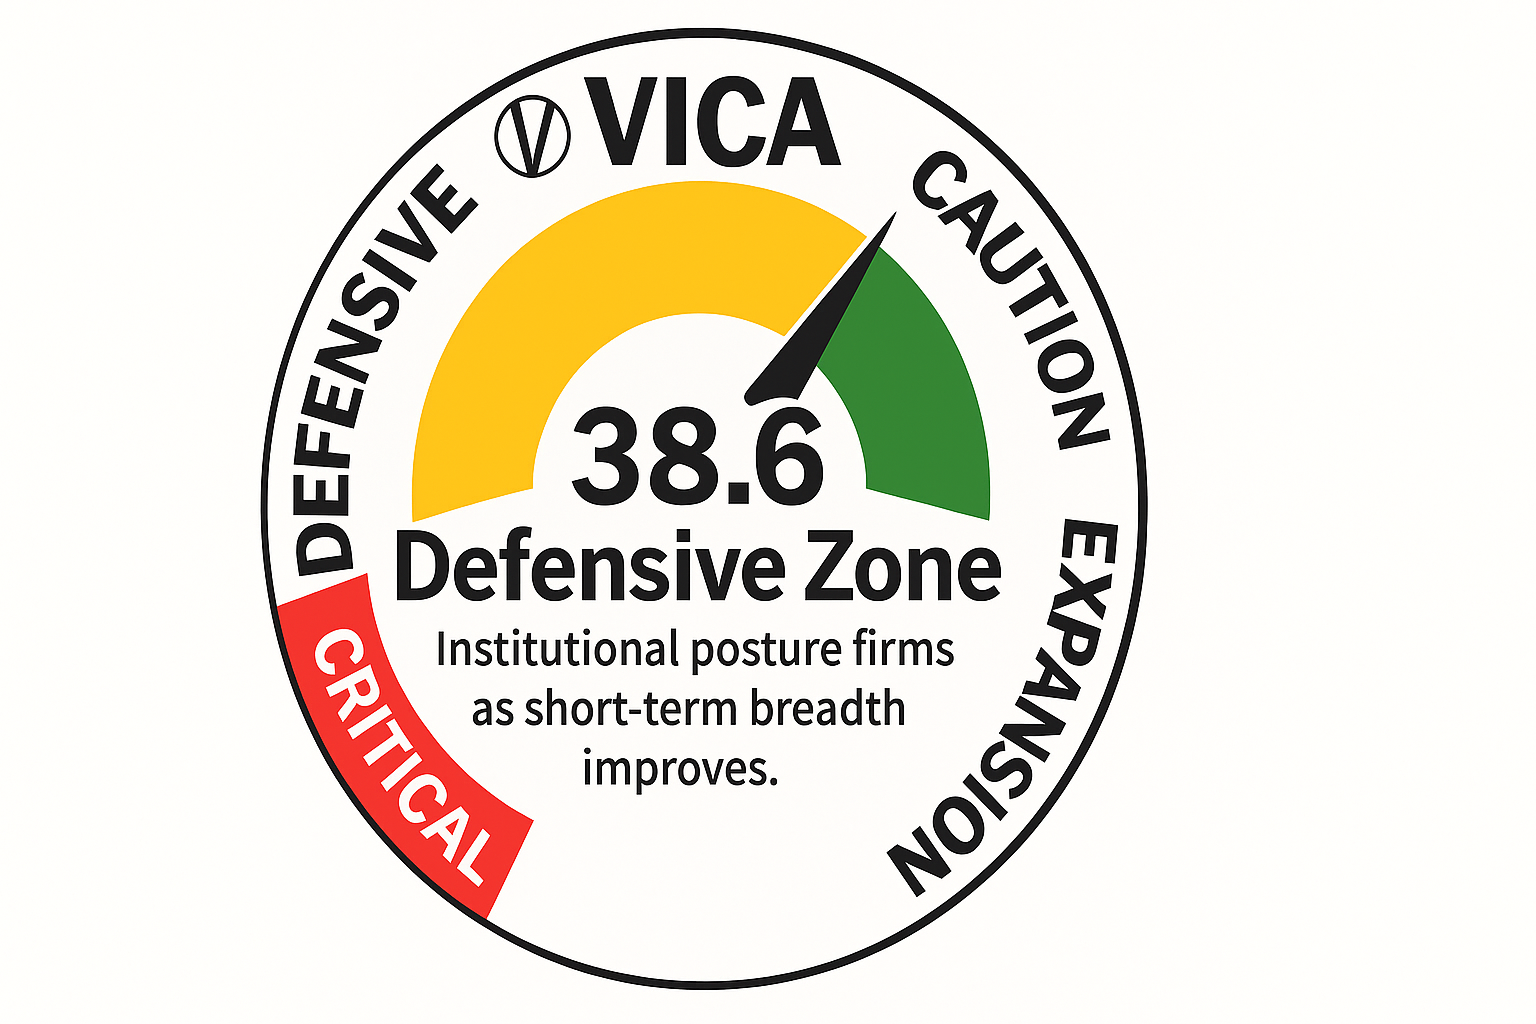
VMSI Gauge Chart — Displaying Current Sentiment and Risk Level
VMSI Gauge Score – May 8, 2025
Sentiment Score: 38.6 (Defensive Zone)
The gauge reflects a moderate sentiment improvement from 35.2, but the zone classification remains unchanged. Institutions are cautiously rebalancing, with no indication of a full re-engagement.
Insight: Caution persists as positioning stays defensive.
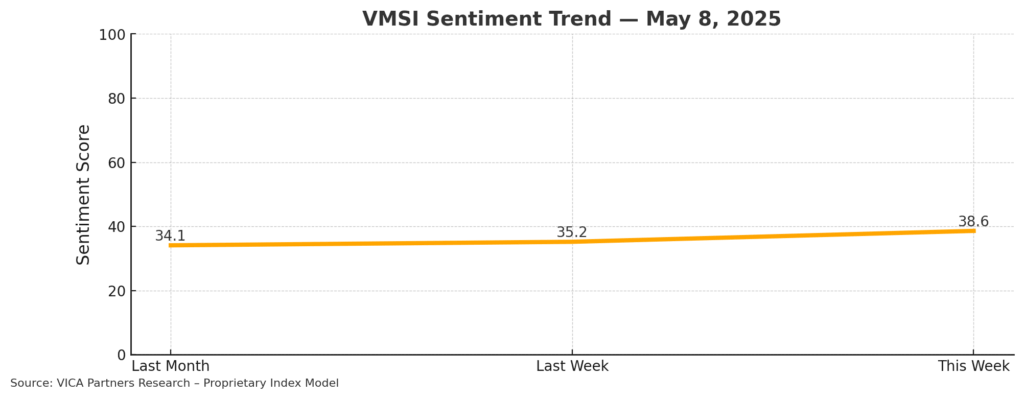
VMSI Timeline — Sentiment Shifts Over Time
VMSI Score Timeline Trend – May 8, 2025
The weekly VMSI chart shows stabilization after three volatile months. While improvement is encouraging, the trend line underscores that confidence is tentative.
Insight: Recovery is emerging, but not yet reliable.
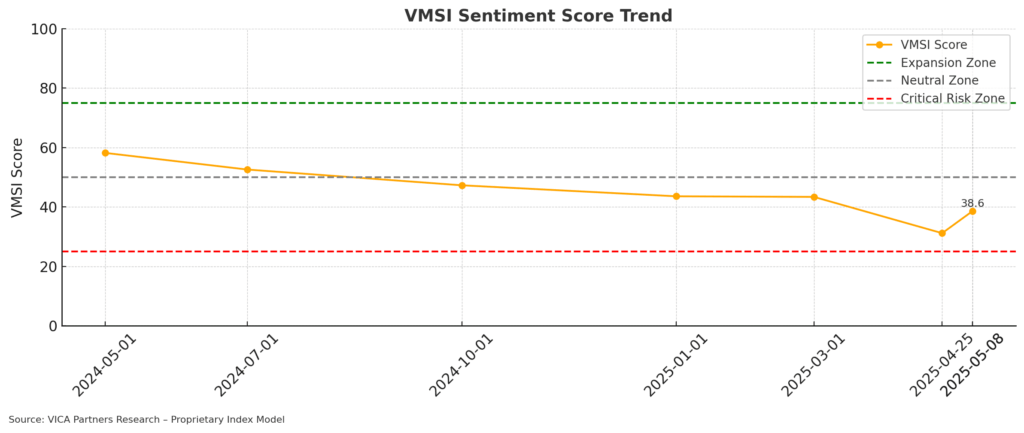
Market Momentum — Institutional Accumulation Trends
Market Momentum Trend – May 8, 2025
Momentum continued its modest rebound, driven by short-term gains in major indices. However, longer-term technicals remain fragile, and underlying accumulation is still limited.
Insight: Momentum is reactive, not strategic.
Liquidity Flows — Capital Movement Patterns
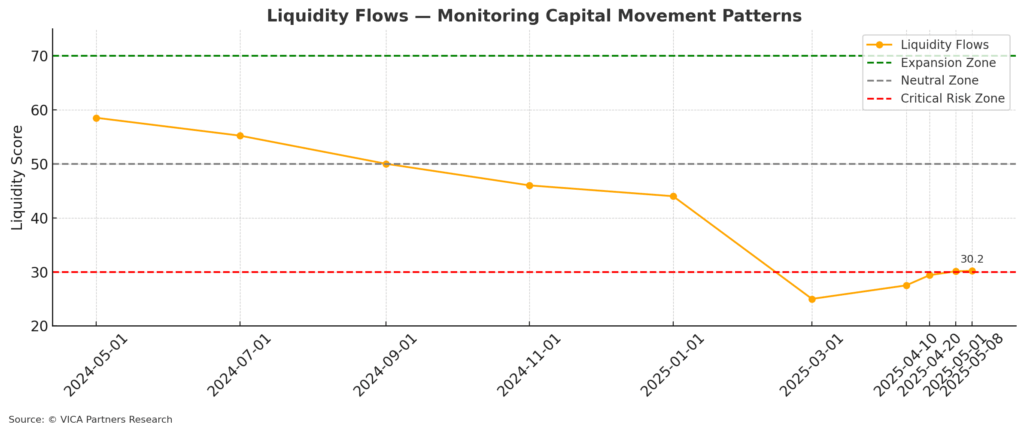
Liquidity Flows Trend – May 8, 2025
Liquidity remained below critical thresholds. While some equity inflows returned, redemptions in high yield and outflows from growth-focused ETFs persist. Demand remains concentrated in defensive segments.
Insight: Liquidity is stabilizing but not expanding.
Volatility & Risk Hedging — Market Uncertainty Barometer
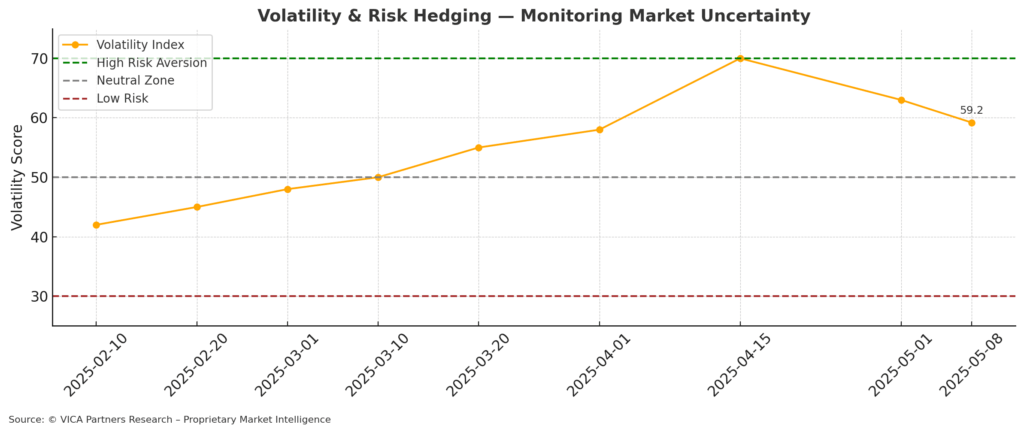
Volatility & Risk Hedging Trend – May 8, 2025
The VIX dropped to 22.48, reflecting a pullback in near-term hedging. Still, institutional demand for downside protection is elevated compared to historical averages.
Insight: Risk aversion is softening but not gone.
Safe Haven Demand — Flight to Quality
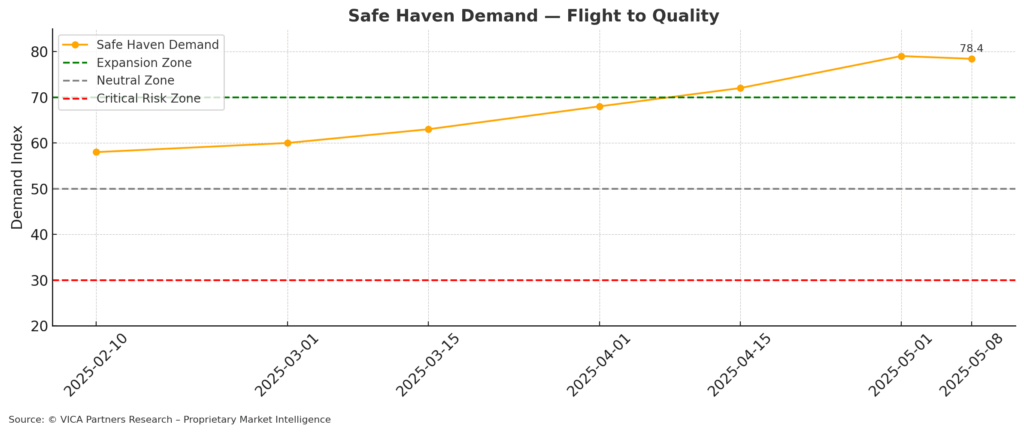
Safe Haven Demand Trend – May 8, 2025
Demand for Treasuries and long-duration assets held near recent highs. The 10-Year yield ticked higher to 4.37%, but safe haven ETF flows remain strong.
Insight: Institutions still favor quality in uncertain terrain.
Defensive Sector Performance — Risk-Off Rotation within Equities
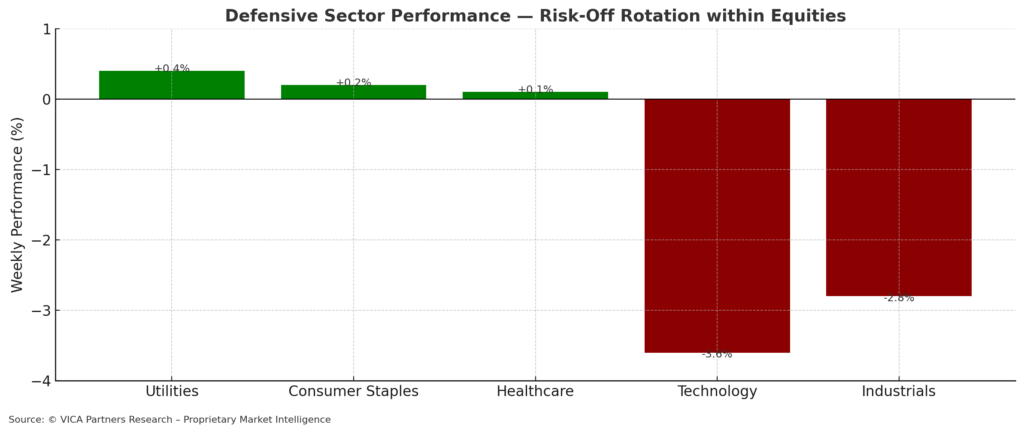
Sector Rotation Performance – May 8, 2025
Utilities, Staples, and Healthcare again outperformed growth and cyclicals. Tech lagged despite index-level rebounds, while Industrials remained under pressure.
Insight: Equity strength is defensive, not growth-led.
Institutional Positioning Snapshot — May 8, 2025
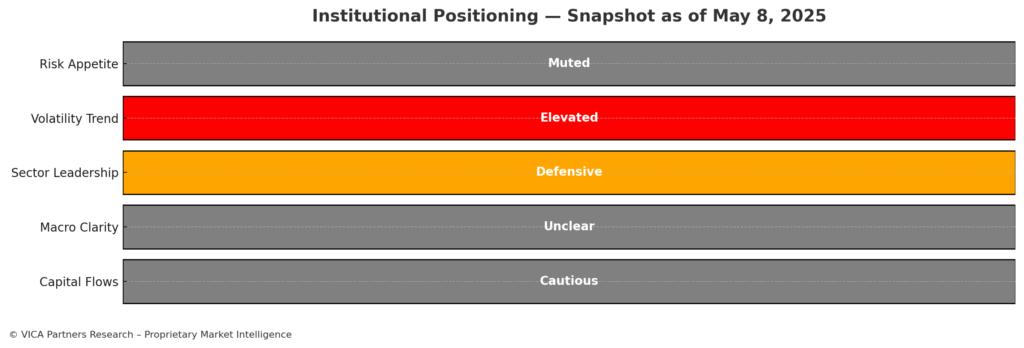
Institutional Positioning Grid – May 8, 2025
Positioning across five key categories remained cautious:
-
Risk Appetite: Muted
-
Volatility Trend: Elevated
-
Sector Leadership: Defensive
-
Macro Clarity: Unclear
-
Capital Flows: Cautious
Insight: Institutions are participating tactically, not convictionally.
Pre-Recovery Alert — Contrarian Signals & Outlook Ahead
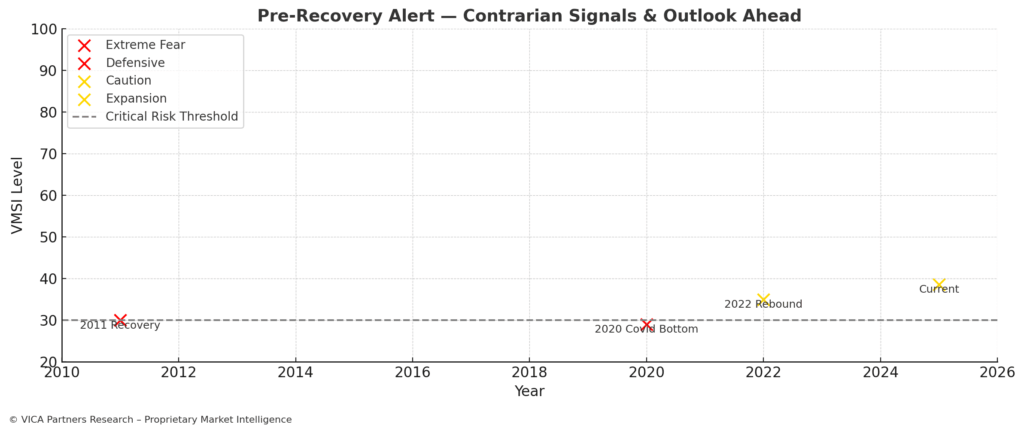
Pre-Recovery Historical Map – May 8, 2025
VMSI levels remain historically aligned with prior market bottoms (2011, 2020). While not predictive, these levels tend to precede medium-term rallies once macro clarity improves.
Insight: Historical patterns suggest we may be near a pivot, but patience is key.
About the VICA Market Sentiment Index (VMSI)
The VMSI is VICA Research’s proprietary sentiment gauge designed to track shifts in institutional risk behavior, capital flow posture, and macro-driven volatility signals.
Each weekly score reflects a multi-factor model that incorporates a blend of market structure, flow dynamics, defensive rotation, and volatility hedging — calibrated against key technical and behavioral thresholds.
Index scale:
-
0–25: Critical Risk Zone
-
26–49: Defensive
-
50–74: Cautionary Optimism
-
75–100: Expansion / High Confidence
Unlike retail-facing indicators, VMSI is engineered for tactical allocation and capital positioning — not emotion or media headlines. VICA publishes the index weekly to offer a forward-focused lens on institutional sentiment and market inflection dynamics.
The VMSI updates weekly following Thursday’s market close.
Disclaimer: This report and the proprietary VICA Market Sentiment Index (VMSI) are confidential works of authorship protected by intellectual property laws. Unauthorized reproduction, copying, redistribution, or use without express permission from VICA Research is strictly prohibited and monitored.
A portion of future VMSI-related proceeds will support global literacy, vocational education, and the advancement of scholars in critical fields like engineering — with a commitment to measurable impact and long-term social return.


