Stay Informed and Stay Ahead: Research, December 31st, 2024
January Financial Markets: A Fibonacci Perspective on the S&P 500 Post-Election Years
January is pivotal for financial markets. With the S&P 500 as the bellwether of U.S. equity performance, market participants examine historical trends for strategic insights. One lens to explore is Fibonacci analysis, often applied in technical analysis. Layered with post-election year nuances, it reveals compelling patterns.
The January Barometer: Myth or Market Reality?
The adage “as January goes, so goes the year” holds relevance on Wall Street. Historically, January offers early signals of market sentiment. Post-election years amplify this, as new policies and fiscal changes ripple through markets. The S&P 500 often sees heightened volatility as investors assess administrative priorities. Over the past 50 years, post-election Januarys have, on average, returned slightly lower gains, reflecting caution.
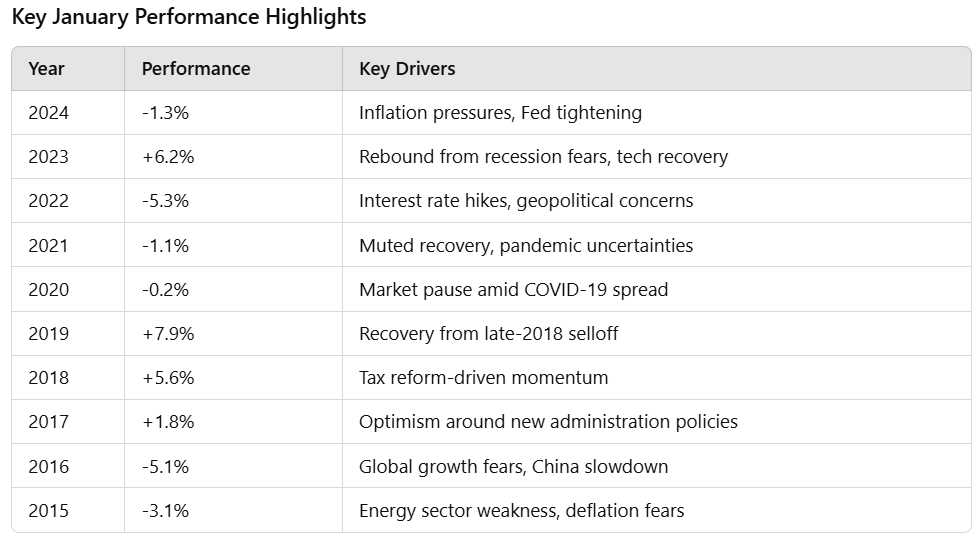
S&P 500 January Returns Over the Past Decade
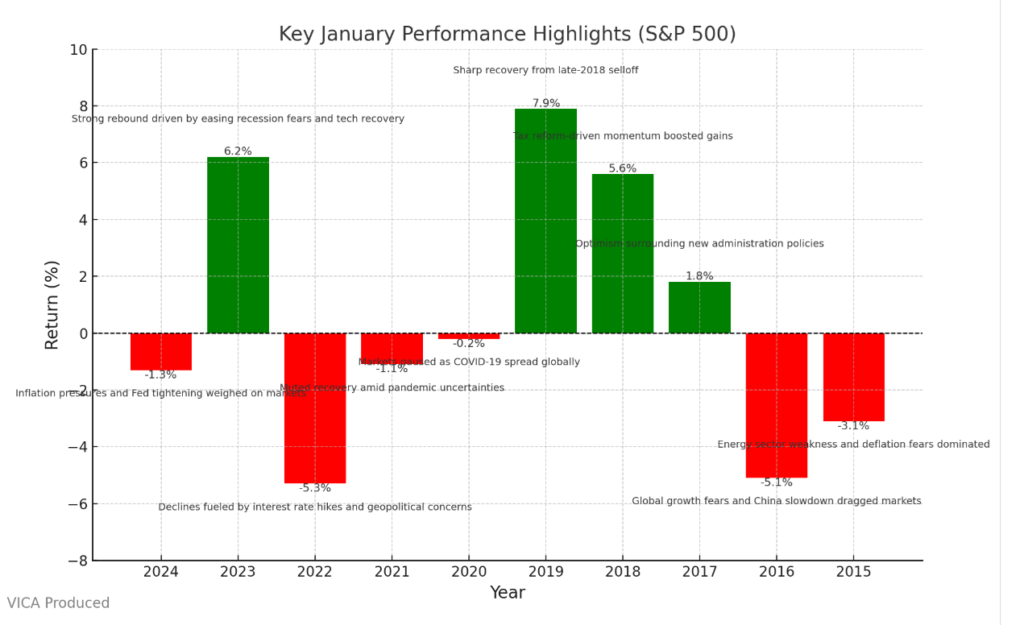
Key Takeaway: January S&P 500 returns reflect market sentiment shifts, with sharp rebounds in recovery years and declines during uncertainty.
Key January performance highlights:
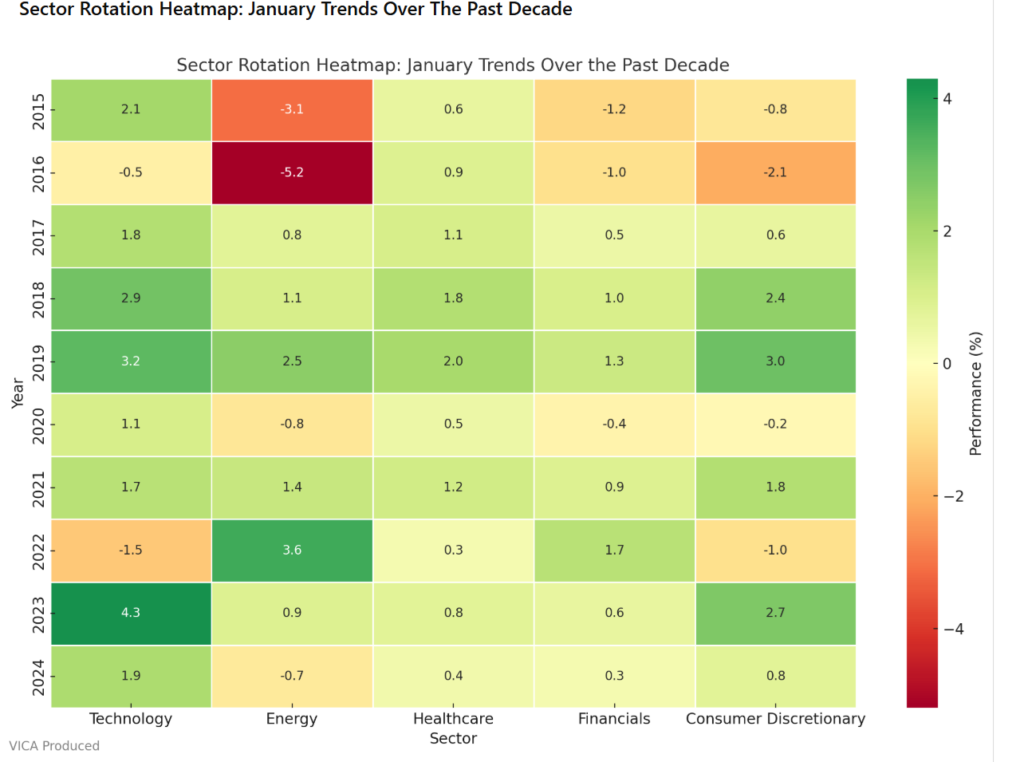
S&P 500 Sector Analysis: January Performance Over the Past Decade
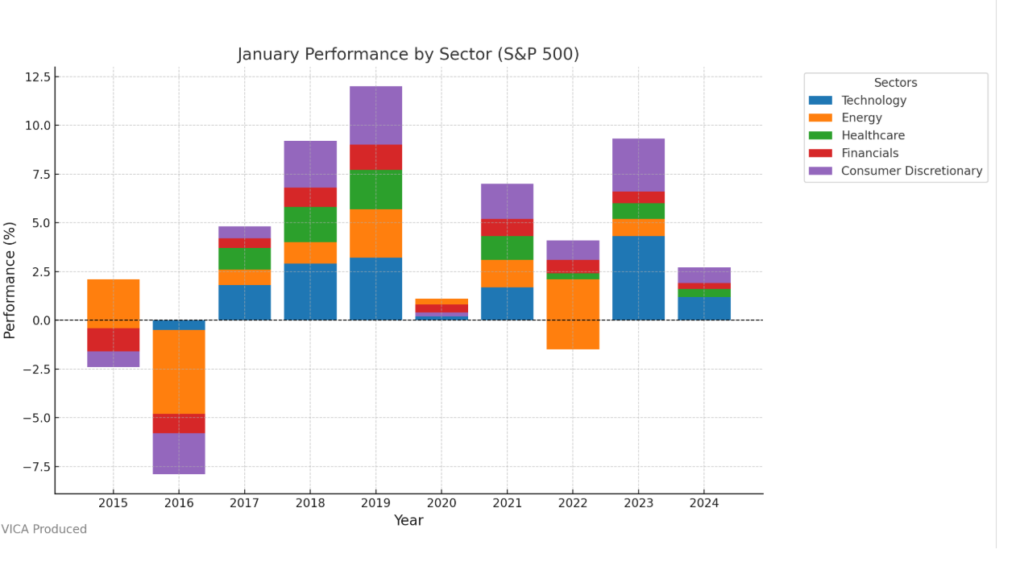
Key Takeaway: Sector performance in January reveals Technology’s consistent leadership, Energy’s volatility, and Healthcare’s defensive resilience, offering critical insights for strategic allocation.
Sector performance trends:
- Technology: Leading performer in innovation-driven years like 2019 and 2023.
- Energy: Volatile, reflecting oil price swings (e.g., declines in 2015, rebounds in 2022).
- Healthcare: Consistent during uncertainty, with defensive gains in 2020 and 2021.
- Financials: Linked to interest rates; strong in 2022 but weaker in 2020.
- Consumer Discretionary: Consumer confidence drives gains, as seen in 2018, but inflation hit in 2022.
Technical Perspectives: RSI, Volume, and Volatility
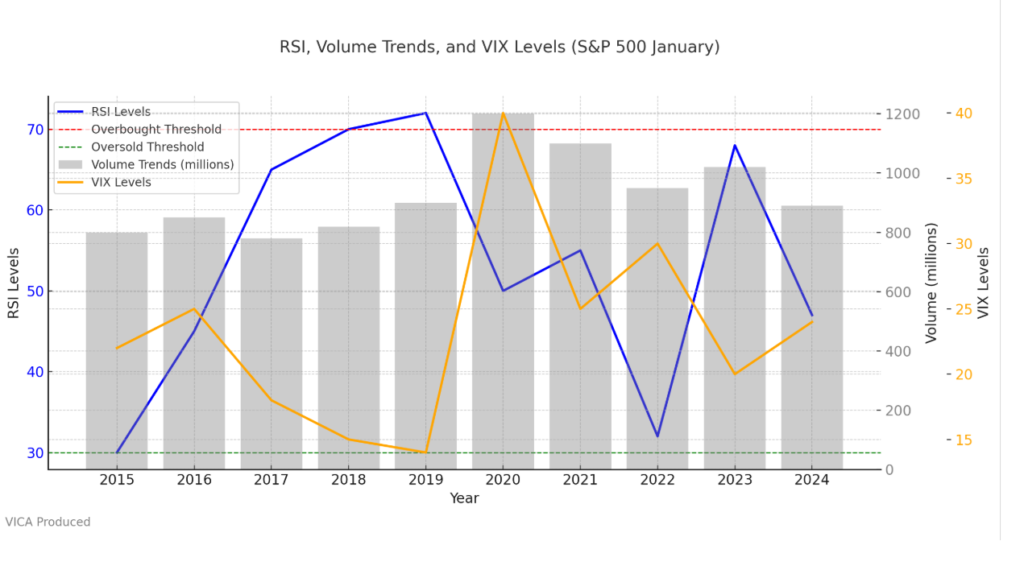
Key Takeaway: Investors should closely monitor spikes in VIX (fear) alongside high trading volumes (conviction) and RSI trends (momentum) to identify key January market turning points and align their strategies.
- RSI: Overbought levels (>70) in strong years (e.g., 2019), oversold (<30) in weak ones (e.g., 2022).
- Volume: High January trading volumes signal conviction during key years like 2020 and 2022.
- Volatility (VIX): Spikes in 2016 and 2022 reflect market fears amid growth and inflation concerns.
Correlation with Bond Yields
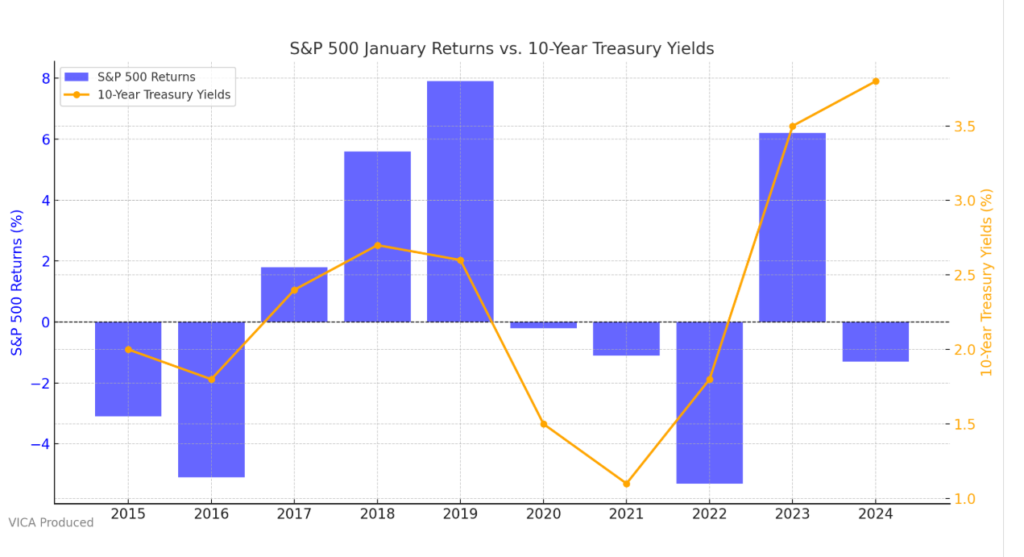
Key Takeaway: The chart reveals that rising Treasury yields often pressure equity markets, particularly growth sectors, while falling yields tend to support stronger S&P 500 January performance, guiding investor strategy in rate-sensitive environments.
S&P 500 performance ties closely to bond yield trends. Rising yields (2022) hurt growth sectors like Technology, while falling yields (2019) supported equity markets.
Moving Averages and Historical Volatility
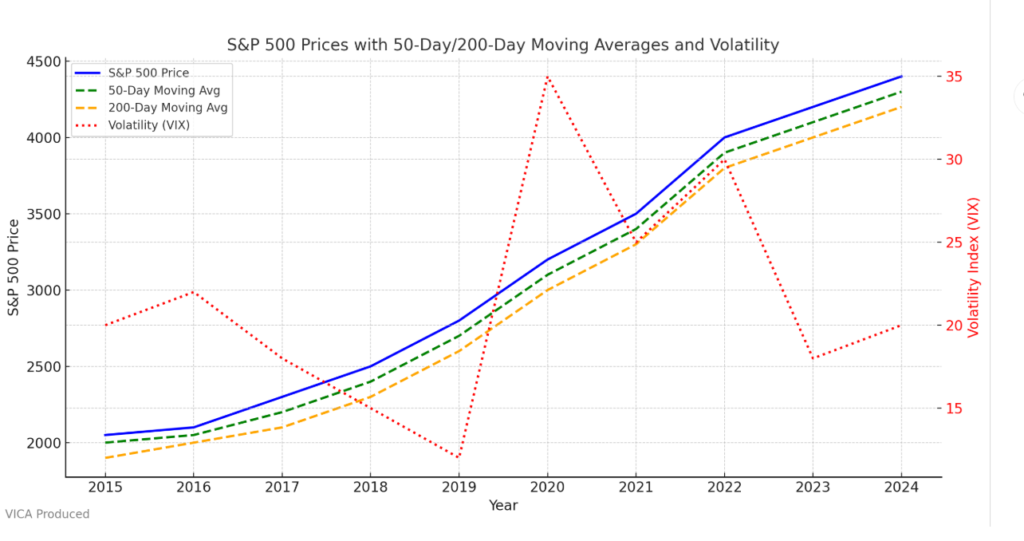
Key Takeaway: This chart illustrates that maintaining price levels above the 50-day and 200-day moving averages signals market strength, while spikes in volatility highlight external shocks investors must account for in their strategies.
- Moving Averages: Strong years (e.g., 2019) stayed above 50-day averages. Weak years (e.g., 2020) struggled to maintain levels.
- Volatility: Peaks in 2016 and 2022 underscore external shocks like global growth fears and inflation.
Sector Pairing Strategies
Pairing sectors based on January trends can optimize returns. For instance, combining Technology and Consumer Discretionary in bullish years (e.g., 2019) amplifies growth. Defensive pairings like Healthcare and Utilities hedge volatility (e.g., 2020).
Fibonacci Levels: The Technical Analyst’s Compass
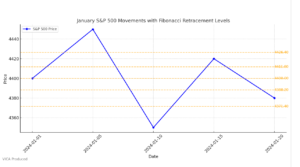
Key Takeaway: The chart demonstrates that Fibonacci levels help investors identify critical support and resistance points, providing actionable signals for portfolio adjustments in volatile January markets.
Fibonacci retracements (50%, 61.8%, 38.2%) highlight critical S&P 500 levels. In 2017, the index respected the 38.2% level, supporting a bull rally. In 2009, it struggled at the 50% level amid uncertainty.
The 2025 Outlook: What’s Different This Time?
The Federal Reserve’s uncertain policy, moderating inflation, and sector recoveries define 2025. Fibonacci analysis suggests resistance at 4,800 (61.8%) and support at 4,350 (50%). These levels could set the year’s tone amid volatility.
How Vica Would Play This Data: A Long-Term Perspective
Key Takeaway: Focus on Technology and Consumer Discretionary if markets are poised for growth in January, shift to Healthcare and Utilities in volatile conditions, and monitor Energy for short-term opportunities.
Final Words
At Vica, we emphasize long-term strategy over short-term fluctuations. By integrating indicators like Fibonacci retracements, RSI, and volume, we construct adaptable portfolios.
Our approach prioritizes sector allocation. Defensive sectors (Healthcare, Utilities) gain focus during uncertainty, while growth sectors (Technology, Consumer Discretionary) dominate in recovery years. Tools like moving averages and volatility trends guide entry and exit points.
Vica views January not as a predictor but a signal within larger market cycles. This perspective ensures strategies remain resilient, aligning with client goals through market complexities.
The Broader Implications
Post-election Januarys often act as market proving grounds. The S&P 500’s 2025 performance will reflect sentiment and expectations. Breaking key Fibonacci levels could signal market confidence in the administration or broader economic uncertainties. Investors must remain disciplined, leveraging technical and fundamental tools to navigate the year ahead.