Stay Informed and Stay Ahead: Market Watch, February 29th, 2024.
Market Highlights & Analysis: Indices, Sectors, and More…
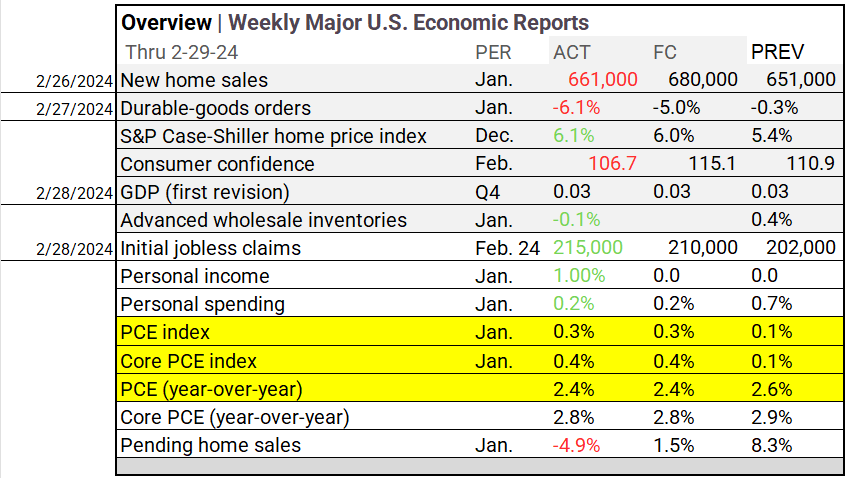
- Economic Data: In January, PCE index rose by 0.3%, meeting expectations. Year-over-year PCE stood at 2.4%, aligning with forecasts and down from 2.6%.
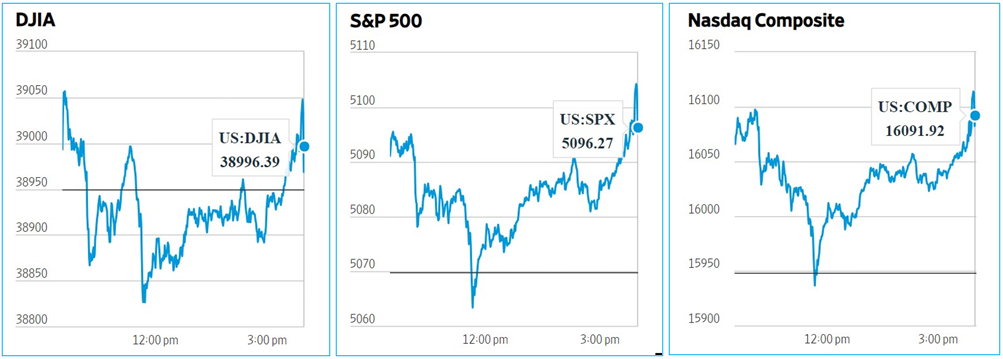
- Market Indices: DJIA (+0.12%), S&P 500 (+0.52%), Nasdaq Composite (+0.90%).
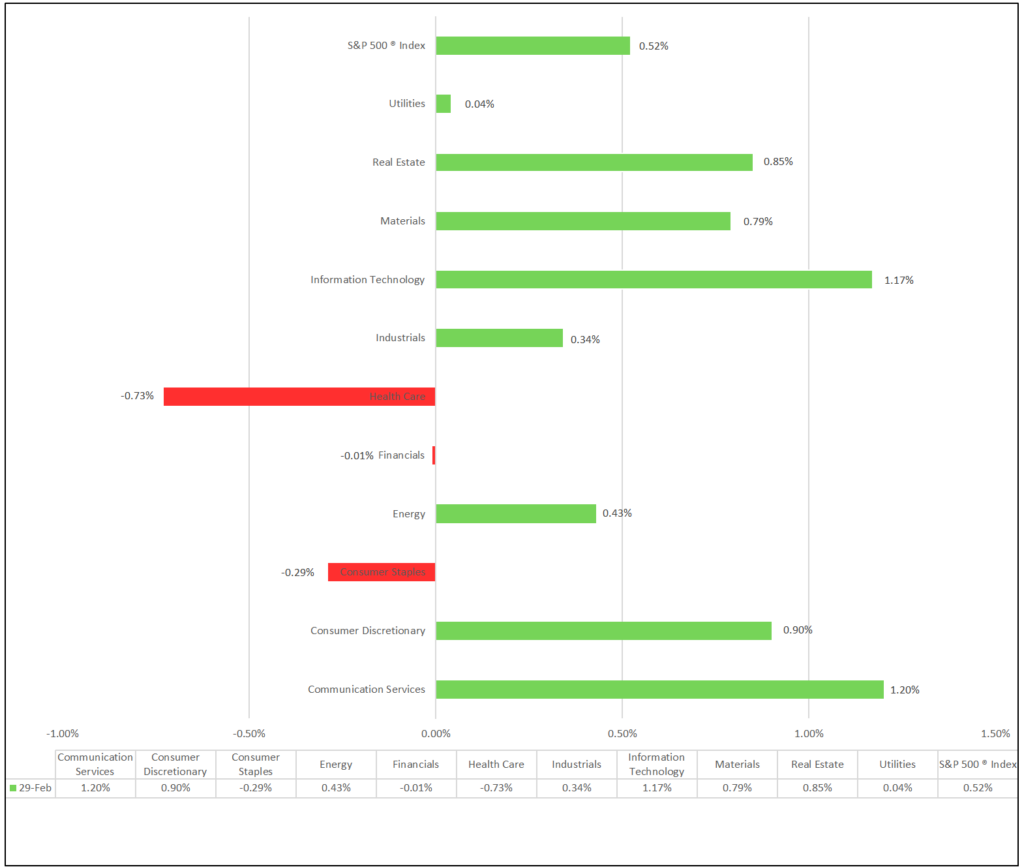
- Sector Performance: 8 of 11 sectors higher; Communication Services (+1.20%) leading, Health Care (-0.73%) lagging. Top industry: Office REITs (+2.31%).
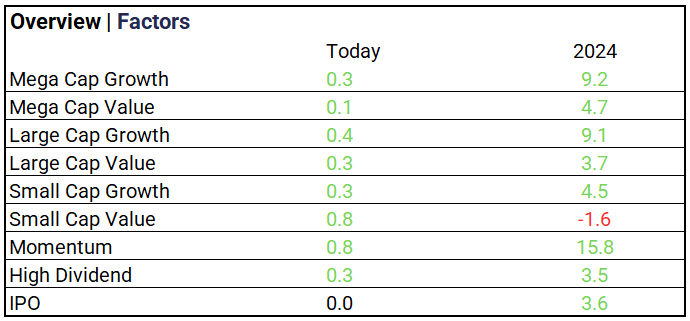
- Factors: Small Caps Value and Momentum lead on the day.
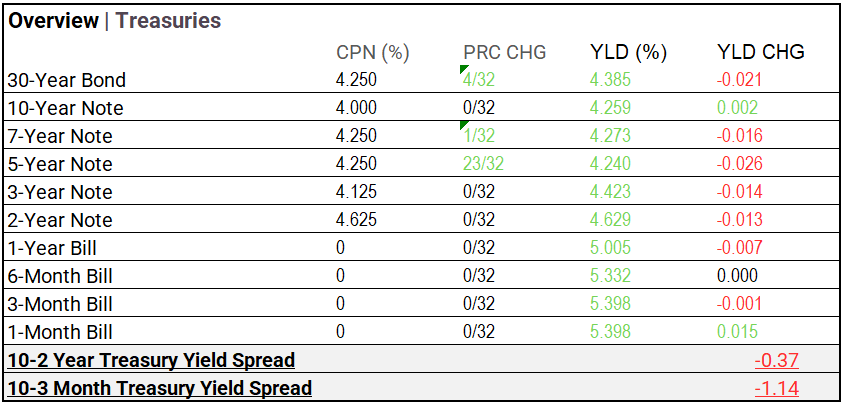
- Treasury Markets: Bond yields slightly fluctuated across the curve.
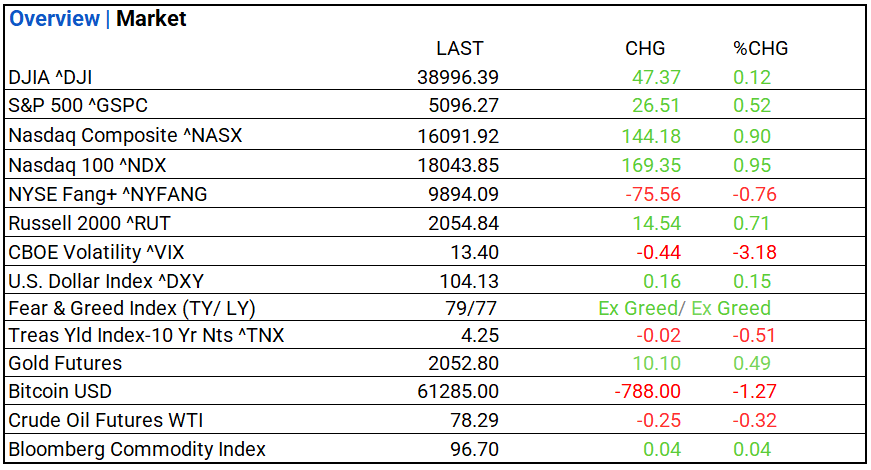
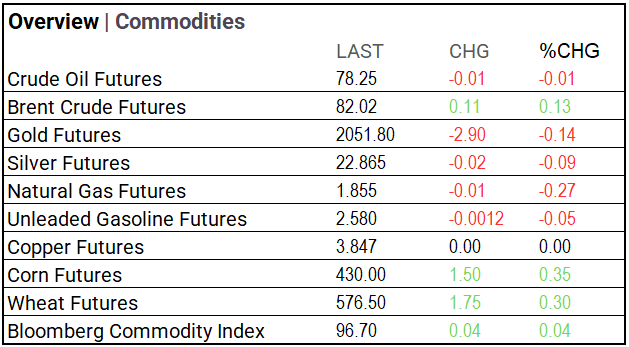
- Commodities: Gold up $10.10, Bitcoin down $788.00, Oil drops $0.25, Commodity Index rises $0.04.
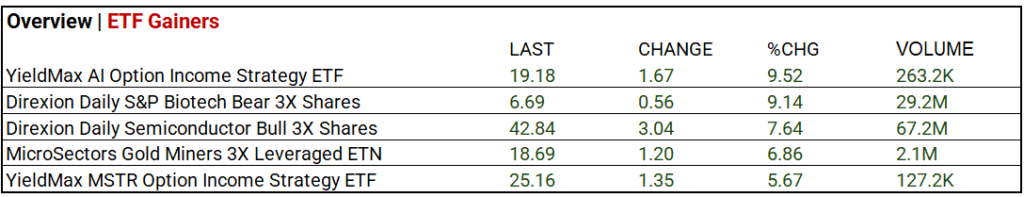
- ETFs: Direxion’s S&P Biotech Bear 3X ETF +9.14% on 29.2M volume; Semiconductor Bull 3X ETF rose 7.64% on 67.2M volume.
US Market Snapshot: Key Stock Market Indices:
- DJIA ^DJI: 38,996.39, 47.37, 0.12%
- S&P 500 ^GSPC: 5,096.27, 26.51, 0.52%
- Nasdaq Composite ^NASX: 16,091.92, 144.18, 0.90%
- Nasdaq 100 ^NDX: 18,043.85, 169.35, 0.95%
- NYSE Fang+ ^NYFANG: 9,894.09, -75.56, -0.76%
- Russell 2000 ^RUT: 2,054.84, 14.54, 0.71%
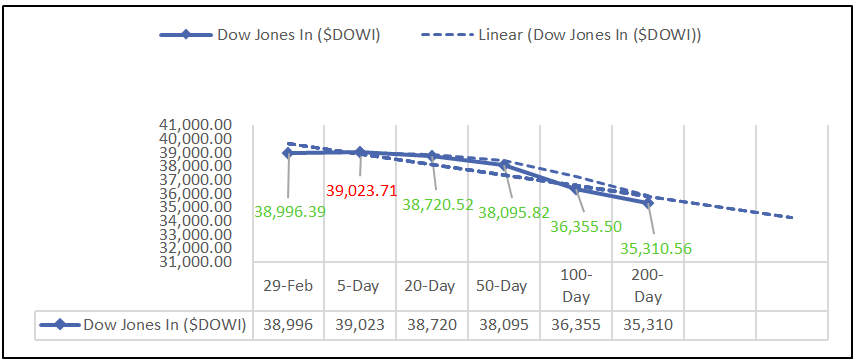
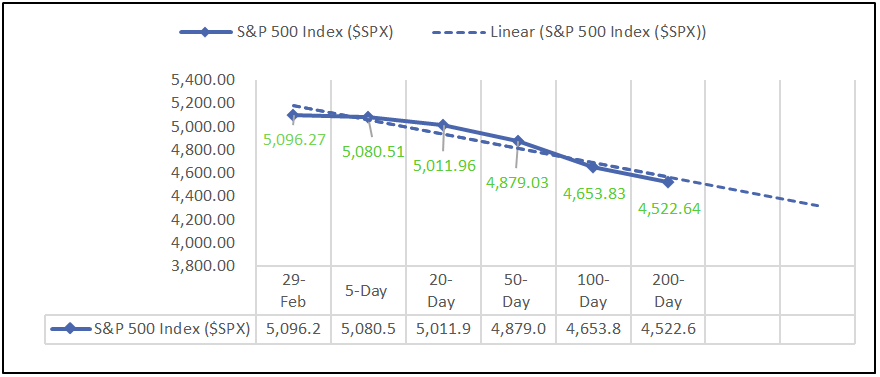
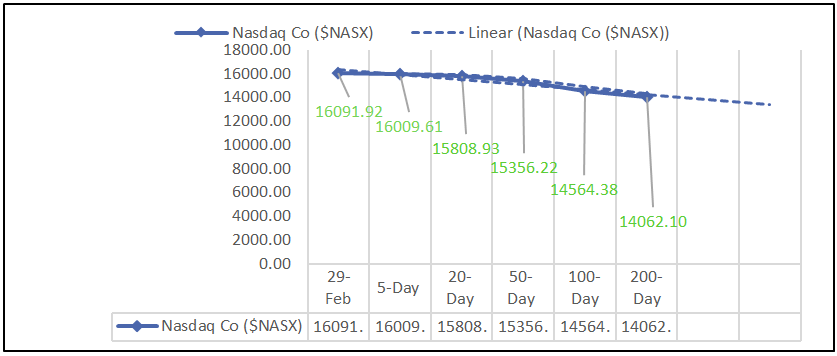
Moving Averages: DOW, S&P 500, NASDAQ:
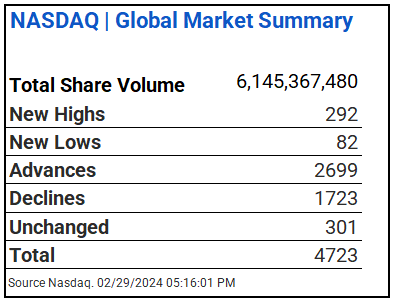
NASDAQ Global Market Summary:
Sectors:
- 8 of 11 sectors higher; Communication Services (+1.20%) leading, Health Care (-0.73%) lagging. Top industries: Office REITs (+2.31%), Semiconductor & Semiconductor Equipment (+2.29%), Broadline Retail (+2.02%), and Containers & Packaging (+1.79%).
Factors:
- Small Caps Value and Momentum lead on the day, Momentum +15.8% YTD.
Treasury Markets:
- Bond yields slightly fluctuated across the curve.
Currency and Volatility:
- U.S. Dollar Index ^DXY: 104.13 (+0.16, +0.15%)
- CBOE Volatility ^VIX: 13.40 (-0.44, -3.18%)
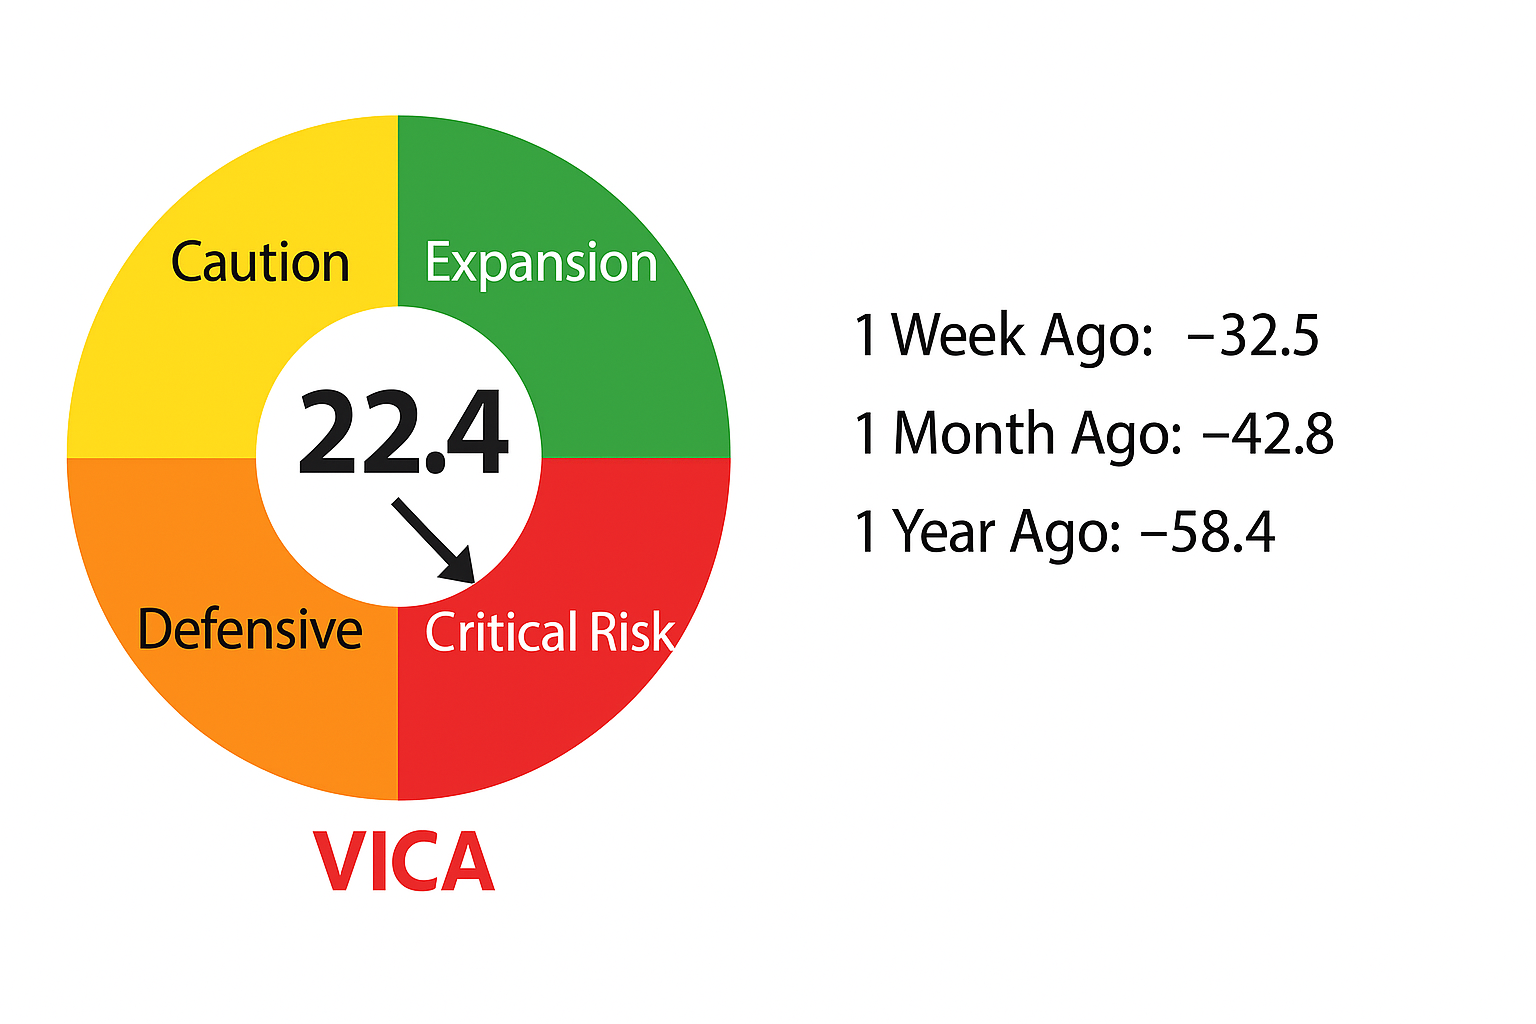
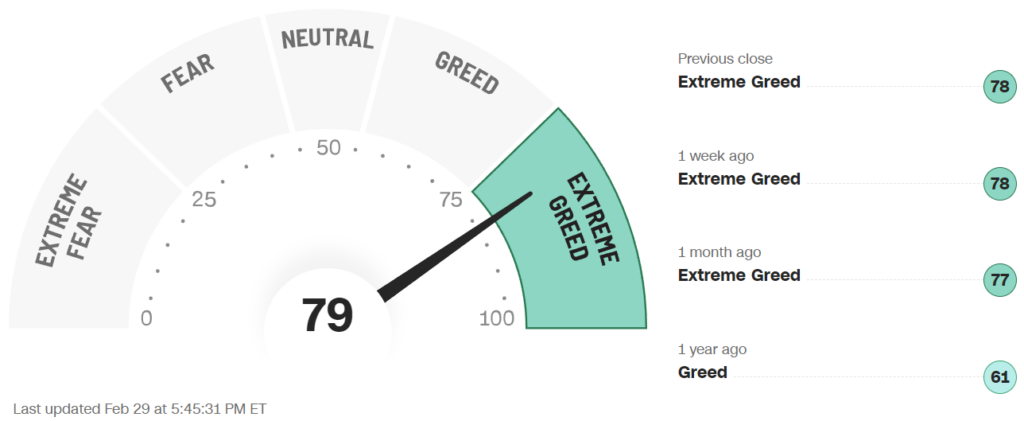
- Fear & Greed Index: 79/LY 77 (Extreme Greed/ Extreme Greed)
Commodity Markets:
- Gold Futures: $2,052.80, +$10.10, +0.49%
- Bitcoin USD: $61,285.00, -$788.00, -1.27%
- Crude Oil Futures WTI: $78.29, -$0.25, -0.32%
- Bloomberg Commodity Index: 96.70, +$0.04, +0.04%
Note: differences in chart due to post market activity
ETF’s:
- Direxion’s S&P Biotech Bear 3X ETF +9.14% on 29.2M volume; Semiconductor Bull 3X ETF rose 7.64% on 67.2M volume.
US Economic Data:
- In January, PCE index rose by 0.3%, meeting expectations. Year-over-year PCE stood at 2.4%, aligning with forecasts and down from 2.6%.
Earnings:
- Q4 Forecast: Analysts significantly lowered S&P 500 companies’ Q4 earnings per share (EPS) estimates during October and November, with a 5.0% decline in the bottom-up EPS estimate. This drop surpasses the average declines over the past 5, 10, 15, and 20 years, marking the most substantial decrease since Q1 2023. Among sectors, Health Care experienced the largest decline (-19.9%), while Information Technology saw a modest increase (+1.5%) in their Q4 2023 bottom-up EPS estimates.
Notable Earnings Today:
- BEAT: Toronto Dominion Bank (TD), Dell Tech (DELL), Autodesk (ADSK), Zscaler (ZS), Hewlett Packard (HPE), NetApp (NTAP), Best Buy (BBY), Hormel Foods (HRL), Celsius (CELH).
- MISSED: Anheuser Busch ADR (BUD), NetEase (NTES).
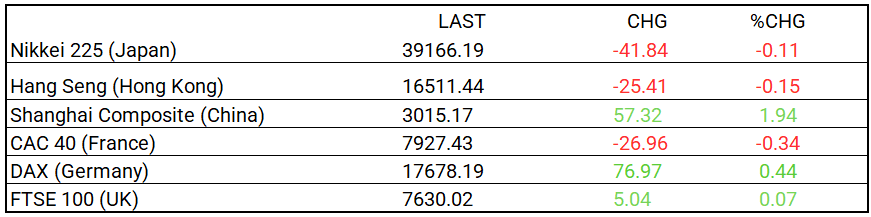
Global Markets Summary: Asian & European Markets:
- Nikkei 225 (Japan): 39,166.19, -41.84, -0.11%
- Hang Seng (Hong Kong): 16,511.44, -25.41, -0.15%
- Shanghai Composite (China): 3,015.17, +57.32, +1.94%
- CAC 40 (France): 7,927.43, -26.96, -0.34%
- DAX (Germany): 17,678.19, +76.97, +0.44%
- FTSE 100 (UK): 7,630.02, +5.04, +0.07%
Central Banking and Monetary Policy, Noteworthy:
- One Says 2.4%, Another Says 3.1%. Which Inflation Metric Is Right? – WSJ
- Fed’s Preferred Inflation Metric Increases by Most in a Year – Bloomberg
Energy:
- Frackers Are Now Drilling for Clean Power – WSJ
- Homebuilders Are Fighting Green Building. Homeowners Will Pay. – Bloomberg
China:
- Breaking | China’s manufacturing activity falls for fifth consecutive month in February – SCMP