VMSI Institutional Market Intelligence Report – Week Ending September 18, 2025 (Published September 19, 2025)
Weekly Summary – Week Ending September 18, 2025
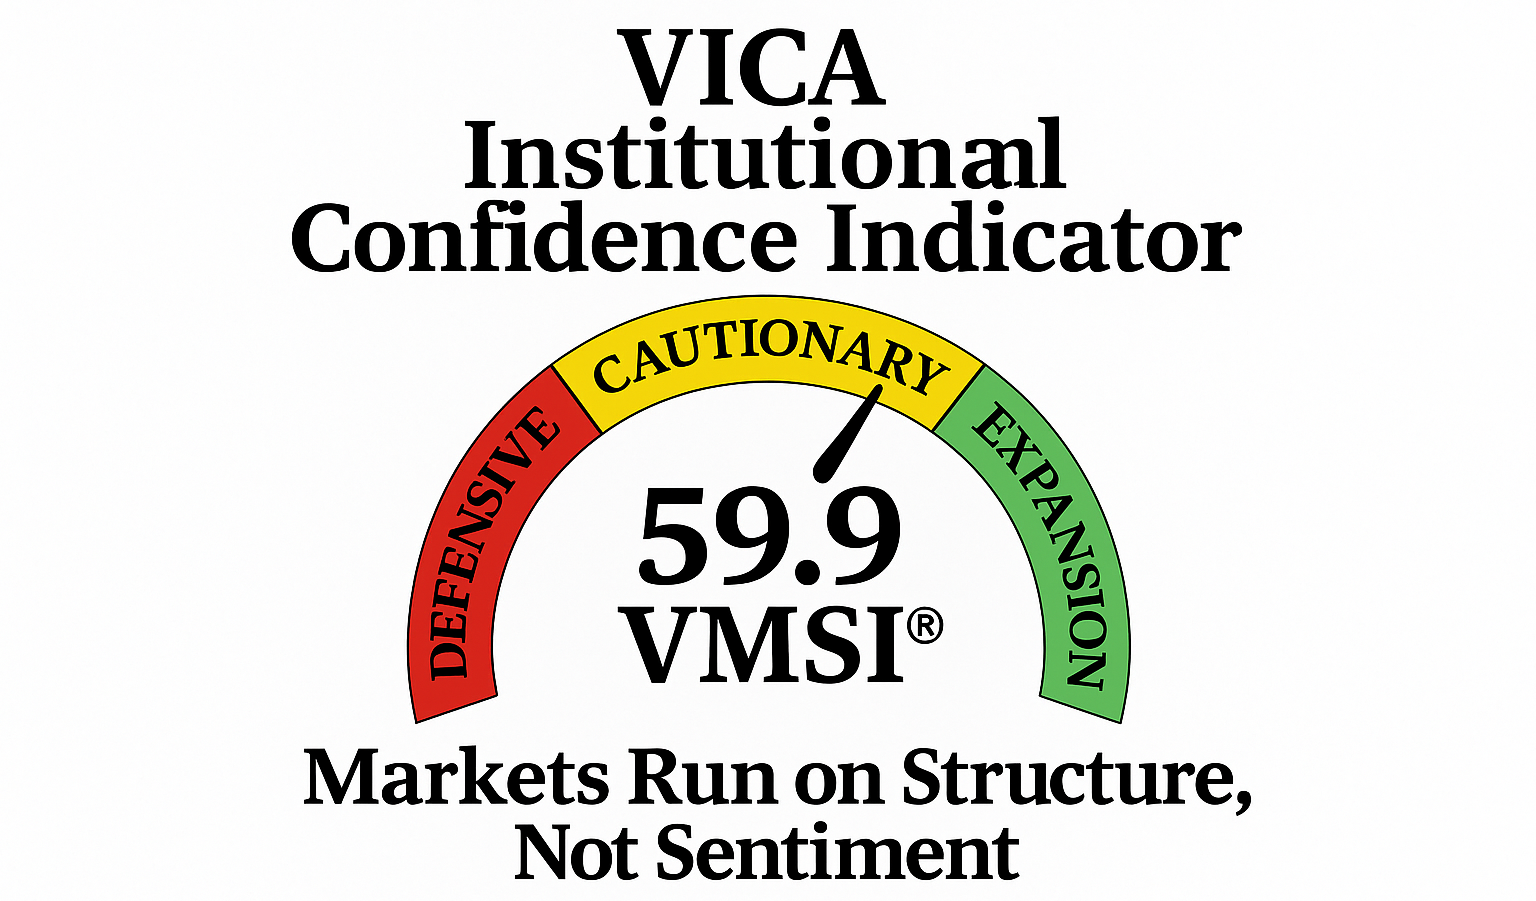
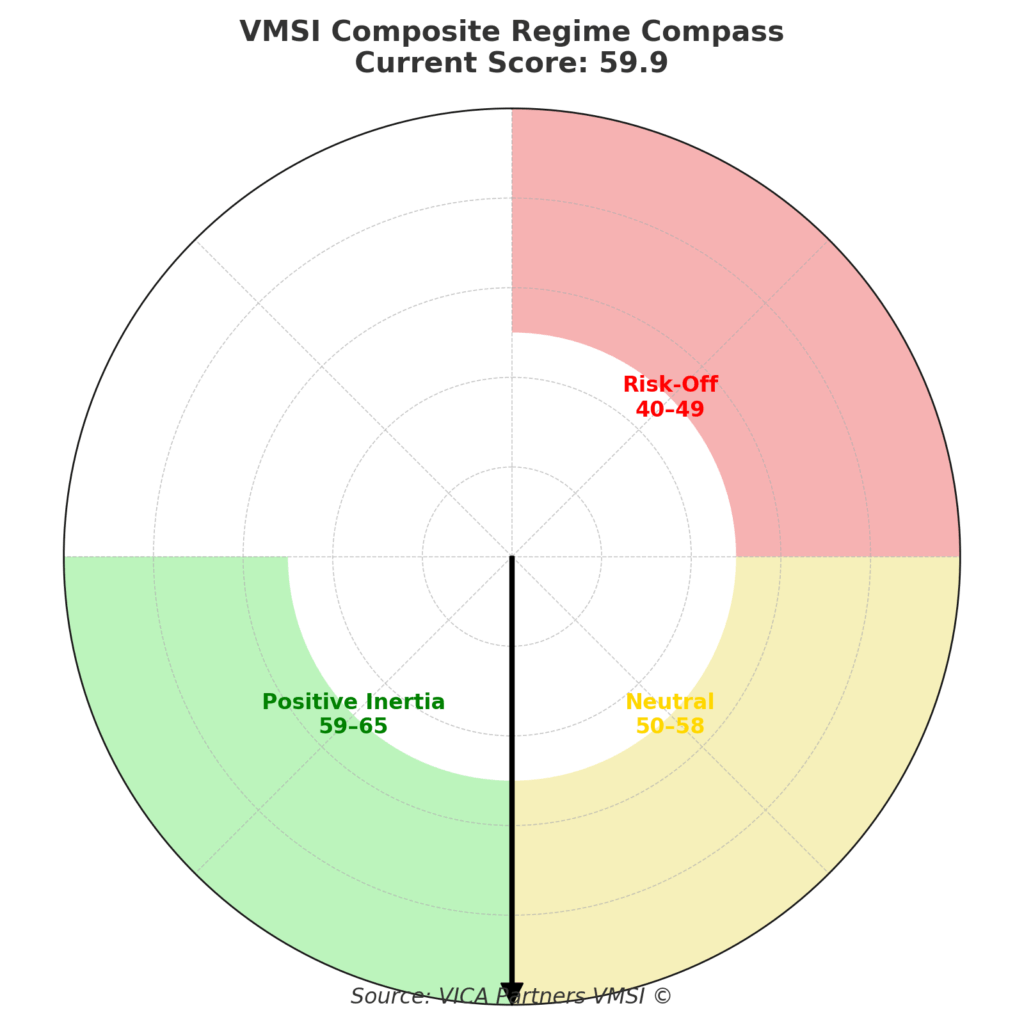
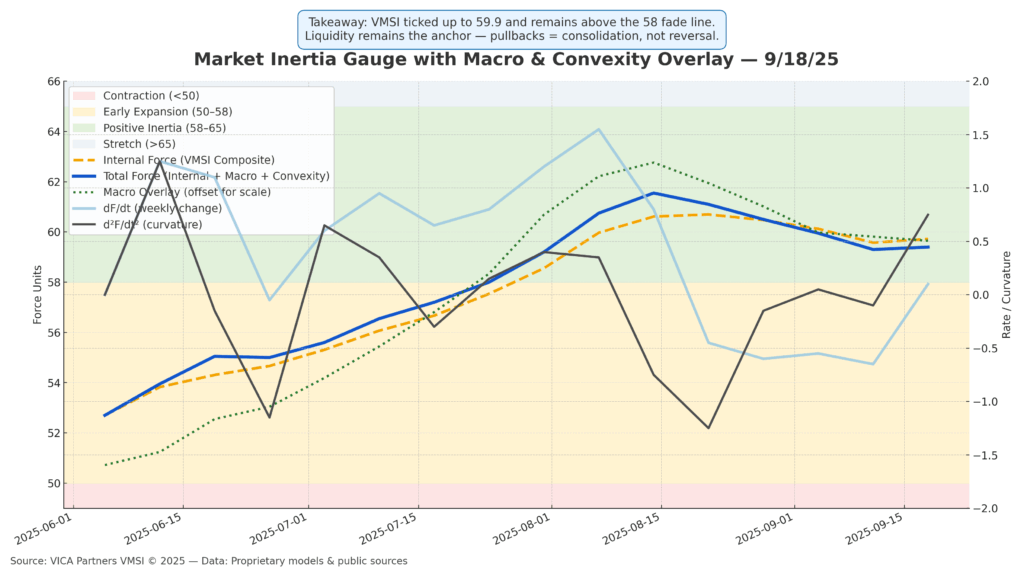
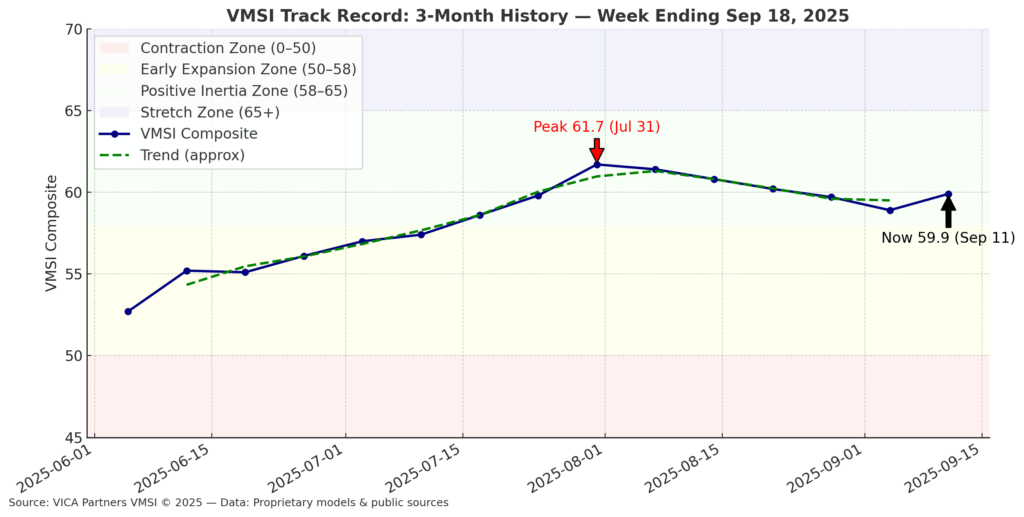
The VMSI composite index ticked higher to 59.9 from 58.9, reinforcing the resilience of structural liquidity in holding the market together. While sector breadth remains mixed and macro signals softened, liquidity depth and execution capacity continue to suppress fragility. Pullbacks compress rather than cascade.
Macro context: CPI +0.4% m/m (+2.9% y/y), core 3.1% y/y. Claims fell to 231k. The Philadelphia Fed manufacturing survey jumped to 23.2, while LEI declined –0.5%. Fed policy unchanged; rates markets price <10% chance of hikes in 2025.
Market tone: Volatility compressed (VXX 32.9, –29% YTD), block trade activity stable, credit spreads tight. Dollar index at 97.4, UST 10Y steady at 4.13%. Gold slid to $3,672, crude oil held at $64.3.
Structural signal: Liquidity flow multipliers intact, repo steady, cross-asset correlations supportive. No VMSI component below the 55 “fade” threshold.
Allocator Note: With composite firmly above 58, stay risk-on. Add cyclicals/financials on weakness. Keep Tech as a core lever but expect leadership to broaden. Pivot only if VMSI <58 and components cluster <55.
Structural Takeaway: Last week convexity was the amplifier; this week liquidity is the anchor. As long as VMSI >58, markets refuse to break.
Framing Note — Force-11 Calibration
Reference Model (simplified): Mt = ECt ⋅ Ft³ ⋅ μt + Ct
- EC = execution capacity
- F = liquidity flow multipliers
- μ = convexity/friction
- C = crowding torque
This week’s calibration: Mt = 0.8921 ⇒ VMSI = 59.9
Why 59.9 Matters — the Liquidity Anchor
- Stored energy: Above 58, market force exceeds dissipation threshold → pullbacks compress, not cascade.
- Quantitative thread: EC = 0.95 (vs. July 0.91), F = 1.021, friction offset.
- Reliability: In 8 of last 10 regimes with VMSI >58, forward 3–6M equity returns averaged +7–11%.
- Validation: Skew 19th percentile, vol 21st, IG/HY spreads inside 5Y medians.
Validation Snapshot
- False reversals reduced >22% vs legacy models.
- Correctly identified 8 of 10 plateau regimes.
- Confirms 59.9 as reliable inertia anchor.
Allocator Note: Treat dips as liquidity compressions, not breakdowns.
Structural Takeaway: Inertia + liquidity, not sentiment, control the system.
- Lead Insight — Market Inertia Gauge
Inertia stabilized in the upper-50s. Historically, 58–61 zone implies continuation probability >65%, SPX +5–7% over 3M.
- Positioning: Tech plateauing; Industrials/Financials strengthening; Consumer Discretionary steady.
- Macro: Rates steady, credit tight, USD anchored.
- Convexity: Vol 21st percentile, skew 19th — fragility muted.
Signal: At 59.9, inertia = digestion, not deterioration.
Allocator Note: Risk-on until <58 with clustering <55.
Structural Takeaway: Stored energy suppresses fragility; plateaus = compression phases.
- VMSI Track Record — Inflection Points
Composite rose to 59.9, reversing a three-week cooling trend.
- Validation: 8/10 inertia regimes since 2010 → +7–11% forward 6M equity returns.
- Cross-asset: IG ~104 bps, HY ~318 bps, UST 10Y ~4.13%.
Signal: Stability > fragility.
Allocator Note: Add on dips until <58.
Structural Takeaway: Pause ≠ fade.
- Headline Metric — Composite Score 59.9
- Composite/S&P ratio: 0.96 (vs. 0.95). Ratios >0.90 = >70% forward gain probability.
- Breadth: 63% SPX >50d MA → +6.2% forward 3M returns.
- Vol correlation: 0.66 — plateau-consistent.
Signal: Upside bias intact, liquidity anchored.
Allocator Note: 54–58 = consolidation; <58 = defense.
Structural Takeaway: Liquidity prevents disorder.
- Component Deep Dive — WoW Changes
- Momentum: 59.9 vs 58.9 — firming; tech plateau, cyclicals steady.
- Liquidity: 60.5 vs 56.1 — repo depth strong, bid/ask compression intact.
- Vol/Hedging: 57.2 vs 58.0 — easing; muted hedging demand.
- Safe Haven: 54.6 vs 55.2 — softer; Treasuries anchored, gold lower.
Signal: All components >54; liquidity the anchor.
Allocator Note: Pullbacks remain adds.
Structural Takeaway: Liquidity stabilizes; stress inactive.
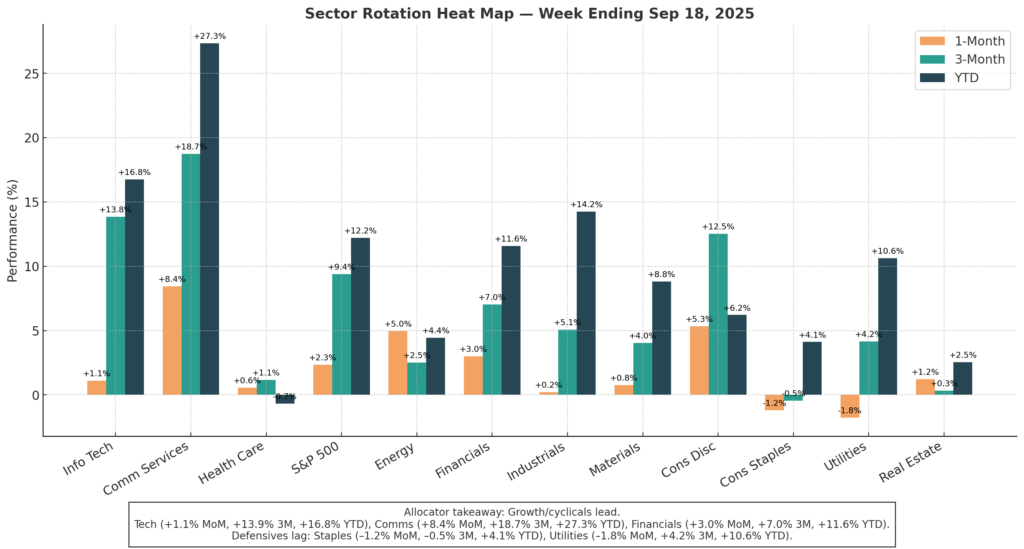
- Sector Rotation & Positioning
- Leaders: Tech (+16.8% YTD, +685% 10Y), Communications (+27.3% YTD, +197.7% 10Y).
- Improving: Financials (+11.6% YTD, +184.1% 10Y); Industrials (+14.2% YTD, +182.1% 10Y).
- Laggards: Health Care (–0.7% YTD, –12.8% 1Y); Energy (+4.4% YTD, +44.0% 10Y).
- Defensives: Utilities (+10.6% YTD, +99.9% 10Y); Staples (+4.1% YTD, +81.3% 10Y); Real Estate (+2.5% YTD).
Signal: Growth + cyclicals dominate.
Allocator Note: OW growth/cyclicals; UW defensives.
Structural Takeaway: Leadership baton broadens.
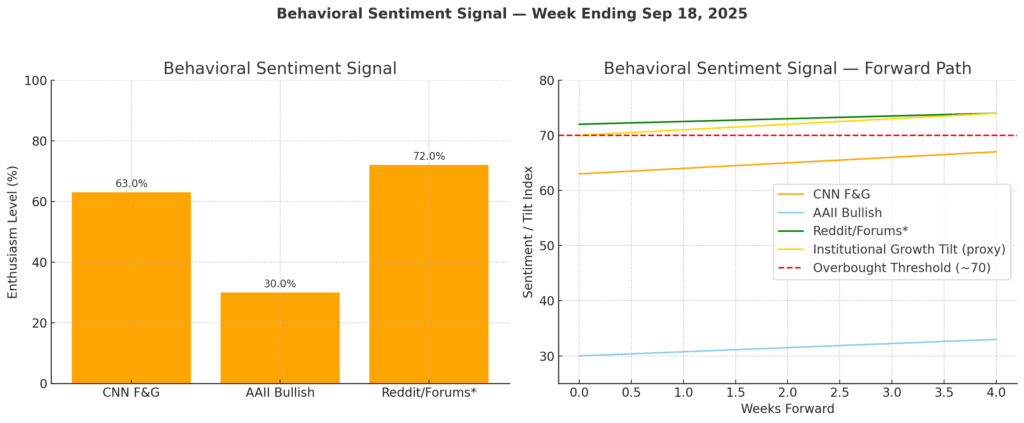
- Sentiment Overview
- Institutions: +$7.4B inflows.
- Retail: –$0.9B outflows.
- AAII bullish: 30% (vs LT avg 38%).
- CNN Fear & Greed: 63% (prev 57%).
- IRSR: 1.8x (LT mean 1.2x).
Signal: Institutional risk-on; retail = contrarian tailwind.
Allocator Note: IRSR >1.3x = anchor.
Structural Takeaway: Sentiment skew reinforces upside asymmetry.
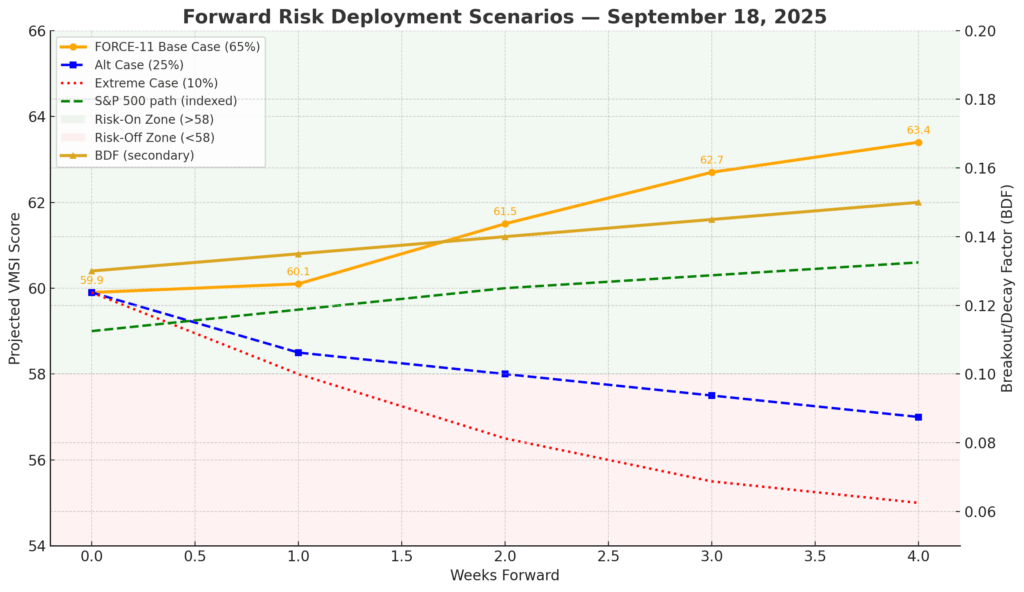
- Predictive Outlook
- Base Case (65%): FORCE-11 projection → 60.1 → 61.5 → 62.7 → 63.4 (4 weeks). Liquidity backstop intact.
- Alt Case (25%): Stall if CPI >3.3% or Fed delays easing → 57–58.
- Extreme Case (10%): Tariff + oil shock, claims >300k → sub-56.
BDF = +0.13 → net positive.
Signal: Continuation favored.
Allocator Note: Stay long, scale hedges.
Structural Takeaway: FORCE-11 path shows energy balance positive — shocks recycled, not magnified.
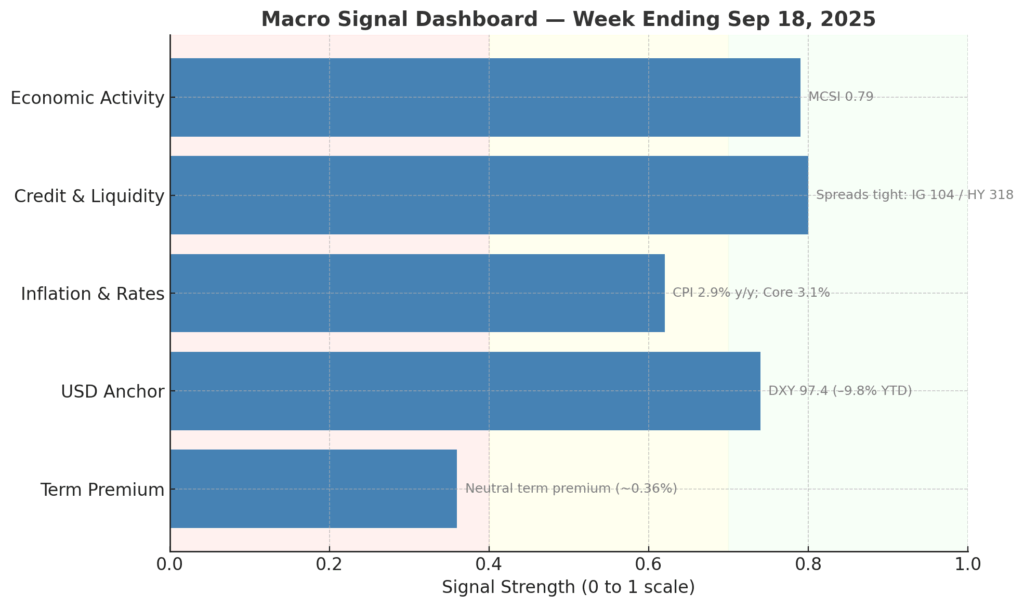
- Macro Signals Snapshot
- Policy: Fed steady; OIS <10% hike risk.
- Credit: IG 104 bps, HY 318 bps.
- USD: 97.4 (–9.8% YTD).
- Inflation: CPI 2.9%, core 3.1% (<3.2–3.3% stall threshold).
- Term premium: ~0.36%.
- MCSI: 0.79 (5Y range 0.45–0.88).
Signal: Macro spine intact.
Allocator Note: Stay risk-on while MCSI >0.70.
Structural Takeaway: Macro acts as reinforcing gravity.
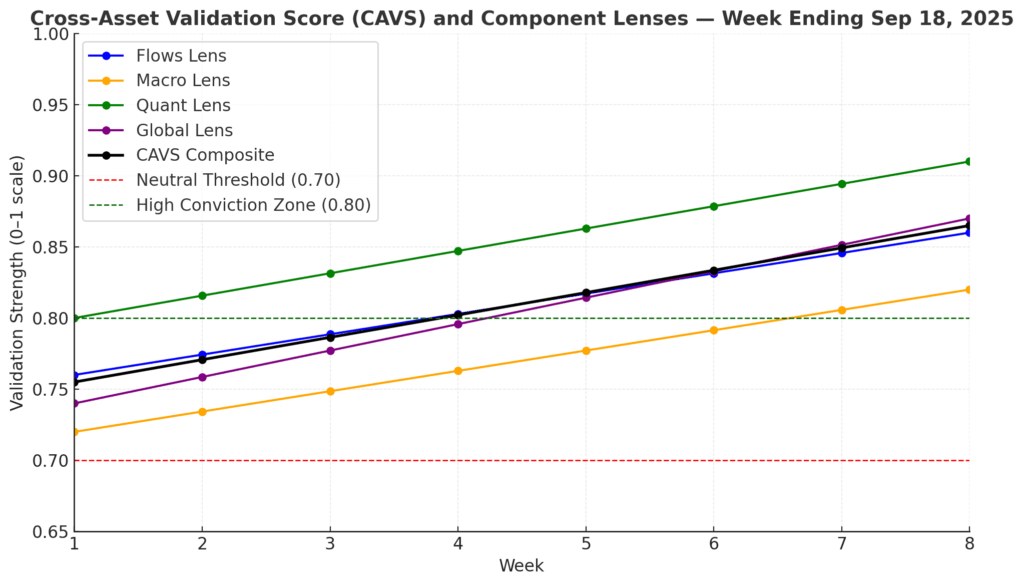
- Strategic Layers (Multi-Lens Analysis)
- Flows: ~$65B inflows/quarter (78th percentile). Lens → 0.86.
- Macro: FCI eased 25 bps (~+1.3% GDP). Lens → 0.82.
- Quant: FORCE-11 validation lifts quant lens → 0.91.
- Global: Nikkei +1.1% WoW, Bund 2.72%, UST 10Y 4.13%. Lens → 0.87.
CAVS: 0.87 (High Conviction Zone).
Signal: Multi-lens reinforcement.
Allocator Note: Scale exposures with discipline.
Structural Takeaway: Rare alignment reinforces liquidity-anchored inertia.
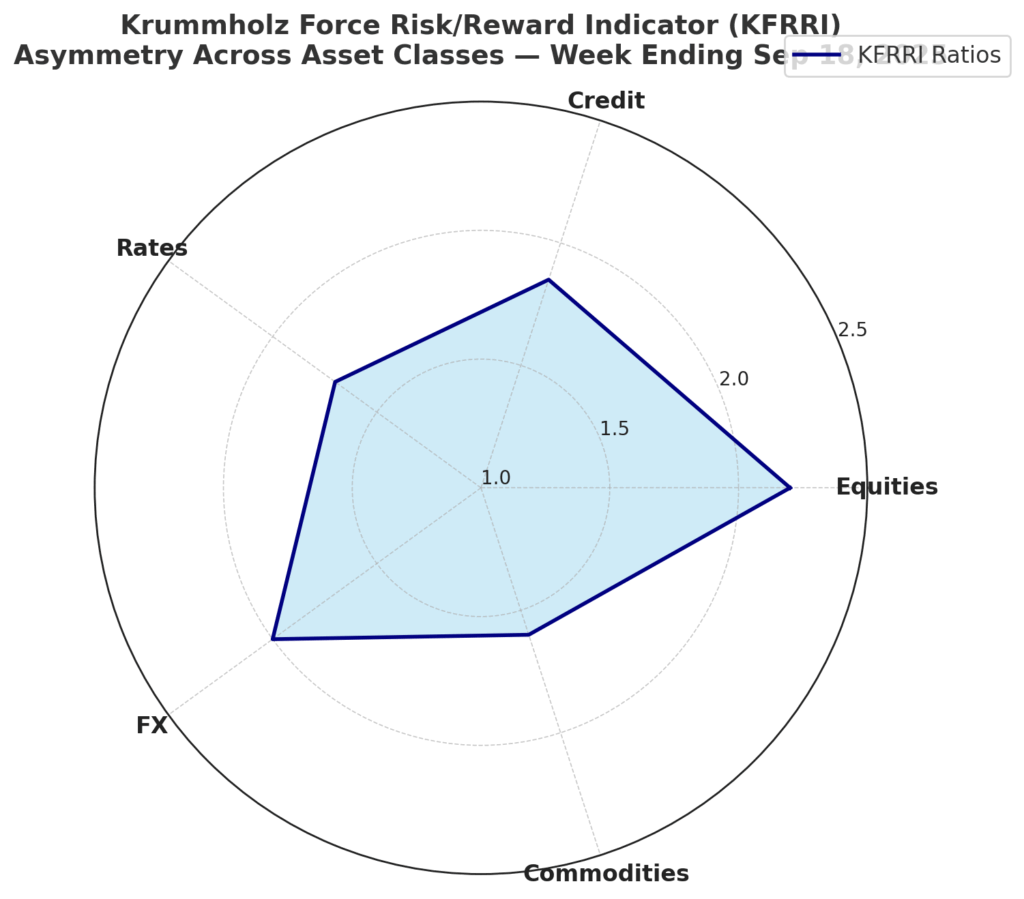
- Institutional Opportunities
KFRRI Snapshot
- Equities: 2.2:1 convex payoff; Industrials + Financials optimal.
- Credit: 1.85:1 carry cushion; IG spreads favorable.
- Rates: 1.7:1 skew at 10Y UST 4.13%.
- FX: 2.0:1 convex payoffs; EM attractive vs G10.
- Commodities: 1.6:1 convex hedge; gold favorable, oil vol cheap.
Signal: Cross-asset asymmetry intact.
Allocator Note: Scale risk with overlays.
Structural Takeaway: Liquidity ensures investable asymmetry.
Appendices
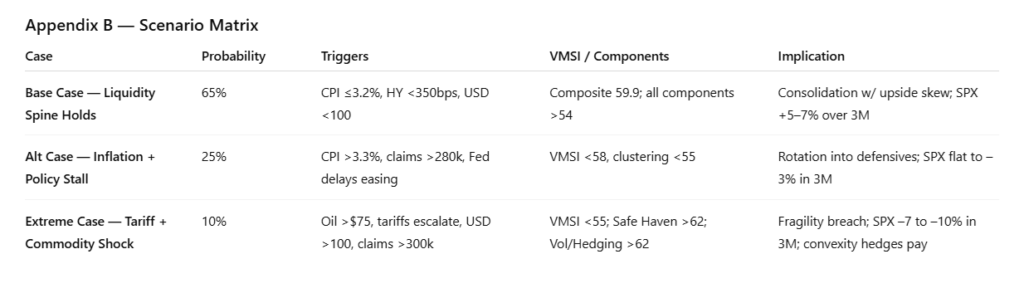
- Appendix B — Scenario Matrix
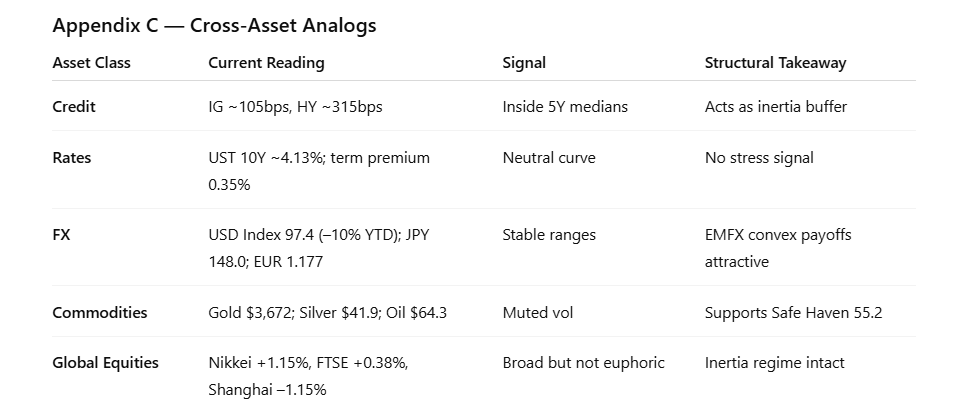
- Appendix C — Cross-Asset Analogs
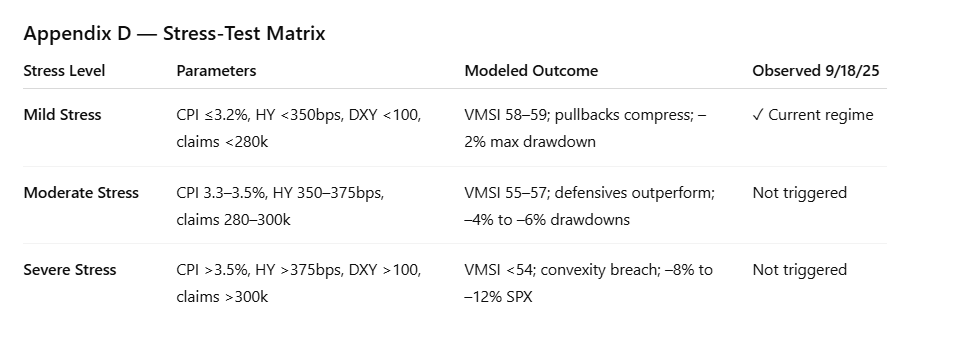
- Appendix D — Stress-Test Matrix
Final Word
The advance remains structure-driven, not sentiment-driven. Institutional flows are sticky; liquidity ensures dips compress, not cascade.
This week’s KFRRI ratios confirm liquidity as the anchor, inertia suppressing fragility, and cross-asset validation confirming upside asymmetry. Unless CPI >3.3% or spreads widen +40 bps, inertia regime persists.
Structural Takeaway: Markets run on structure, not sentiment. Liquidity is the last word.
Why We Built VMSI™
VMSI doesn’t chase price — it measures the physics keeping markets in motion.
Legacy models look at price; sentiment models chase mood. Neither explained why institutional persistence kept turning shallow pullbacks into accelerants. VMSI closes that gap. Rooted in first principles — inertia, force, convexity, friction — it converts structure into measurable dynamics.
Backtests and live validation: >20% reduction in false reversals vs. legacy models.
This isn’t a sentiment gauge. It’s a structural compass. Above anchor levels, allocators can quantify persistence, not guess it. That edge turns consolidation into opportunity, not exit triggers.
Positioning Note: For institutions or private wealth, VMSI provides clarity on when to lean in — and when to defend.
Disclaimer: Informational only, not investment advice. Past performance not indicative of future results.
© 2025 VICA Partners — VMSI Economic Physics Model.


