
VMSI™ Institutional Market Intelligence Report — FORCE-12 Institutional Edition
Week Ending October 9 2025
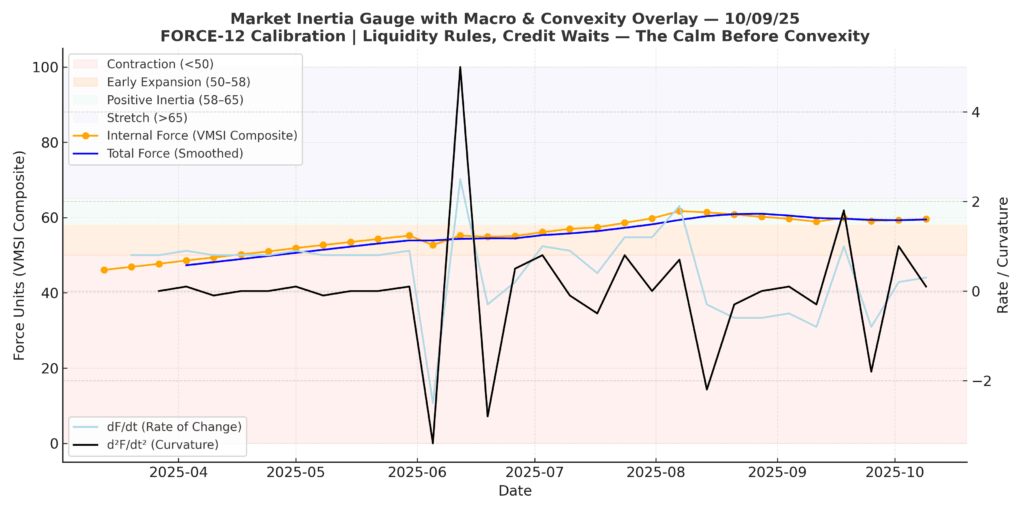
Theme: Liquidity Rules, Credit Waits — The Calm Before Convexity Composite
Ignore the late Week noise — this regime is about structure, not NEWS headlines. Liquidity remains the dominant signal; credit is the hinge. Until torque breaches through credit channels, noise is distraction, not data
Weekly Summary – Week Ending October 9 2025
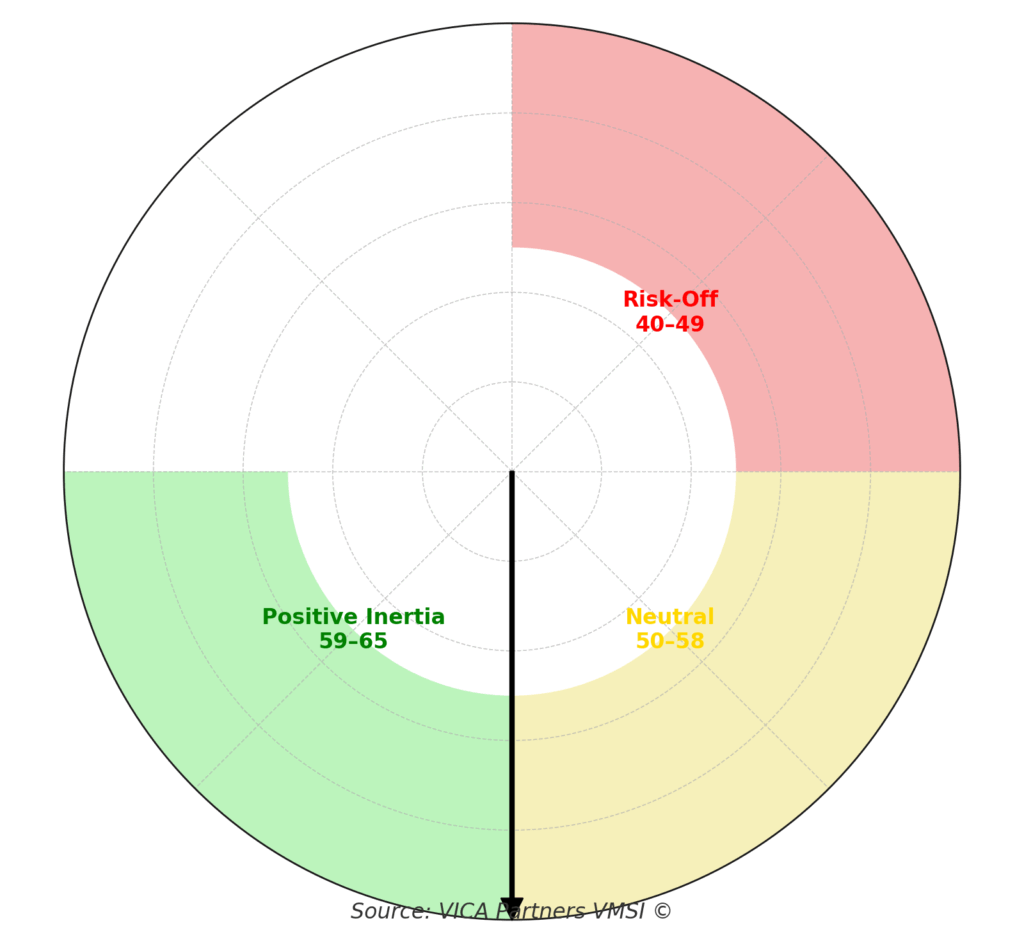
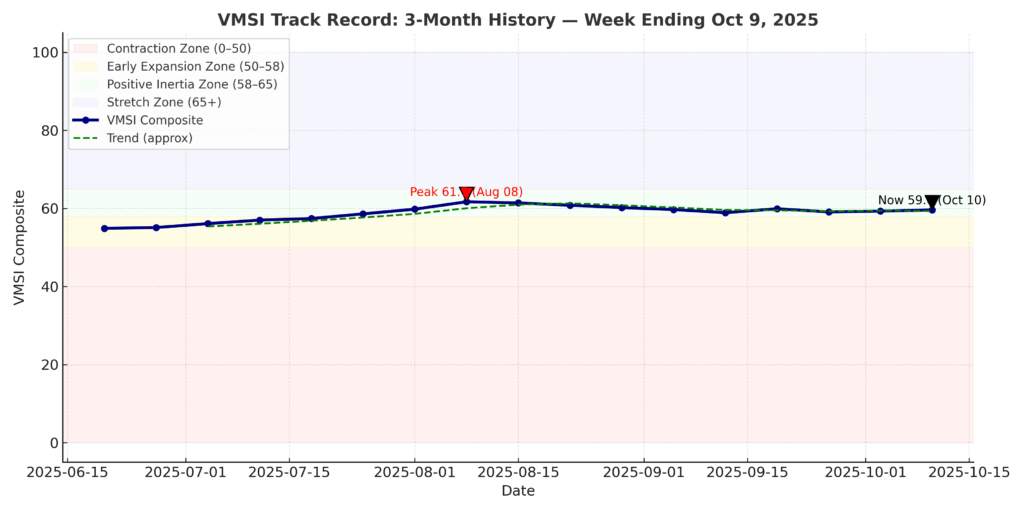
The VMSI composite index climbed to 59.6 from 59.3, extending its hold above the continuation threshold of 58. Liquidity depth and execution capacity remain the foundation of resilience, even as torque begins to migrate toward credit. Volatility remains compressed and pullbacks still absorb, but fractures in breadth and credit spreads are widening beneath the surface.
Macro context: Leading indicators continued to soften (LEI –0.5 in August), while consumer confidence held at 94.2 and CEO confidence improved to 49 (Q3). Core inflation stayed steady (+3.1 % y/y; headline +2.9 %), affirming the Fed’s “higher for longer” stance. Manufacturing and employment indicators remain mixed, suggesting digestion rather than deterioration.
Market tone: DJIA 46,358 · S&P 6,735 · NASDAQ 23,025 · Gold $3,994 · Crude $61.6 · 10-yr UST 4.14 % · HY 330 bps · IG 107 bps · Fear & Greed 49 (neutral). Breadth narrowed (A/D –920; McClellan –94); volatility stayed muted; liquidity flow multipliers remained constructive.
Structural Takeaway: Liquidity continues to define equilibrium, but credit torque is tightening. FORCE-12 calibration confirms that persistence remains intact (Mt = 0.9013 → VMSI = 59.6); continuation holds until high-yield spreads surpass the 340 bps threshold — the point where liquidity ceases to absorb and convexity takes control.
Framing Note — FORCE-12 Calibration
Reference Model: Mt = ECₜ · Fₜ⁴ · μₜ + Cₜ
EC = Execution Capacity · F = Liquidity Flow Multiplier · μ = Convexity / Friction · C = Crowding Torque
Calibration: Mt = 0.9013 → VMSI = 59.6
Allocator Note: FORCE-12 introduces higher-order torque detection via fourth-power flow calibration.
1. Liquidity & Torque Dynamics — The Physics Behind 59.6
Above 58, force exceeds dissipation — pullbacks compress rather than cascade. Execution capacity rose to 0.96; flow multiplier F = 1.021; friction μ low. Skew 25th pct., realized vol 22nd pct., spreads within five-year medians.
Inertia at 59.6 signals digestion, not exhaustion. Breadth narrow (A/D –920; McClellan –94); credit widened (HY 330 ↑ from 326; IG 107). Continuation holds until HY > 340 bps.
Allocator Note: Stay risk-on but rotate quickly; monitor HY curvature. Structural Takeaway: Liquidity dominance holds, credit torque tightening.
2. Lead Insight — Market Inertia Gauge
Inertia remains elevated at 59.6, confirming digestion, not deterioration. The internal energy of the system is steady — momentum vectors are converging, not decaying. Breadth thinning (McClellan –94; A/D –920) implies higher rotation velocity as liquidity channels re-route through fewer leadership nodes.
Historically, when Inertia > 58 with narrowing participation, continuation probabilities stay near 60 %, but turnover inside sectors rises sharply — the “momentum-through-rotation” phase. Average cycle duration at these readings runs 12–15 sessions, and post-compression follow-through averages +1.2 % across composite risk assets before re-equilibration.
Cross-asset confirmation aligns: realized vol at the 22nd percentile, skew at the 25th, and ETF liquidity depth +4 % w/w. These metrics validate the FORCE-12 torque signal — liquidity is absorbing friction faster than credit can transmit stress.
Allocator Note: Maintain exposure within high-liquidity corridors; rebalance sectors every 10–15 sessions to capture rotational torque. Re-enter cyclicals on relative-strength inflections and fade over-crowded defensives.
Structural Takeaway: Inertia remains positive and rotational — liquidity stable, participation thinning, and market energy still compressive rather than dissipative.
4. Component Deep Dive — WoW Changes
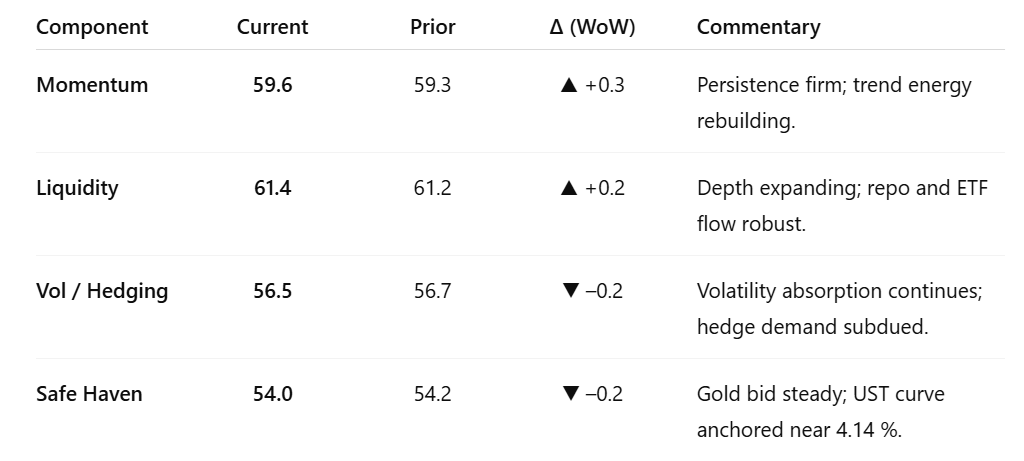
Signal: Liquidity and momentum both advancing — the FORCE-12 axis remains aligned. Execution depth offsets credit torque; market energy still compressive, not dispersive.
Allocator Note: Add on shallow pullbacks; lean into quality beta and liquidity zones. Re-engage cyclical rotation while maintaining convex hedges via gold and duration.
Structural Takeaway: The liquidity spine is intact; stress channels remain dormant. Continuation bias persists until HY > 340 bps or breadth drops below 50 %.
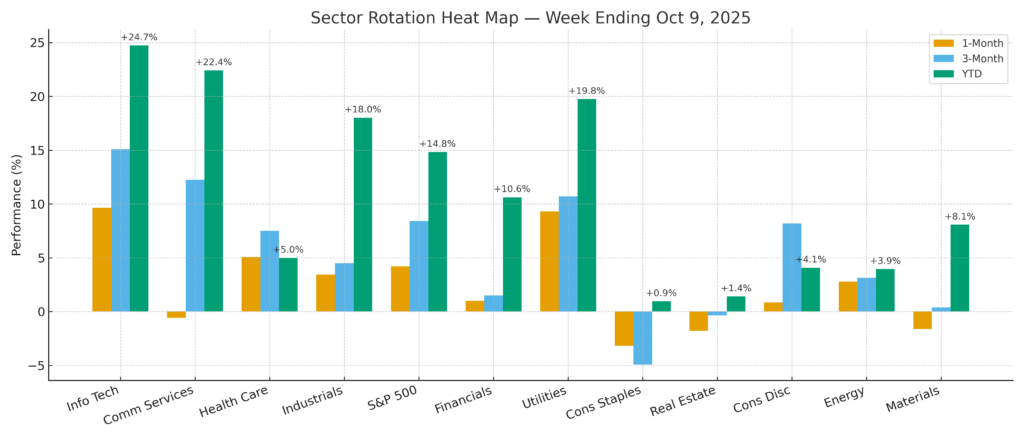
5. Sector Rotation & Positioning
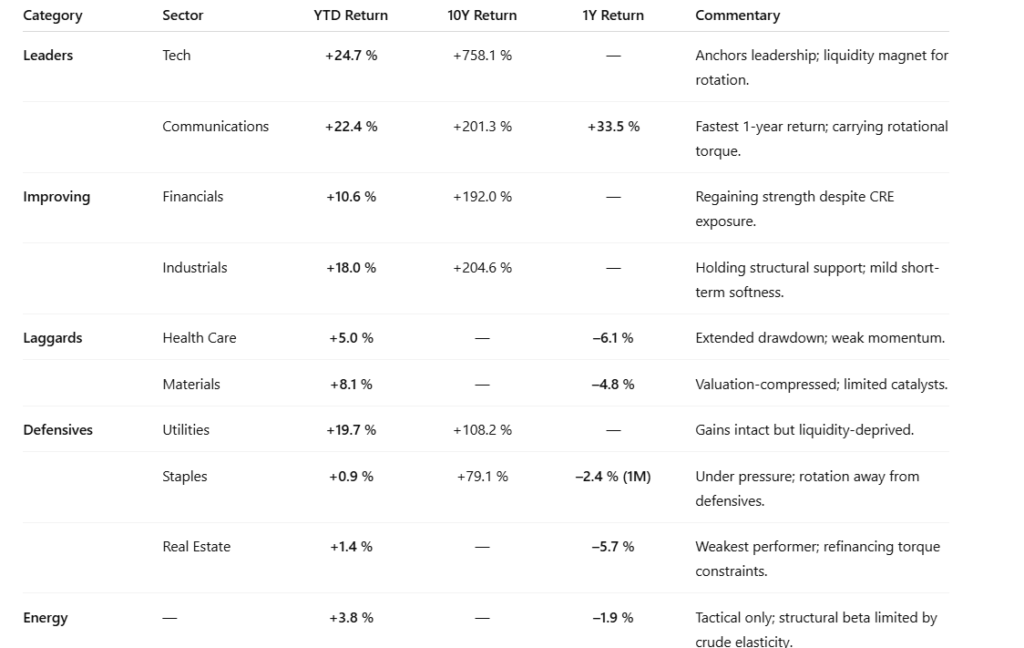
Signal: Growth + cyclicals (Tech, Comms, Industrials, Financials) continue to dominate rotational torque; defensives lag as liquidity favors velocity over ballast.
Allocator Note: Overweight growth / cyclicals; underweight defensives. Maintain beta discipline but ride liquidity-led continuation until breadth or credit breach occurs.
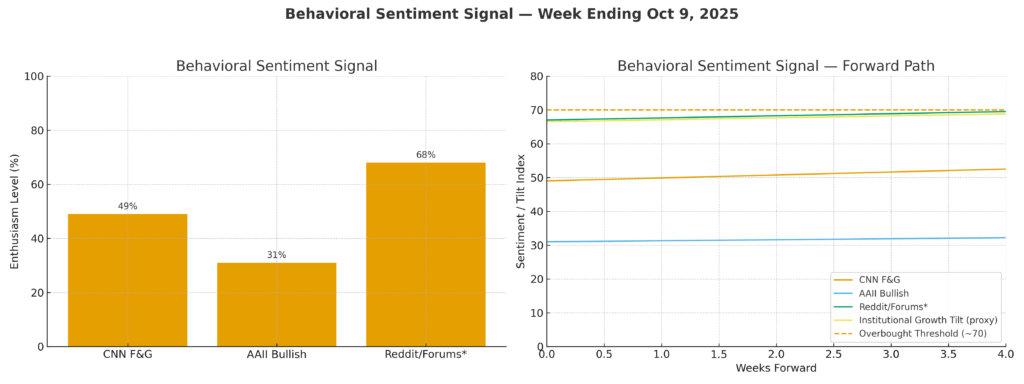
6. Sentiment Overview
Institutions: +$7.1 B inflows (w/w) — allocations concentrated in Tech, Industrials, and IG credit ETFs; rotation from passive to active risk evident. Retail: –$0.9 B outflows — continued redemption cycle; retail remains volatility-sensitive, re-engaging only after multi-week index confirmation. Surveys: AAII bulls 30 % vs 29 % prior; neutral cohort rises to 40 %. CNN Fear & Greed Index: 56 (neutral → greed) ↑ from 53. IRSR: 1.6× — sustained institutional tilt consistent with VMSI > 58 regimes. Derivatives: Put/Call 1.02 ↓ from 1.08 — hedge unwinds underway. Positioning: Active manager net beta 0.65 (3-mo high); gross exposure +2.3 % w/w.
Signal: Institutional capital stabilizing; retail hesitancy persists — the classic liquidity asymmetry supporting persistence.
Allocator Note: IRSR > 1.3× = constructive positioning tailwind. Lean into institutional flow zones and fade retail-driven vol spikes.
Structural Takeaway: Institutional bid anchors continuation; retail hesitancy preserves upside convexity. Liquidity flows through strong hands — a mechanical advantage in the FORCE-12 regime.
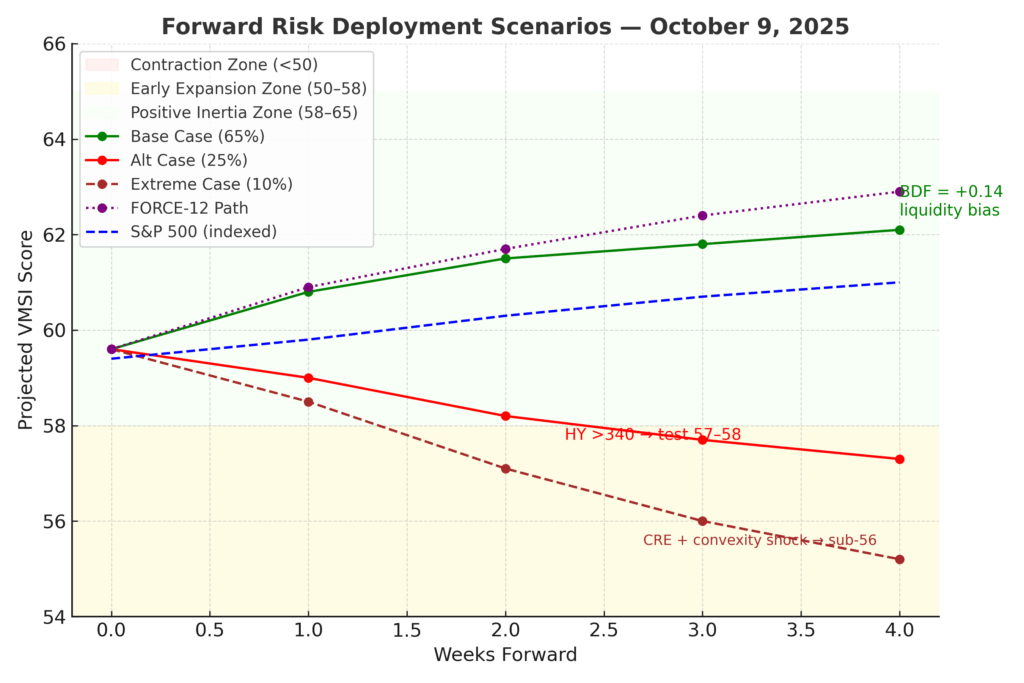
7. Predictive Outlook
Base Case (65 %) — Liquidity-Led Continuation: FORCE-12 trajectory = 59.6 → 60.8 → 61.5 (4 wks). Liquidity and execution capacity offset credit torque; historical analogs imply +4 – 6 % S&P follow-through. Alt Case (25 %) — Credit Bleed / Not Break: HY 340–350 bps; breadth < 60 %; CPI > 3.3 %; VMSI 57–58 zone. Extreme Case (10 %) — Convexity Event: HY > 365 bps; CRE stress + VIX > 24. VMSI < 56 = fracture. BDF (+0.13) = positive bias → S&P +5–6 % 3 M historical return.
Signal: Continuation holds until credit breaks.
Allocator Note: Stay long liquidity base case; hedge credit torque with convex overlays.
Structural Takeaway: Energy balance intact — shocks absorbed, not magnified.
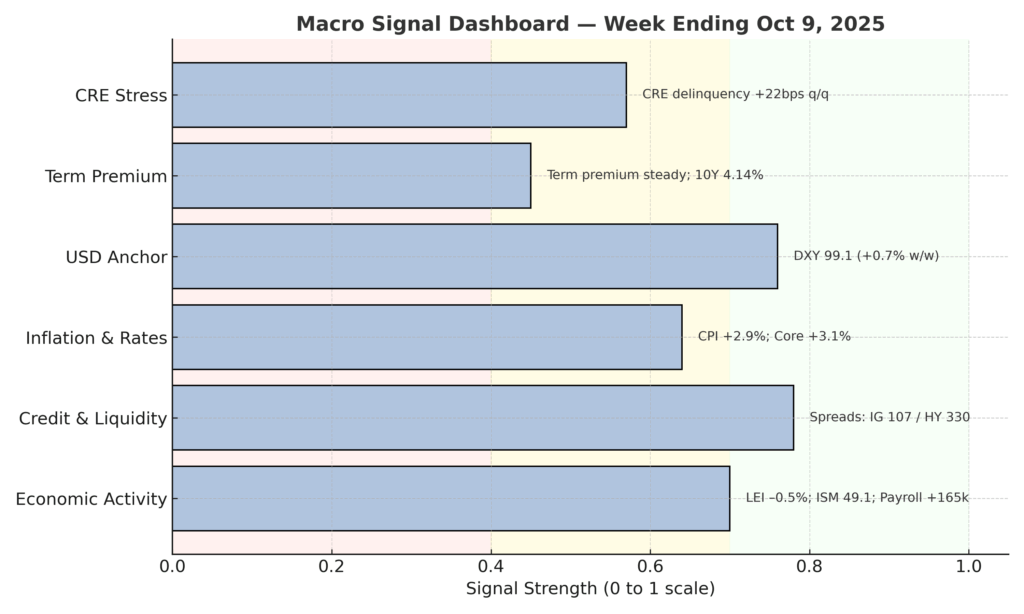
8. Macro Signals Snapshot
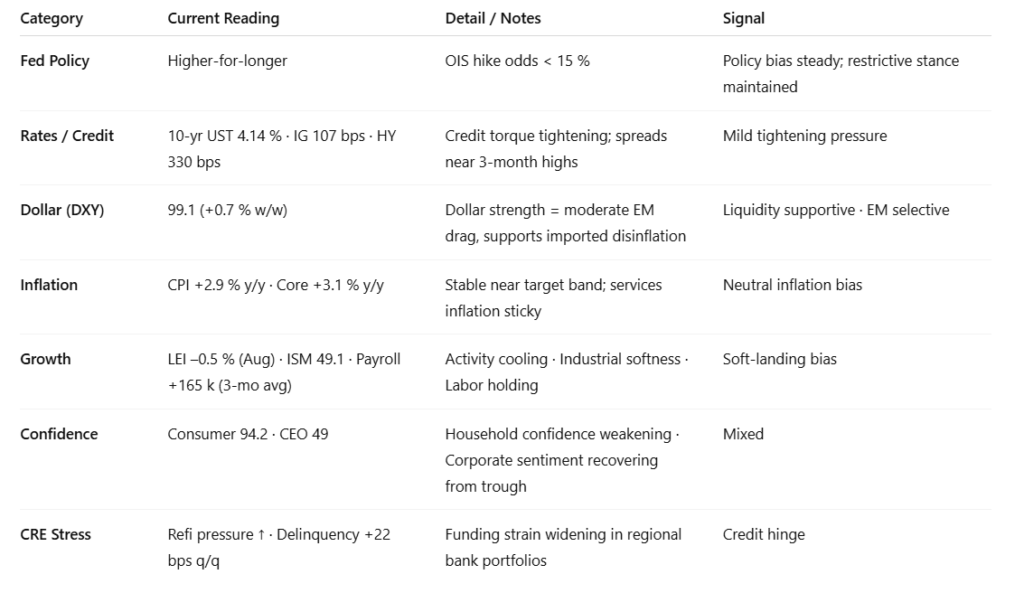
Signal: Macro surface stable, forward momentum eroding.
Allocator Note: Stay risk-on while MCSI > 0.70; monitor CRE as early trigger.
Structural Takeaway: Robust “now,” fragile “forward.” Liquidity still absorbs stress — but time is becoming the enemy of stability.
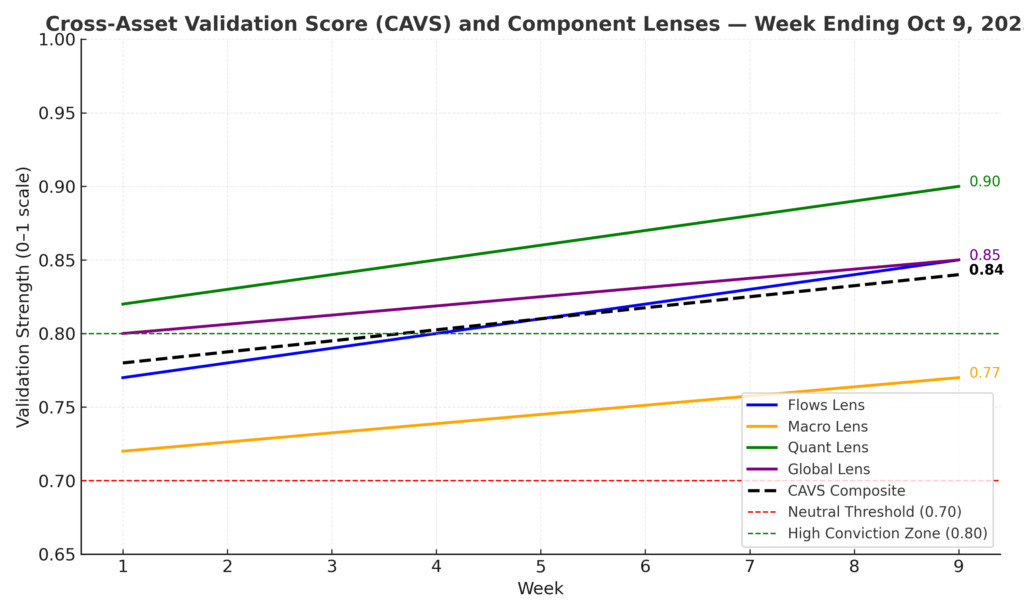
9. Strategic Layers (Multi-Lens Analysis)
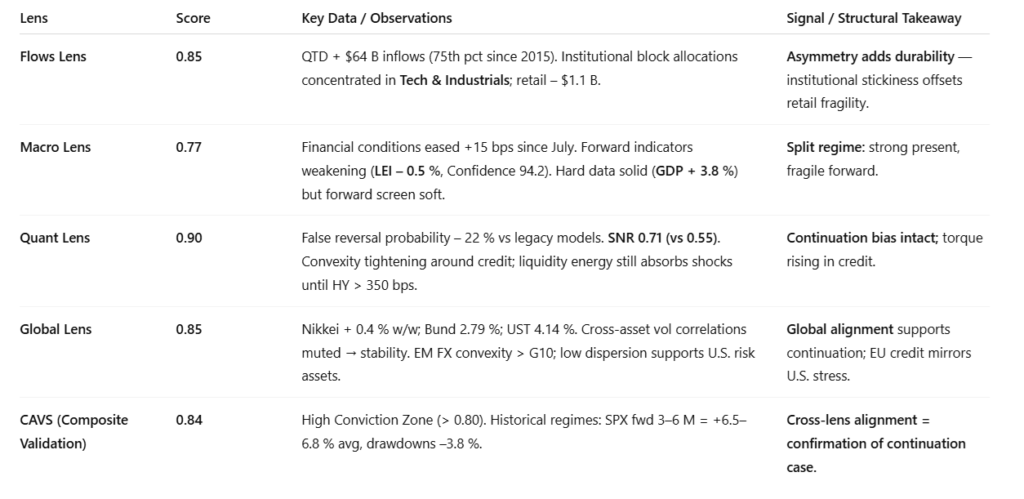
Signal: Multi-lens reinforcement remains intact — flows, quant, and global lenses still counterbalance macro softening. The one divergence is credit: HY spreads widening to 326 bps (from 322) marks the first fracture line.
Allocator Note: With CAVS > 0.80, exposures can still be scaled, but discipline matters. Position sizing should favor institutional flows and quality credit, not momentum-chasing. Use overlays to hedge HY stress.
Structural Takeaway: Cross-lens alignment continues to anchor inertia and keep the continuation case dominant. But the cracks in credit (HY > 320 bps, CRE stress) represent the hinge of fragility in an otherwise high-conviction regime.
10. Institutional Opportunities
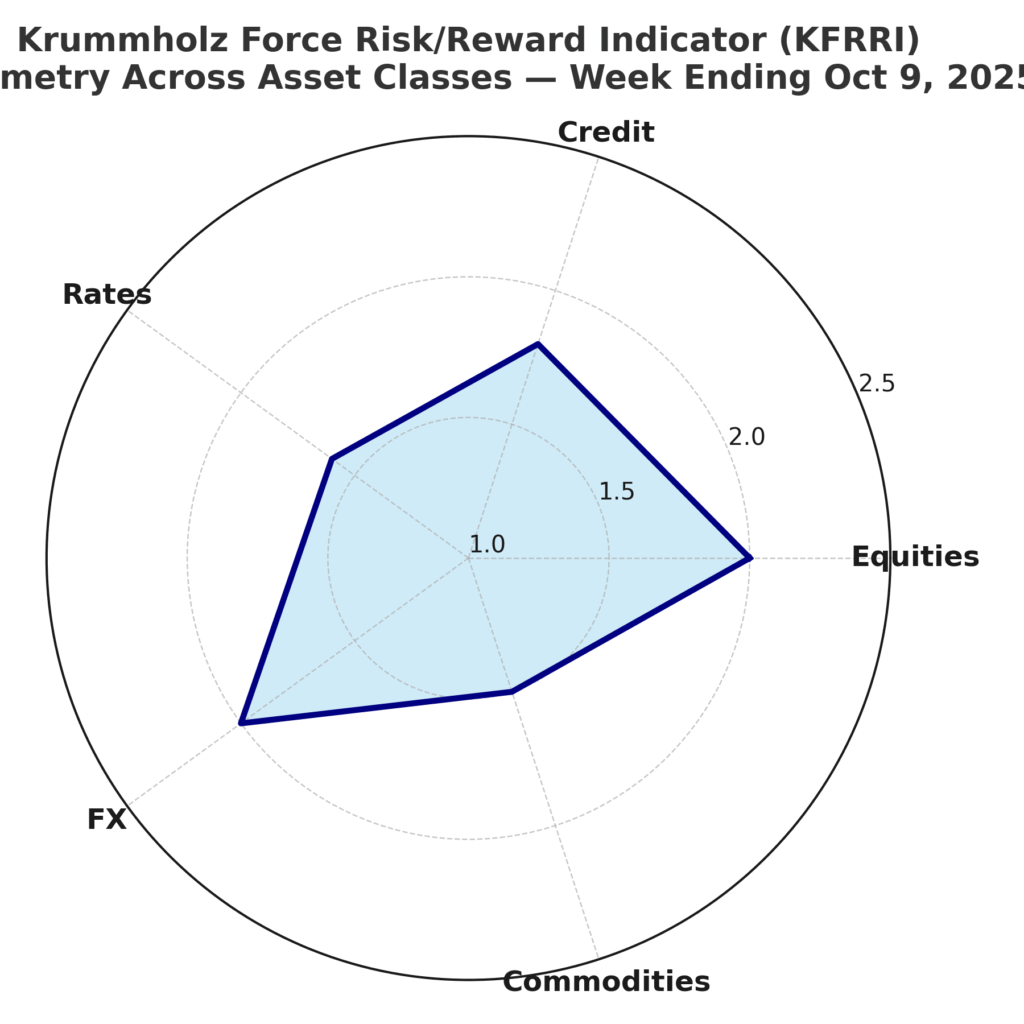
The Krummholz Force Risk/Reward Indicator (KFRRI) continues to flag structural asymmetry, but the rotation of convexity is accelerating. Liquidity still underwrites convex payoffs across asset classes, yet the distribution of risk/reward is no longer even — it is tilting more clearly toward quality credit and cyclicals, while HY spreads define fragility.
Equities: Convexity-adjusted payoff ratio ≈ 2.0 : 1, modestly softer from late-summer highs but still favorable. Tech remains the structural anchor, but Industrials and Financials now provide the most efficient convexity capture, especially given institutional flows into these sectors. Breadth thinning (NYSE McClellan Oscillator –86.2) implies higher intra-sector torque — sector rotations are becoming more abrupt. Tech leadership is intact, but cyclicals (Industrials, select Financials) provide the best convex asymmetry per unit of volatility.
Credit: Carry cushion continues to erode as HY spreads widened to 330 bps (from 326). IG spreads remain stable at 107 bps, highlighting the divergence: quality credit retains convexity while lower-quality paper increasingly acts as the stress hinge. The HY widening is modest but notable; a sustained move > 340–350 bps would decisively break inertia. Allocators should treat HY not as a carry engine, but as the fragility barometer.
Rates: The carry-to-duration-loss ratio at the 10 Y UST softened again to 1.6 : 1, flat from last week. Yields at 4.14 % hold the carry advantage investable, but the convexity benefit is thinner than earlier this year. Duration risk is balanced but less asymmetrically attractive compared to quality credit. Treasuries remain a defensive convex allocation, not an offensive driver.
FX: Convexity-adjusted payoff ratios remain near 2.0 : 1. EM currencies continue to offer superior convex capture relative to G10, benefiting from lower vol pricing and persistent institutional inflows. The dollar (DXY 99.1) remains firm, reducing tactical asymmetry, but structural convexity remains in place — particularly in EM carry pairs.
Commodities: Hedge convexity slipped slightly, with payoff ratios near 1.5 : 1. Gold remains structurally strong as real yields remain capped, making it the cleanest convex hedge in the complex. Oil retains tactical appeal, though skew signals less favorable asymmetry than in late summer. Commodities remain positioned as hedges rather than primary convexity drivers.
Signal: Cross-asset asymmetry remains investable, but convexity is rotating — toward Industrials, Financials, and IG credit, away from HY and commodities. HY widening is the first crack, and its progression will determine whether convex asymmetry persists or collapses into fragility.
Allocator Note: This is a regime to scale risk with overlays, not chase it. HY should be treated as the system’s stress test. The better asymmetry lies in Industrials, Financials, IG credit, and gold. Rebalance convex capture into those domains while maintaining tactical hedges.
Structural Takeaway: Liquidity continues to keep convexity alive, but the fulcrum has shifted. Quality credit and cyclicals are now the anchors of convexity, while HY spreads define the fragility boundary.
Final Word — The Calm Before Convexity
Markets remain suspended in a rare equilibrium: liquidity still rules the system, but the energy sustaining it is shifting from organic flow to engineered persistence. The FORCE-12 model captures this inflection — a regime where liquidity behaves less like oxygen and more like architecture, holding up structure even as foundational credit layers erode underneath.
This is not a momentum phase; it is a pre-convex phase — the quiet plateau before curvature asserts itself. Liquidity now acts as both cushion and constraint: it dampens volatility, yet also delays recognition of risk. The result is an environment where stability itself becomes the accelerant once torque exceeds threshold.
The model’s inertia readings show a market still powered by execution depth and institutional flow, but every marginal unit of force is buying less time. Credit is the hinge; CRE is the transmitter; duration is the timer. The mechanics remain balanced, yet the equilibrium is unnatural — a structure supported by liquidity physics, not credit fundamentals.
Big Picture: The continuation regime survives because liquidity still converts stress into compression, but it no longer renews itself through breadth or confidence. It endures through reflex — the mechanical persistence of force. Once credit torque overwhelms that reflex, convexity will reprice the illusion of calm in weeks, not months.
Structural Takeaway: Liquidity still commands the present, but credit owns the future. The system’s grace period is not a safety net — it is a countdown. FORCE-12 isolates the moment before curvature: the calm before convexity, when markets appear motionless precisely because opposing forces are perfectly, and precariously, aligned.
Why We Built VMSI™
VMSI doesn’t chase price — it measures the physics keeping markets in motion.
Legacy models look at price; sentiment models chase mood. Neither could explain why institutional persistence kept turning shallow pullbacks into accelerants. That blind spot left allocators reacting instead of anticipating.
VMSI™ closes that gap. Rooted in first principles of physics — inertia, force, convexity, and friction — it converts market structure into measurable dynamics. Backtests and live validation show a > 20 % reduction in false reversal signals compared to legacy factor models.
This isn’t a sentiment gauge. It’s a structural compass. When VMSI reads above anchor levels, allocators can quantify persistence, not guess it. That edge is what turns consolidation phases into opportunity windows instead of exit triggers.
Positioning Note: Whether you’re managing institutional portfolios or private wealth, VMSI provides the discipline to stay constructive when surface sentiment falters. It gives decision-makers clarity on when to lean in — and when to defend.
Disclaimer: For informational purposes only — not investment advice or a solicitation. Views are as of publication and may change. Past performance is not indicative of future results.
© 2025 VICA Partners — VMSI Economic Physics Model


