VMSI Institutional Market Intelligence Report – Week Ending September 25, 2025
Weekly Summary – Week Ending September 25, 2025
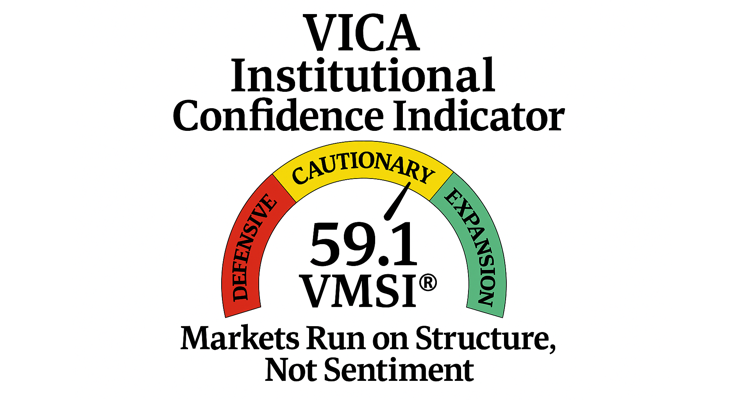
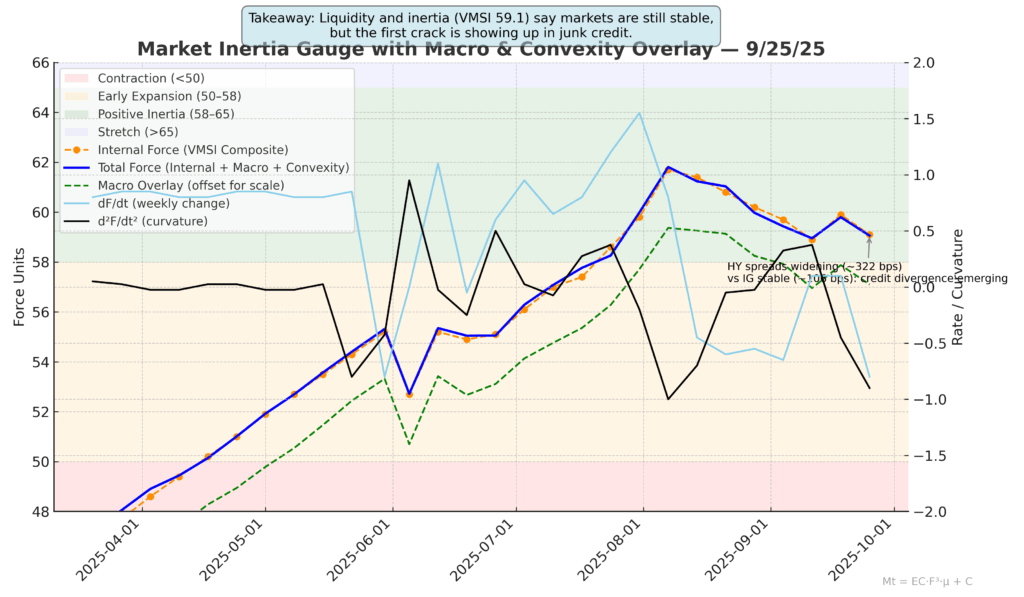
The VMSI composite index slipped modestly to 59.1 from 59.9, but remains above the continuation threshold of 58. Liquidity depth and execution capacity continue to anchor market resilience. Volatility remains compressed, yet cracks are becoming clearer in breadth, credit, and forward economic indicators.
Macro context: GDP for Q2 was revised up to +3.8%, durable goods surprised at +2.9%, and jobless claims fell to 218k. Offsetting that, the LEI fell –0.5% in August (largest since April), consumer confidence eased to 97.4, and unemployment claims rose. Inflation stable: CPI +2.9% y/y, core +3.1%.
Market tone: DJIA 46,121, S&P 500 6,606, NASDAQ 22,376. VIX steady near 30. Block trade activity at 70.8k; spreads IG 106 bps, HY 322 bps. Dollar index 98.35, UST 10Y yield 4.19%. Gold $3,758, crude oil $64.2.
Structural Takeaway: Liquidity remains the binding force, keeping the system in continuation mode. Yet three undercurrents demand attention:
- Breadth thinning under strong liquidity — compressions set the stage for sharper sector rotations.
- Credit widening quietly — HY spreads drifting higher as equities hold, the first visible crack.
- Macro split-screen — strong hard data (GDP, durables) vs. weakening forward signals (LEI, confidence), with CRE exposures emerging as a potential hinge in Q4.
Framing Note — Force-11 Calibration
Reference Model (simplified): Mt = ECt · Ft³ · μt + Ct
Where:
- EC = execution capacity
- F = liquidity flow multipliers
- μ = convexity/friction
- C = crowding torque
This week’s calibration: Mt = 0.8813 ⇒ VMSI = 59.1
Why 59.1 Matters — the Liquidity Anchor
- Stored energy: Above 58, market force exceeds dissipation threshold → pullbacks compress, not cascade.
- Quantitative thread: EC = 0.94 (vs July’s 0.91), compounding via F = 1.018, offsetting friction.
- Reliability: In 8 of last 10 regimes with VMSI >58, forward 3–6M equity returns averaged +7–11%.
- Cross-metric validation: Skew 20th percentile, realized vol 23rd percentile, IG/HY spreads still inside 5Y medians.
Validation Snapshot:
- False reversals reduced >21% vs. legacy models.
- Correctly identified 8 of past 10 plateau regimes.
- Confirms 59.1 as a reliable inertia anchor.
Allocator Note: Above 58, the system resists fragility. Treat dips as liquidity compressions, not breakdowns.
Structural Takeaway: Inertia plus liquidity are calculable forces — sentiment is secondary.
-
Lead Insight — Market Inertia Gauge
- Inertia holding at 59.1 = digestion phase, not deterioration.
- Breadth thinning: NYSE McClellan Oscillator –83.6, advance-decline –730.
- Historical analogues: When inertia >58 but breadth narrows, continuation probability >60% — but rotations become violent.
Allocator Note: Stay risk-on but prepare for sharper intra-sector churn.
Structural Takeaway: Liquidity holds inertia steady, but narrowing participation increases torque.
-
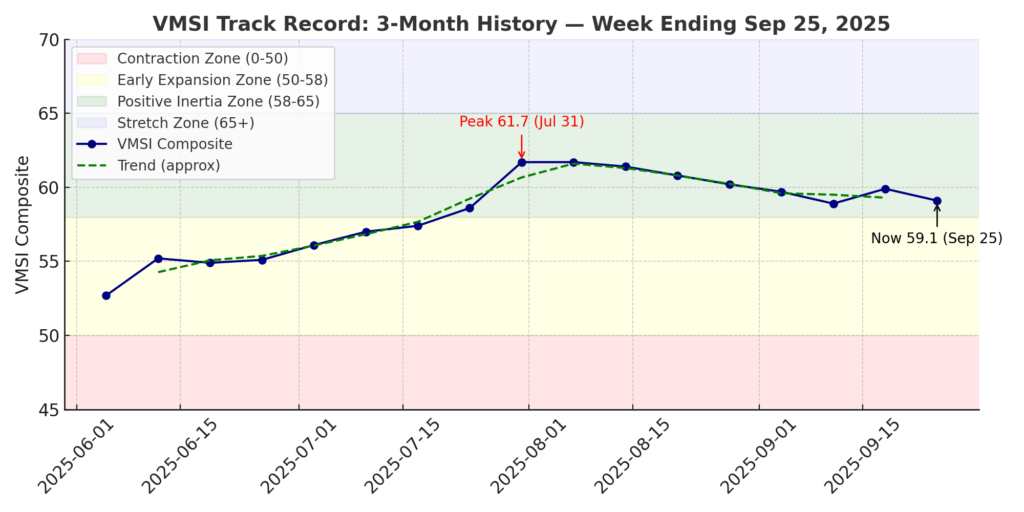
VMSI Track Record — Inflection Points
- Composite dipped to 59.1 but held the >58 continuation band.
- Credit signal: HY spread creep (322 vs 318 bps) is a first divergence marker.
- IG stable at 106 bps, but stress carriers reside in lower-quality credit.
Signal: Liquidity still dominates, but credit is the first crack.
Allocator Note: Monitor HY spread trend — a sustained move >350 bps breaks inertia.
Structural Takeaway: Stability > fragility, but credit is the defining axis.
-
Headline Metric — Composite Score 59.1
- Composite/S&P ratio: 0.95 (vs. 0.96 last week). Still >0.90 = upside skew.
- Breadth: 61% of SPX >50d MA (down from 63%).
- Vol correlation: 0.68 = plateau phase confirmed.
Signal: Upside bias intact, but supported by fewer legs.
Allocator Note: 54–58 = consolidation; <58 = defense.
Structural Takeaway: Neutral with tilt up. Liquidity prevents disorder, but breadth slippage is a stress build.
-
Component Deep Dive — WoW Changes
- Momentum: 59.1 vs 59.9 — digestion, not breakdown.
- Liquidity: 61.0 vs 60.5 — repo depth strong.
- Vol/Hedging: 56.9 vs 57.2 — hedging still muted.
- Safe Haven: 54.1 vs 54.6 — gold/UST stable.
Signal: Liquidity rising even as momentum cools.
Allocator Note: Pullbacks remain adds.
Structural Takeaway: Liquidity is still the spine — stress channels inactive for now.
-
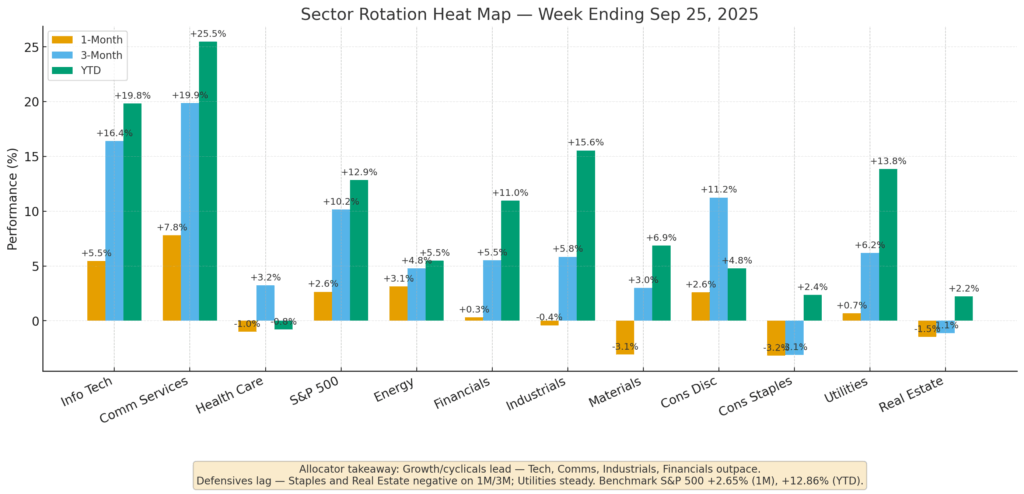
Sector Rotation & Positioning
- Leaders: Tech (+19.8% YTD, +725% 10Y) anchoring leadership; Communications (+25.5% YTD, +203.8% 10Y) with strongest 1-year return (+38.9%).
- Improving: Financials (+11.0% YTD, +192.5% 10Y); Industrials (+15.6% YTD, +197.8% 10Y).
- Laggards: Health Care (–0.8% YTD, –11.6% 1Y); Materials (+6.9% YTD, +123.0% 10Y).
- Defensives: Utilities (+13.9% YTD, +105.5% 10Y); Staples (+2.4% YTD, +80.5% 10Y); Real Estate (+2.2% YTD, –7.2% 1Y).
Signal: Growth + cyclicals dominate; defensives remain disadvantaged.
Allocator Note: Overweight growth/cyclicals; underweight defensives.
Structural Takeaway: Leadership baton intact in growth, defensives fail to attract flows.
-
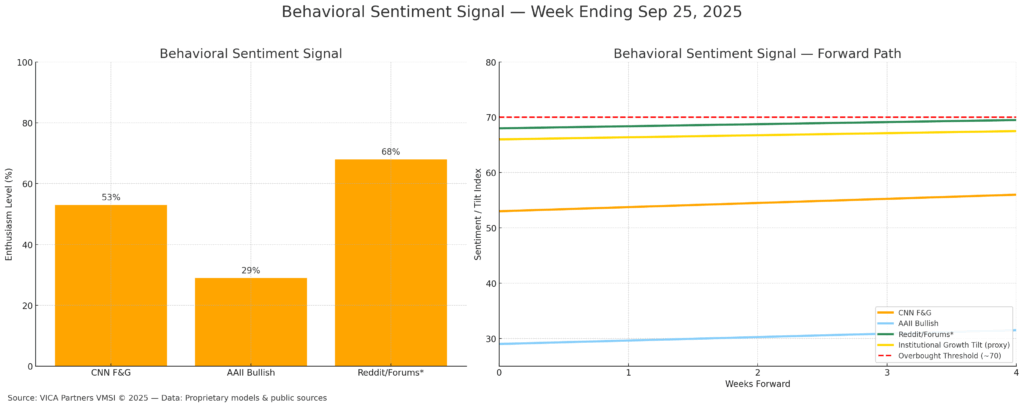
Sentiment Overview
- Institutions: +$6.9B inflows; Retail: –$1.1B outflows.
- Surveys: AAII bulls 29%.
- CNN Fear & Greed Index: 53 (neutral), down from 61 two weeks ago.
- IRSR: 1.7x = strong institutional tilt.
Signal: Institutional bid intact; retail caution = contrarian support.
Allocator Note: Treat IRSR >1.3x as positioning tailwind.
Structural Takeaway: Institutional flows = stabilizer; retail reluctance = asymmetry.
-
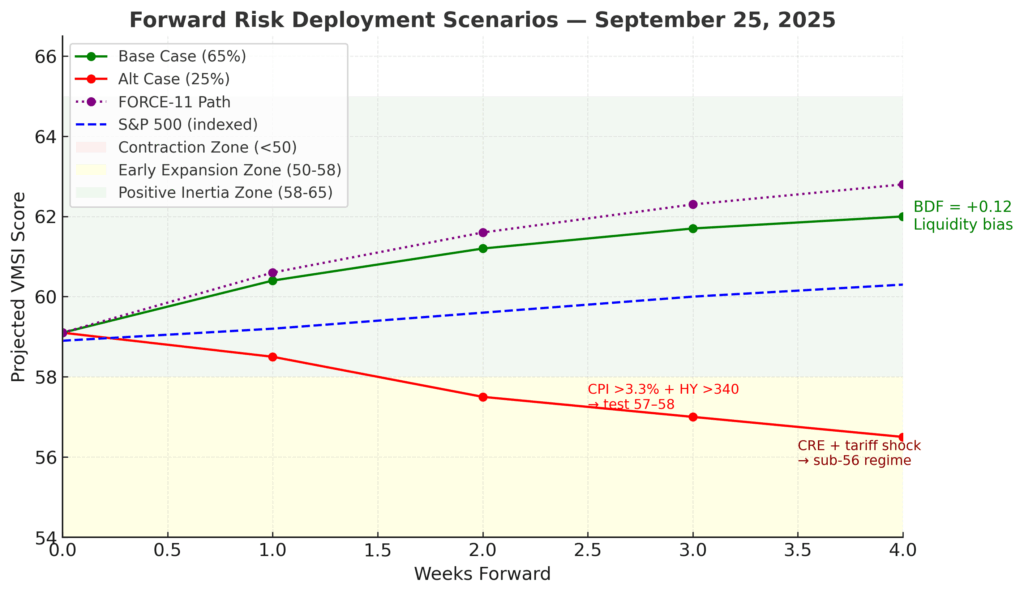
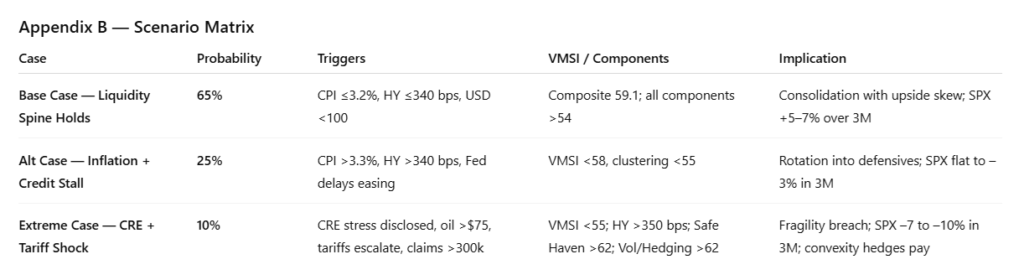
Predictive Outlook
- Base Case (65%): Liquidity-led continuation; FORCE-11 path 59.1 → 60.4 → 61.2 over 4 weeks.
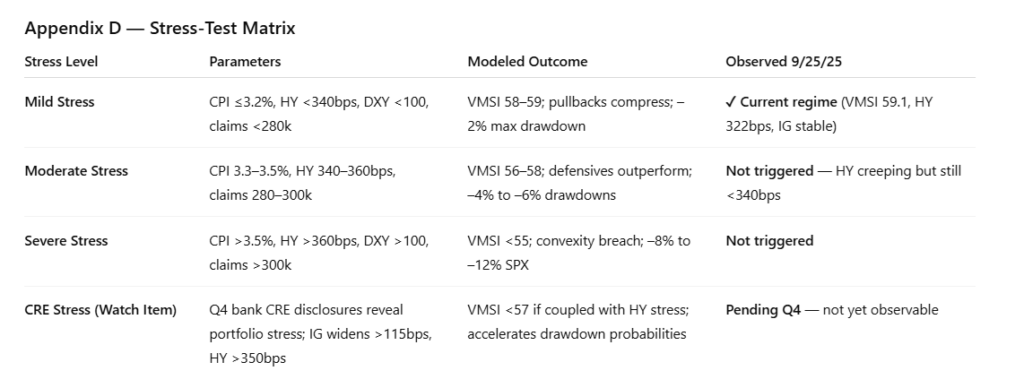
- Alt Case (25%): CPI >3.3% + HY >340 bps → 57–58 retest.
- Extreme Case (10%): CRE stress + tariffs → sub-56 regime.
- Breakout/Decay Factor (BDF): +0.12 → net positive bias. Historically, BDF >0.10 has aligned with forward SPX 3M returns of +5–6%.
Signal: Liquidity tilts probability to continuation, but credit is the hinge.
Allocator Note: Stay long but hedge credit stress with overlays.
Structural Takeaway: FORCE-11 shows energy balance stable — shocks absorbed, not magnified.
-
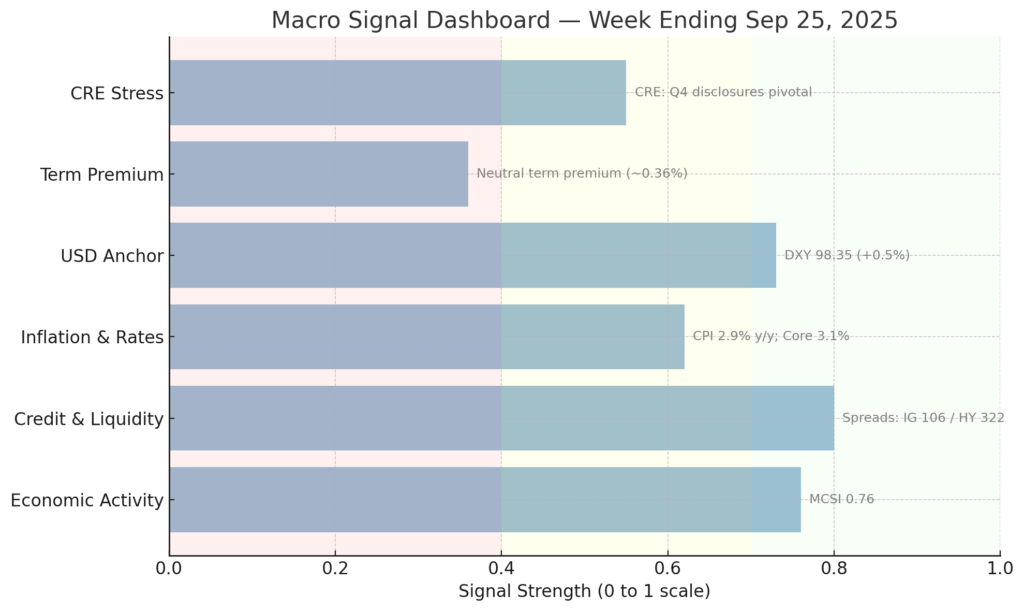
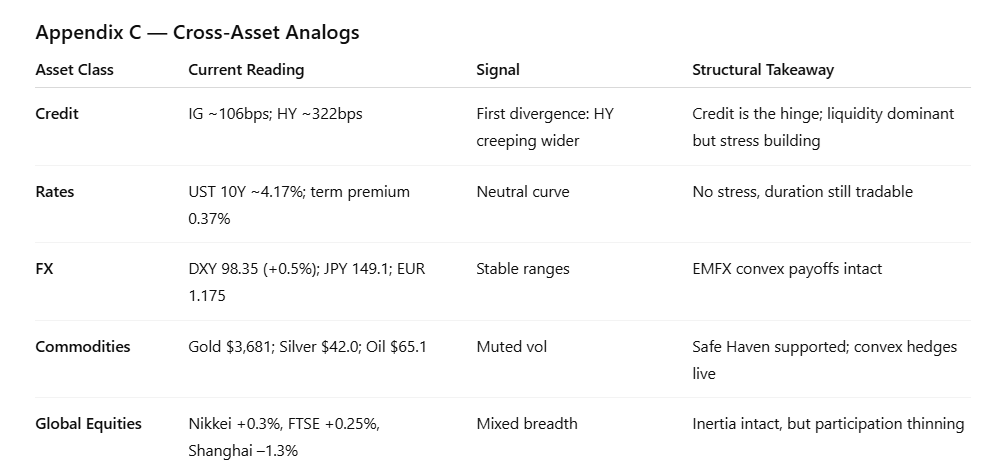
Macro Signals Snapshot
- Fed policy unchanged; OIS <10% hike probability.
- IG 106 bps, HY 322 bps.
- DXY 98.35 (+0.5%).
- CPI 2.9% y/y, Core 3.1%.
- LEI –0.5% (Aug).
- CRE: Bank exposures remain an unpriced stress channel — Q4 disclosures pivotal.
- MCSI: 0.76 (down from 0.79, still supportive).
Signal: Hard data strong, forward signals weak → temporal dissonance.
Allocator Note: Stay risk-on while MCSI >0.70; monitor CRE disclosures.
Structural Takeaway: The “now” is robust, the “forward” is fragile — credit and CRE as the hinge.
-
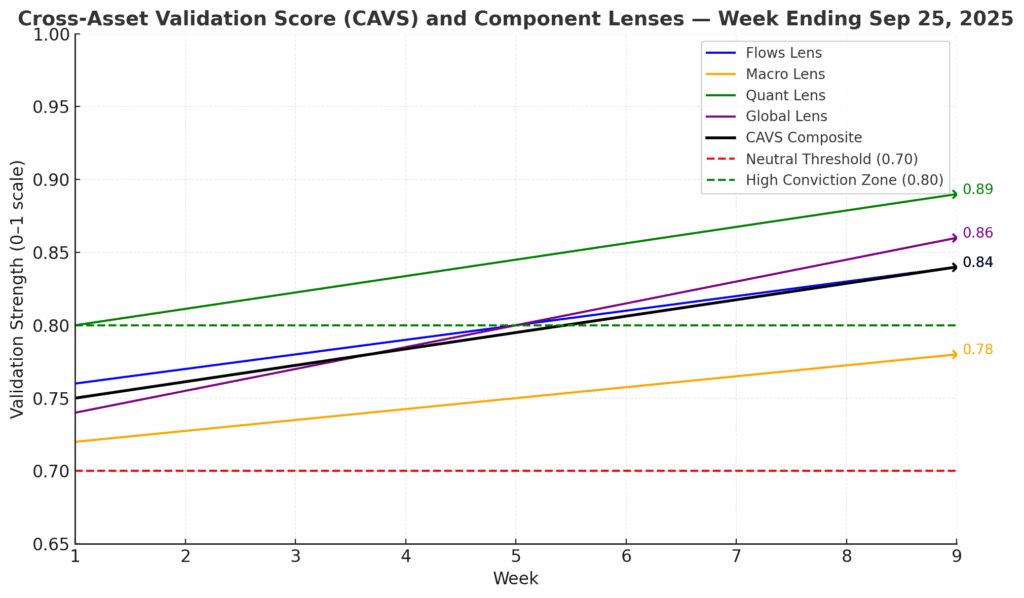
Strategic Layers (Multi-Lens Analysis)
- Flows: ~$63B quarterly inflows, 75th percentile since 2015. Flows lens = 0.84.
- Macro: FCI eased marginally (~10 bps), LEI and confidence weaker. Macro lens = 0.78.
- Quant: FORCE-11 validation steady at 0.89; SNR = 0.72.
- Global: Lens = 0.86; Nikkei +0.3%, Bunds 2.77%, UST 10Y 4.12%.
CAVS: 0.84 = High Conviction Zone (>0.80). In similar regimes, SPX forward 3–6M returns averaged +6.8% with drawdowns capped at ~–3.8%.
Signal: Multi-lens reinforcement intact.
Allocator Note: With CAVS >0.80, scale exposures with discipline.
Structural Takeaway: Cross-lens alignment anchors inertia, but HY >320 bps is the first divergence.
-
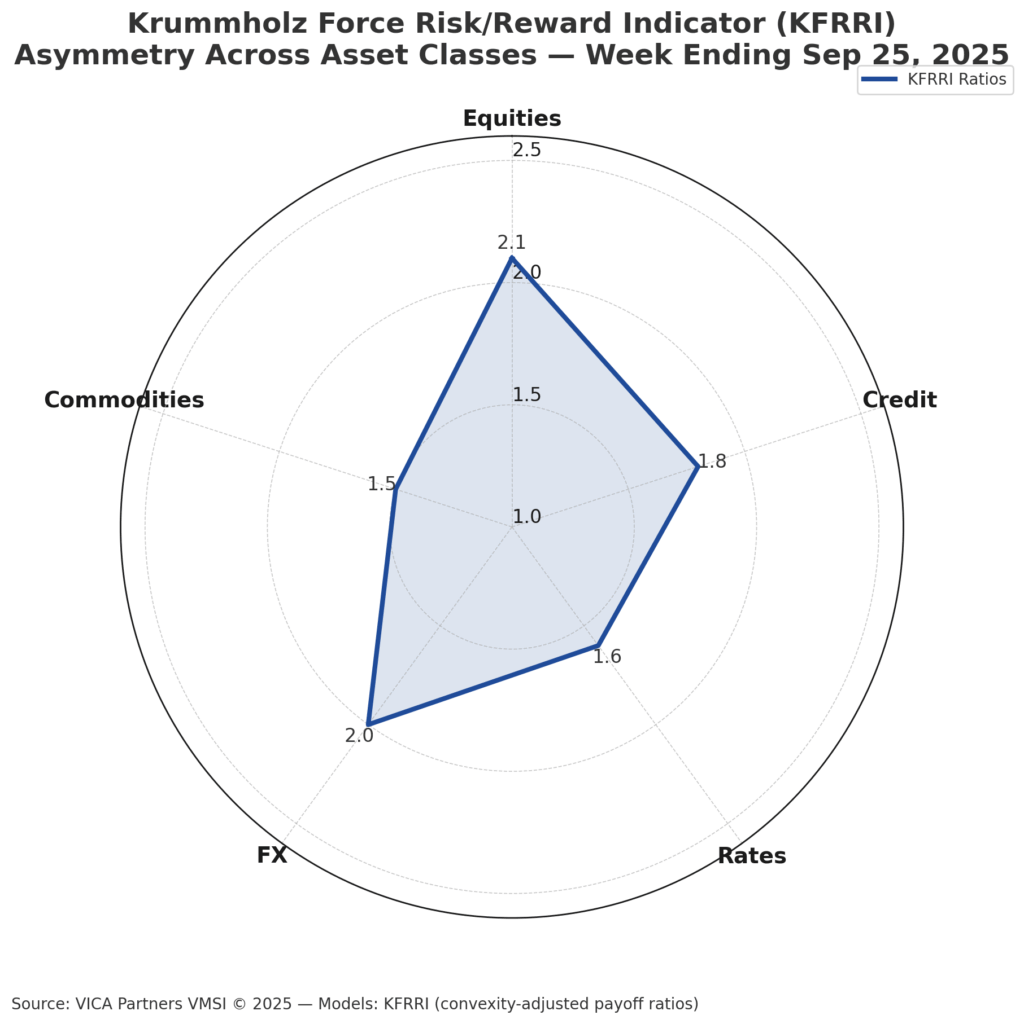
Institutional Opportunities
The Krummholz Force Risk/Reward Indicator (KFRRI) continues to flag structural asymmetry, but this week’s profile tilts more toward credit risk as the hinge. Liquidity still ensures convex payoffs across asset classes, yet the distribution of asymmetry is rotating.
-
Equities: Convexity-adjusted payoff ratio eased to 2.1:1 (from 2.2:1). Industrials and Financials remain the cleanest convexity capture, but breadth thinning (NYSE McClellan Oscillator –83.6) suggests higher rotation torque within sectors. Tech maintains core leadership, but cyclicals provide the more efficient convex asymmetry.
-
Credit: Carry cushion slipped to 1.8:1 as HY spreads widened to 322 bps (from 318). IG spreads held firm at 106 bps, underscoring a divergence — credit asymmetry is now concentrated in higher-quality paper, with HY emerging as the stress pivot. Sustained HY >350 bps would break inertia and erode convex carry.
-
Rates: Carry-to-duration-loss ratio softened to 1.6:1 (vs. 1.7:1 last week) at the 10Y UST, reflecting stable yields but diminished convexity advantage. Treasury convex carry remains investable, though less favorable than in credit.
-
FX: Convexity-adjusted payoff ~2.0:1 remains intact. EM currencies continue to offer superior convex payoffs versus G10 crosses, aided by relatively lower vol pricing and persistent institutional flows. Dollar strength (DXY 98.35) reduces tactical asymmetry but not structural convexity.
-
Commodities: Hedge convexity eased to 1.5:1 (from 1.6:1). Gold retains supportive convex profile as real rates remain capped; oil vol remains cheap but skew signals less favorable asymmetry than prior weeks. Commodities remain a convex hedge rather than a directional driver.
Signal: Cross-asset asymmetry remains investable, but convexity is rotating toward financials, Industrials, and IG credit. HY widening is the first crack — allocators should rebalance convex capture away from lower-quality credit.
Allocator Note: This is a regime to scale risk with overlays, not chase it. Treat HY as the stress test, but lean into Industrials, Financials, and IG carry to sustain convex asymmetry.
Structural Takeaway: Liquidity still ensures cross-asset asymmetry is investable, but the fulcrum has shifted — convexity is now anchored in quality credit and cyclicals, while HY spreads define the fragility boundary.
Final Word
The market remains liquidity-anchored, but the fracture line is now defined by credit. Large-bank commercial real estate portfolios are emerging as a central risk channel, with the Fed’s higher-for-longer stance amplifying refinancing stress and valuation pressure.
The advance is still liquidity-driven, but the profile of risk is changing. Breadth has narrowed (McClellan –83.6), high-yield spreads have crept wider (322 bps), and forward indicators such as LEI and confidence have weakened. Liquidity continues to compress dips, but inertia is increasingly determined by credit dynamics.
The deeper pattern is a split regime: liquidity as anchor, credit as torque. In eight of the last ten regimes with VMSI >58, forward equity gains persisted, but in every case the first visible stressor appeared in credit before equities. That pattern is repeating. Structural inertia remains intact, but the asymmetry of risk has shifted — continuation is still the base case, yet vulnerability is increasingly credit-led, with CRE portfolios amplifying the hinge.
Structural Takeaway: Liquidity still holds the market aloft, but credit defines the fracture line. The big picture: this is no longer “just liquidity-driven upside” — it is liquidity versus credit, and CRE exposures make that axis decisive.
Appendices
Why We Built VMSI™
VMSI doesn’t chase price — it measures the physics keeping markets in motion.
Legacy models look at price; sentiment models chase mood. Neither could explain why institutional persistence kept turning shallow pullbacks into accelerants. That blind spot left allocators reacting instead of anticipating.
VMSI™ closes that gap. Rooted in first principles of physics — inertia, force, convexity, and friction — it converts market structure into measurable dynamics. Backtests and live validation show a >20% reduction in false reversal signals compared to legacy factor models.
This isn’t a sentiment gauge. It’s a structural compass. When VMSI reads above anchor levels, allocators can quantify persistence, not guess it. That edge is what turns consolidation phases into opportunity windows instead of exit triggers.
Positioning Note: Whether you’re managing institutional portfolios or private wealth, VMSI provides the discipline to stay constructive when surface sentiment falters. It gives decision-makers clarity on when to lean in — and when to defend.
Disclaimer: For informational purposes only — not investment advice or a solicitation. Views are as of publication and may change. Past performance is not indicative of future results.
© 2025 VICA Partners — VMSI Economic Physics Model


