“Empowering Your Financial Success”
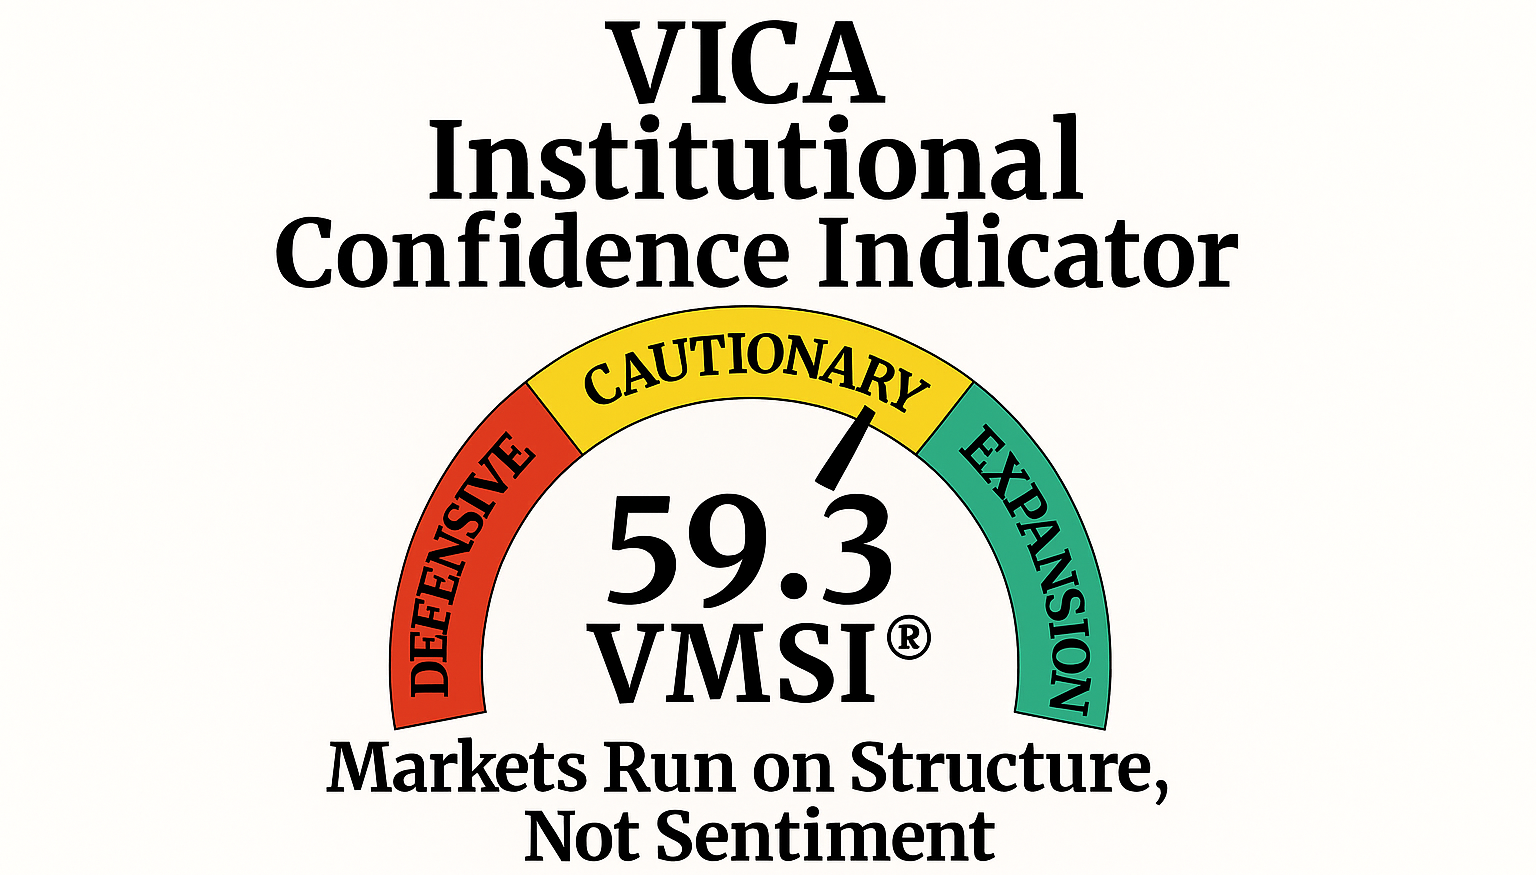
Daily Market Insights: September 25th, 2023
Global Markets Summary:
Asian Markets:
- Japan’s Nikkei 225: +0.85%
- Hong Kong’s Hang Seng: -1.82%
- China’s Shanghai Composite: -0.54%
US Futures:
- S&P Futures: opened @4,310.62 (-0.22%)
European Markets:
- London’s FTSE 100: -0.78%
- Germany’s DAX: -0.98%
- France’s CAC 40: -0.85%
US Market Snapshot:
Key Stock Market Indices:
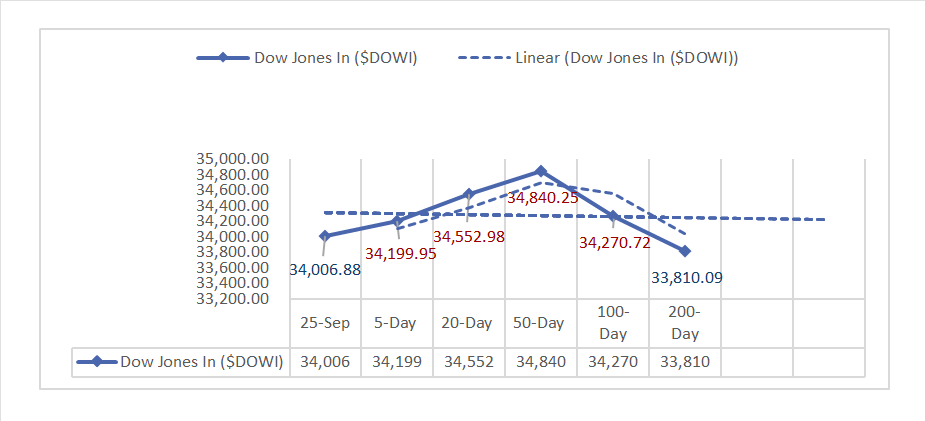
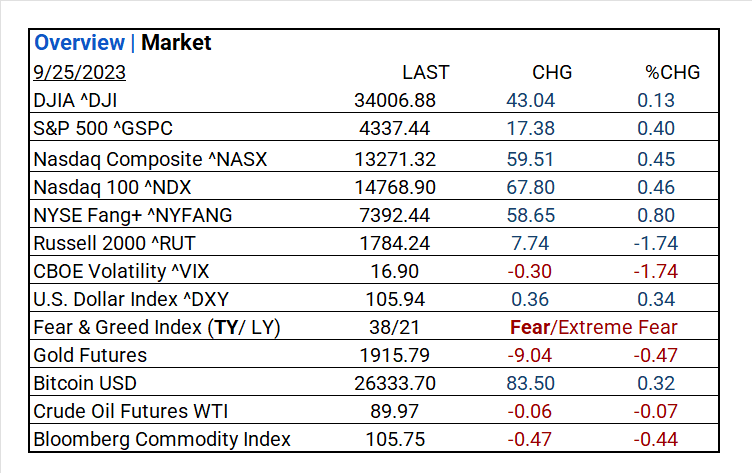
- DJIA ^DJI: 34006.88 (43.04, 0.13%)
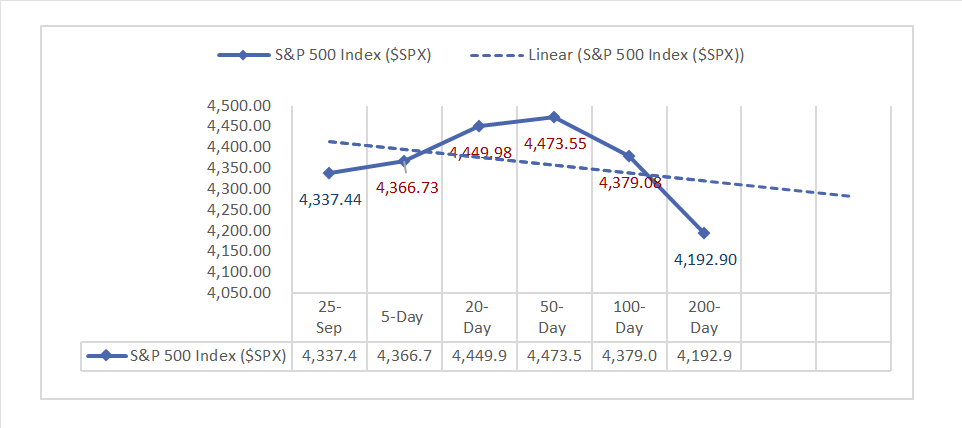
- S&P 500 ^GSPC: 4337.44 (17.38, 0.40%)
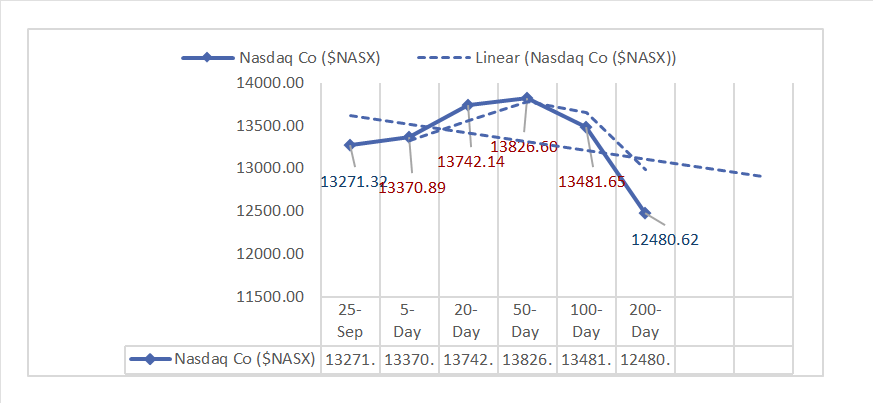
- Nasdaq Composite ^NASX: 13271.32 (59.51, 0.45%)
- Nasdaq 100 ^NDX: 14768.90 (67.80, 0.46%)
- NYSE Fang+ ^NYFANG: 7392.44 (58.65, 0.80%)
- Russell 2000 ^RUT: 1784.24 (7.74, -1.74%)
Market Insights: Performance, Sectors, and Trends:
- Economic Data: Texas Sept manufacturing activity declined; production and new orders improved but offset by a deteriorating one-year outlook. Chicago Fed’s Aug National Activity Index dropped due to lower production indicators.
- Market Indices: Posted mixed results, with DJIA, S&P 500, and Nasdaq showing gains while Russell 2000 declined.
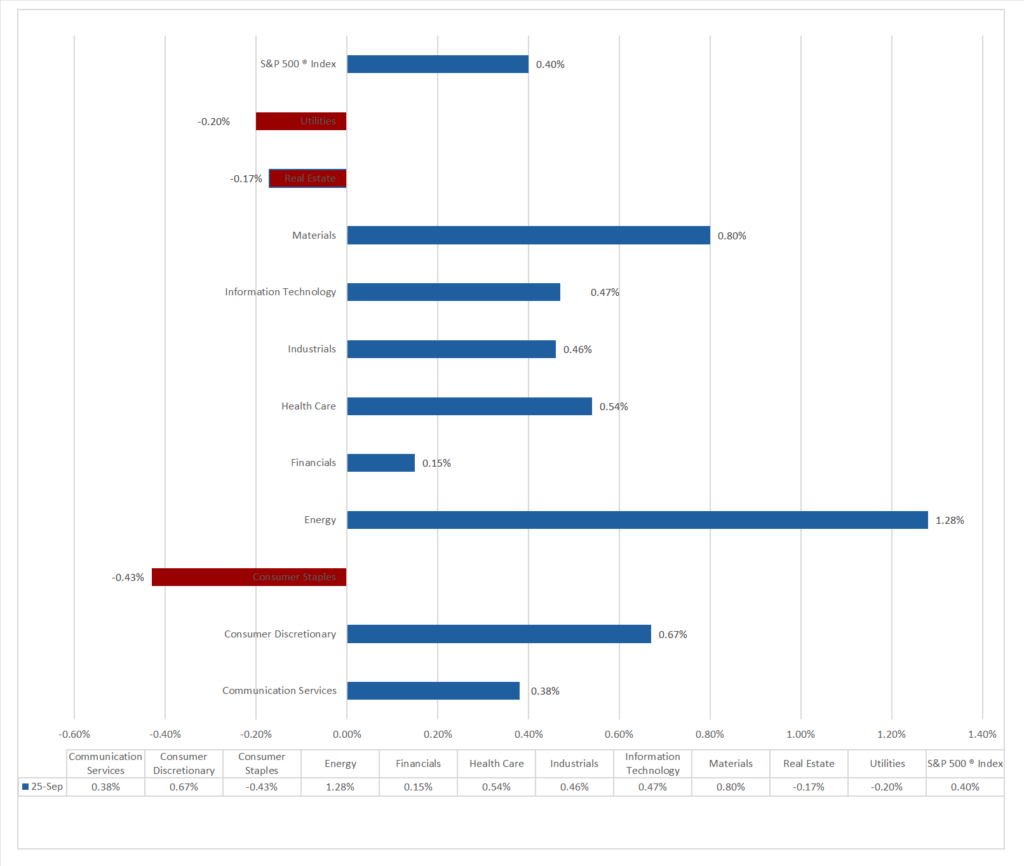
- Sector Performance: 8 of 11 sectors gained; Energy led, and Consumer Staples lagged. Notable gainers include Leisure Products (2.20%), Hotel & Resort REITs (2.03%), Independent Power and Renewable Electricity Producers (1.75%), and Broadline Retail (1.66%).
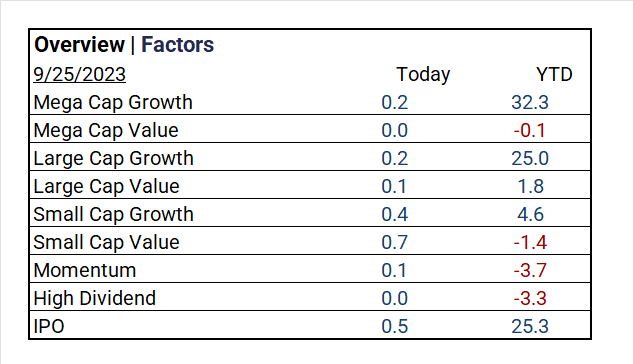
- Factors: Small Cap Value (+0.7%), Small Cap Growth (+0.4%), and IPO (+0.5%). The laggards included Mega Cap Value (+0.0%) and High Dividend (+0.0%).
- Top-performing ETF: Direxion Daily Semiconductor Bull 3X Shares ^SOXL: (+2.13%).
- Worst ETF: iShares 20 Plus Year Treasury Bond ETF ^TLT: (-2.46%).
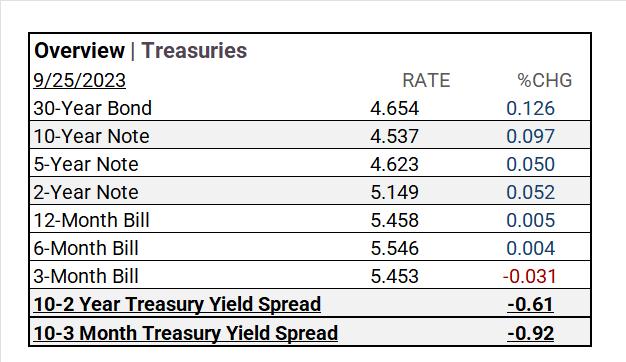
- Treasury Markets: Long-term bonds like 30-Year and 10-Year Notes had higher yields, 2-Year Notes rose slightly, while short-term bills showed minor changes. Yield spreads shifted, with 10-2 Year narrowing and 10-3 Month declining significantly.
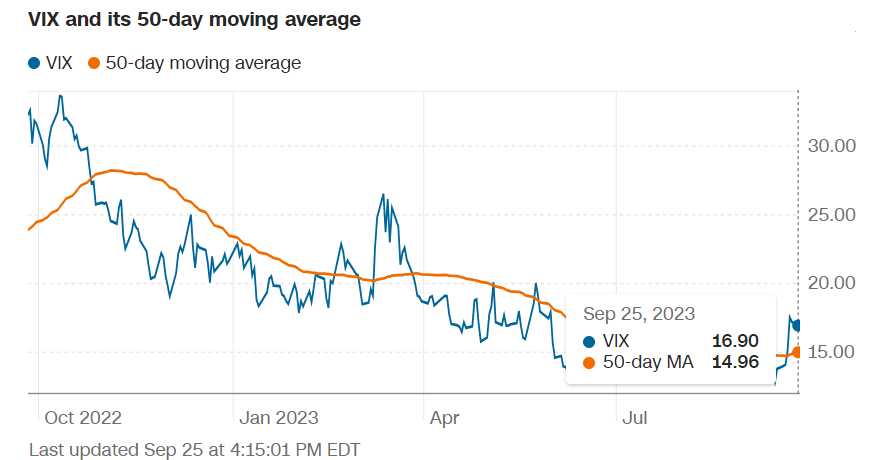
- Currency and Volatility: U.S. Dollar Index increased, CBOE Volatility dropped, Fear & Greed Index indicated fear.
- Commodity Markets: Gold Futures dropped, Bitcoin USD gained, Crude Oil Futures WTI, and Bloomberg Commodity Index declined.
Sectors:
Treasury Yields and Currency:
- In Treasury markets, long-term bonds like 30-Year and 10-Year Notes had higher yields, 2-Year Notes rose slightly, while short-term bills showed minor changes. Yield spreads shifted, with 10-2 Year narrowing and 10-3 Month declining significantly.
- The U.S. Dollar Index ^DXY: 105.94 (+0.36, +0.34%)
Market Volatility and Sentiment:
- CBOE Volatility ^VIX: 16.90 (-0.30, -1.74%)
- Fear & Greed Index (TY/LY): 38/21 (Fear/Extreme Fear).
source: CNN Fear and Greed Index
Commodities:
- Gold Futures: 1915.79 (-9.04, -0.47%)
- Bitcoin USD: 26333.70 (+83.50, +0.32%)
- Crude Oil Futures WTI: 89.97 (-0.06, -0.07%)
- Bloomberg Commodity Index: 105.75 (-0.47, -0.44%)
Factors:
- Factor top performers in key market sectors; were Small Cap Value (+0.7%), Small Cap Growth (+0.4%), and IPO (+0.5%). The laggards included Mega Cap Value (+0.0%) and High Dividend (+0.0%).
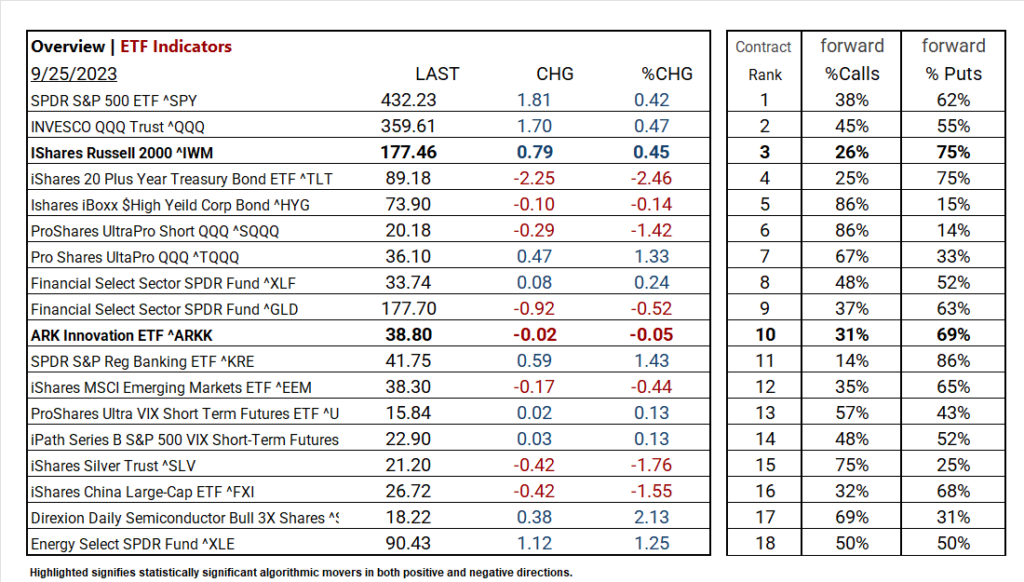
ETF Performance:
Top 3 Best Performers:
- Direxion Daily Semiconductor Bull 3X Shares ^SOXL: +2.13%
- Financial Select Sector SPDR Fund ^KRE: +1.43%
- Energy Select SPDR Fund ^XLE: +1.25%
Top 3 Worst Performers:
- iShares 20 Plus Year Treasury Bond ETF ^TLT: -2.46%
- iShares Silver Trust ^SLV: -1.76%
- iShares China Large-Cap ETF ^FXI: -1.55%
US Economic Data
- Chicago Fed National Activity Index for August: -0.16 (prior month: 0.07).
- Dallas Fed Manufacturing Index for September: -18.1 (prior month: -17.2).
- U.S. Treasury Bills: $69 billion for 13-week at a yield of 5.33% and $62 billion for 26-week at a yield of 5.315% (prior yields: 13-week at 5.315% and 26-week at 5.3%).
Earnings:
- Q1 ’23: 79% of companies beat analyst estimates.
- Q2 Forecast/Actual: Predicted <7.2%> FY 2023 S&P 500 EPS decline; FY 2023 EPS flat YoY. By 7-28, 51% reported Q2 2023 results; 80% beat EPS estimates, above 5-year (77%) and 10-year (73%) averages. Earnings exceeded estimates by 5.9%, slightly below the 5-year (8.4%) and 10-year (6.4%) averages.
- Q3 Forecast: S&P 500 to see -0.2% YoY earnings decline, marking 4th consecutive drop. S&P 500’s 12-month P/E ratio is 18.0, below 5-year (18.7%) average but above 10-year (17.5%) average. 74 S&P 500 firms gave negative EPS guidance, 42 exceeded expectations with positive guidance.
Notable Earnings Today:
- Beat: Thor Industries (THO) Miss:
Resources:
News
Investment and Growth News
- LG Electronics Chief Says EVs Will Spur New Chapter of Growth – Bloomberg
- Huawei’s New Gadgets Show How China Aims to Move Forward Without Foreign Tech – WSJ
Infrastructure and Energy
- US Energy Policy Hindering Oil Production, Chevron CEO Says – Bloomberg
- EU Should Stick to Fossil Fuels for Making Hydrogen, NGO Says – Bloomberg
Real Estate Market Updates
- Even a Booming Economy Can’t Save Atlanta’s Office Market – WSJ
Central Banking and Monetary Policy
- Bernanke Review at BOE to Probe Use of Market Rates in Forecasts – Bloomberg
- Why America Has a Long-Term Labor Crisis, in Six Charts – WSJ
International Market Analysis (China)
- China housing market: major banks begin cutting outstanding mortgage rates, but impact may not be ‘sufficient’, analysts say – SCMP