
Stay Informed and Stay Ahead: Market Watch, August 6th, 2024.
Early-Week Wall Street Markets
Key Takeaways
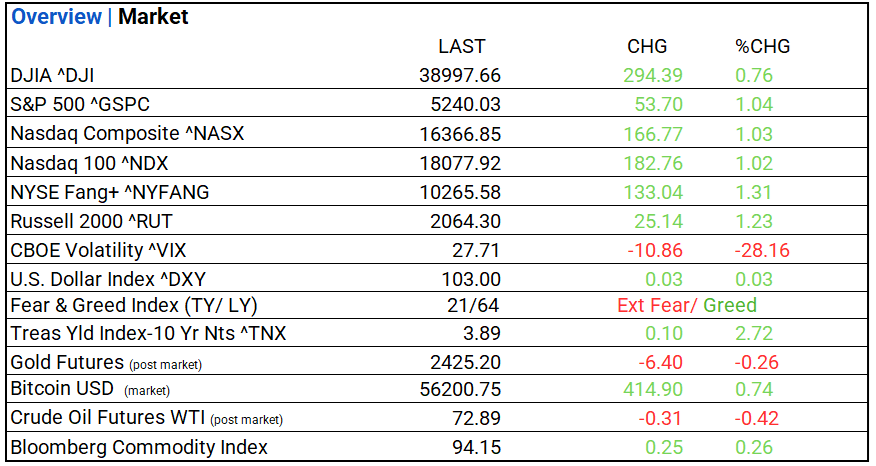
- DOW, S&P 500 and NASDAQ gain. Real Estate/ Financials higher, Energy and Materials Lower. The top industry was Personal Care Products.
- The U.S. trade deficit decreased to $73.1 billion from $75 billion, while the services surplus decreased indicating stronger international demand for U.S. goods.
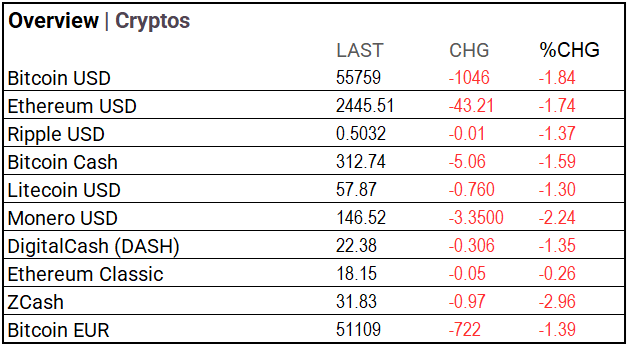
- Yields mostly rose with a pronounced adjustment in the medium-term segment of the yield curve; commodity markets were mostly lower except for natural gas and wheat, and the Bloomberg Commodity Index increased; Bitcoin tested 57K with top ETF volume, and Uber’s profits impressed analysts premarket.
Summary of Market Performance
Indices & Sectors Performance:
- DOW, S&P 500 and NASDAQ rose, All 11 S&P 500 sectors higher: Real Estate/ Financials higher, Energy and Materials Lower. Top industries included Personal Care Products (+9.56%), Independent Power and Renewable Electricity Producers (+4.44%), and Ground Transportation (+4.42%).
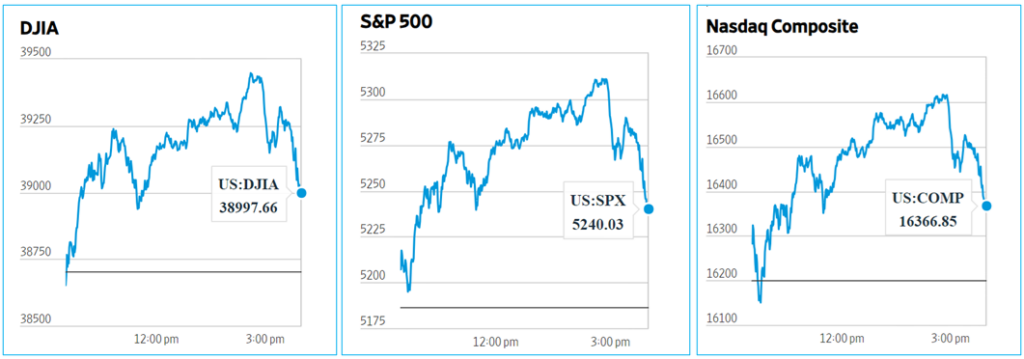
Chart: Performance of Major Indices
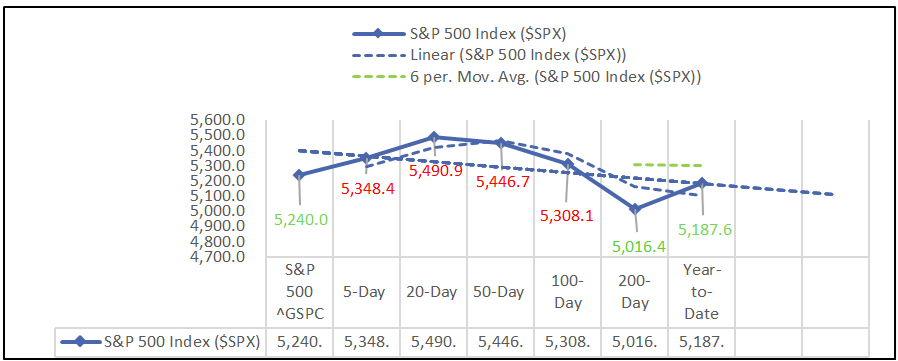
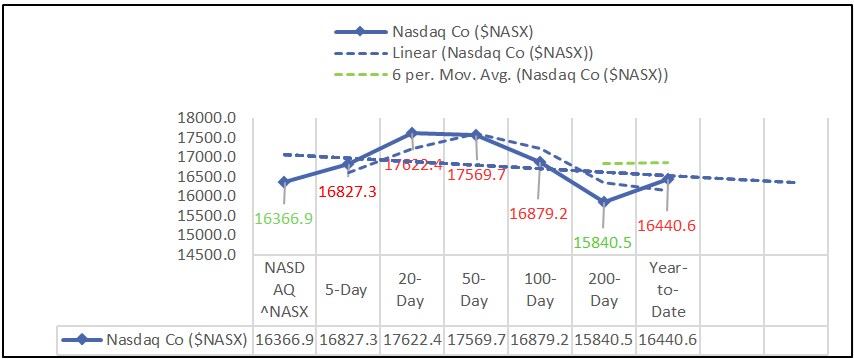
Moving Average Analysis:
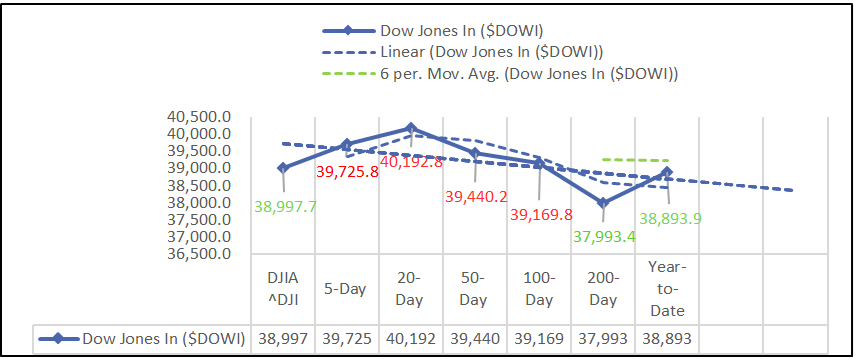
-
S&P 500 filled gap; key levels: 5,120 support, 5,450 (50- Day) resistance.
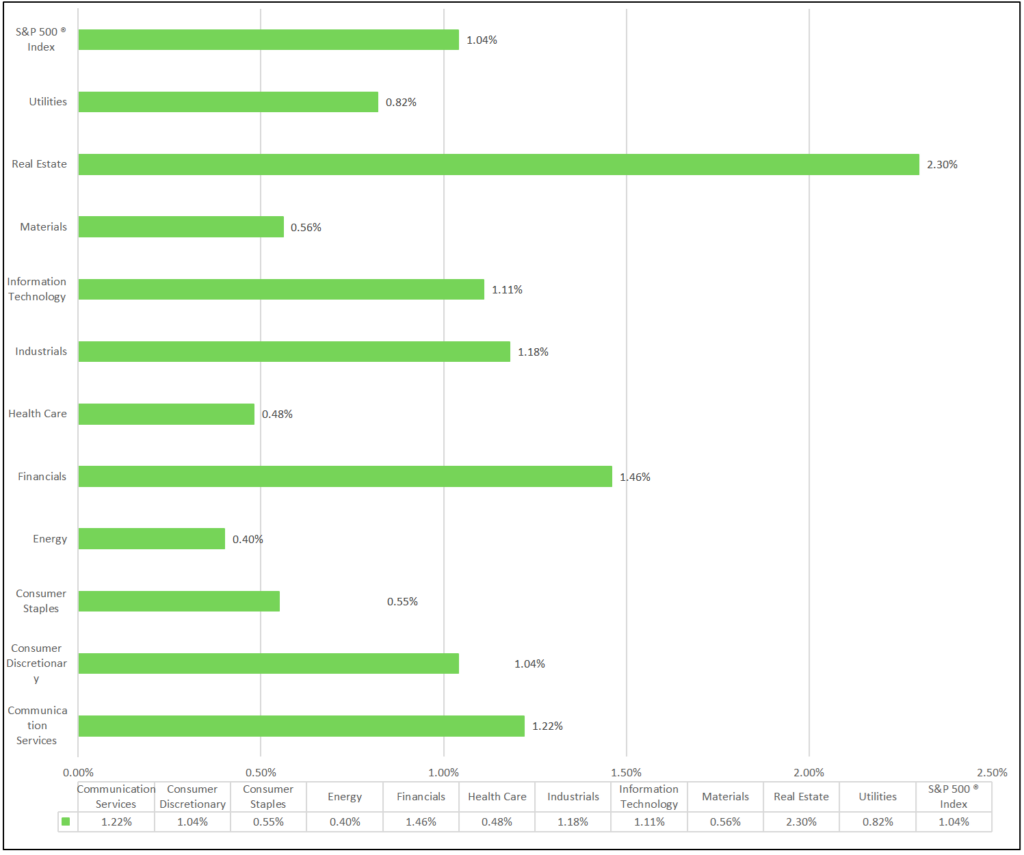
S&P 500 Sectors:
- Among eleven sectors, all 11 rise. Real Estate leading and Energy trailing.
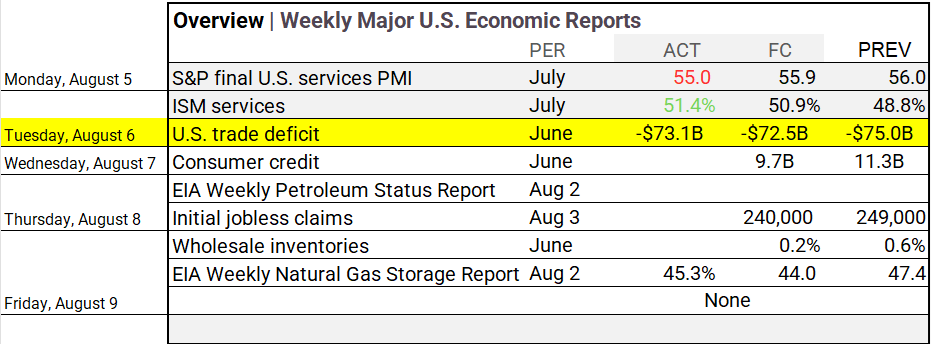
Economic Highlights:
- As of June 2024, the U.S. trade deficit decreased to $73.1 billion from $75 billion in May, mainly because exports grew more than imports; the goods deficit dropped by $2.5 billion to $97.4 billion, while the services surplus decreased by $0.6 billion to $24.2 billion, indicating stronger international demand for U.S. goods.
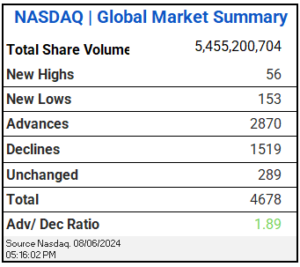
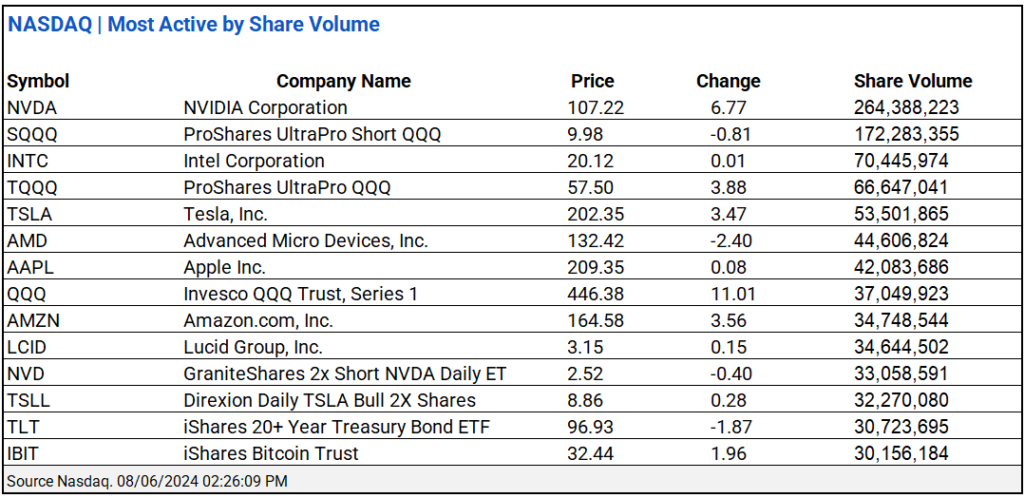
NASDAQ Global Market Update:
- NASDAQ total share volume was 5.45 billion, with an advance/decline ratio of 1.88, NVIDIA Corporation and ProShares UltraPro SQQQ led active trading.
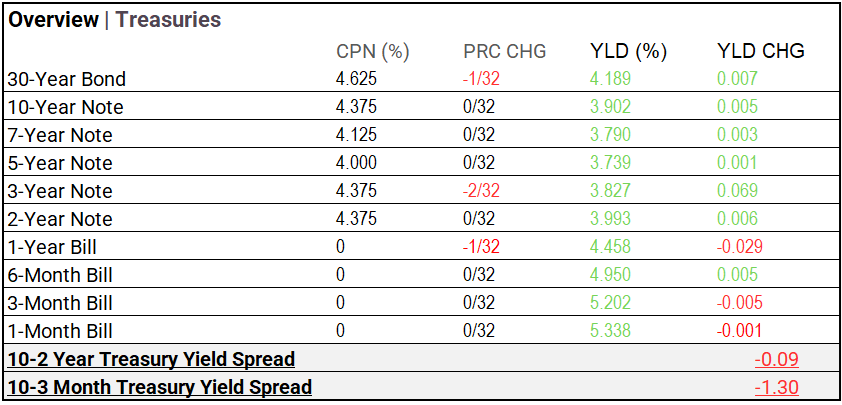
Treasury Markets:
- The yields on the 30-Year Bond, 10-Year Note, 7-Year Note, 5-Year Note, 3-Year Note, 2-Year Note, 6-Month Bill, and 3-Month Bill all increased, while the 1-Year Bill and 1-Month Bill yields declined. Notably, the 3-Year Note yield saw a significant rise compared to the modest increases in longer-term yields like the 30-Year Bond, indicating a more pronounced adjustment in the medium-term segment of the yield curve today.
Market Factors:
- Expect Thursday update
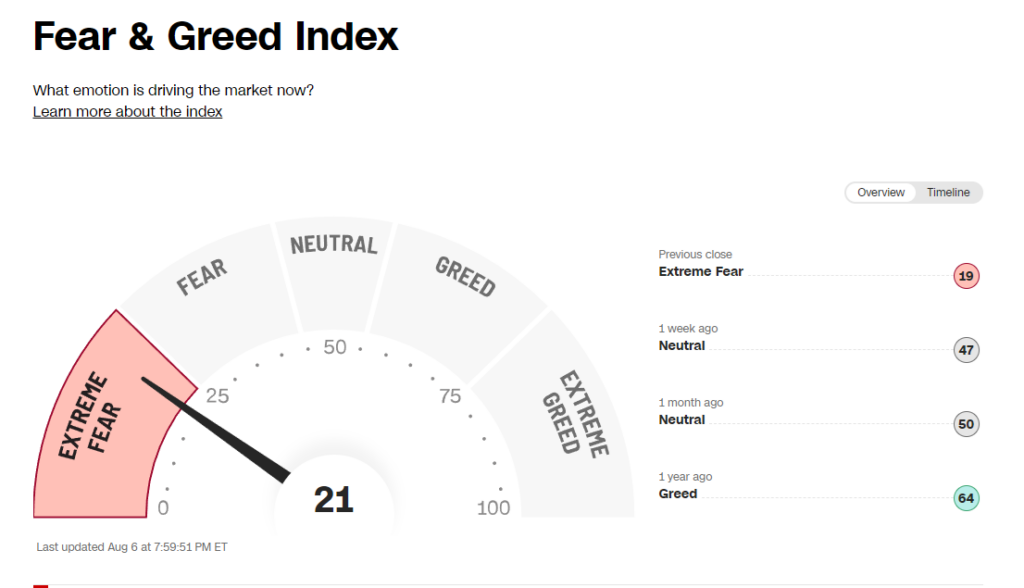
Currency & Volatility:
- The VIX eased to 27.71 (-28.16%), and the Fear & Greed Index has shifted further to “Extreme Fear” from last year’s “Greed.”
Commodities & ETFs:
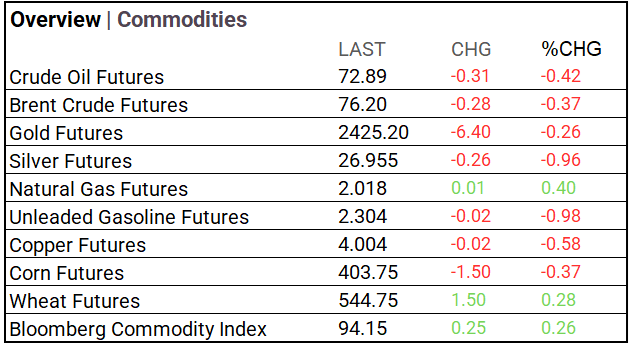
- Commodity markets were mostly lower: crude oil, Brent, gold, silver, unleaded gasoline, copper, and corn fell, while natural gas and wheat rose; the Bloomberg Commodity Index increased.
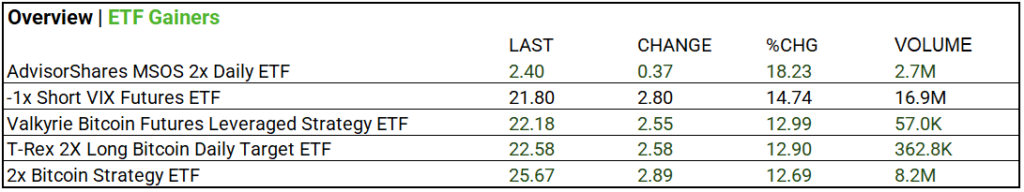
- ETFs: -1x Short VIX Futures ETF rose 14.74% on a volume of 16.9M while 2x Bitcoin Strategy ETF rose 12.69% on volume of 8.2M.
Cryptocurrency Update:
- Bitcoin regains footing. almost eclipsing 57K in session.
Stocks:
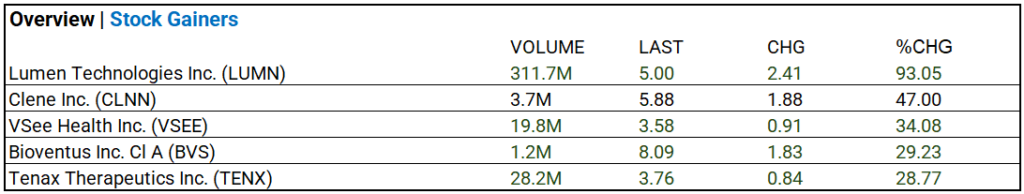
- Lumen Technologies Inc. (LUMN) up 93.05% with a volume of 311.7 M.
Notable Earnings:
- Uber Tech (UBER), Duke Energy (DUK), Zoetis Inc (ZTS), Transdigm (TDG), and Marathon Petroleum (MPC) beat; Amgen (AMGN), Caterpillar (CAT), Airbnb (ABNB), and Super Micro Computer (SMCI) miss. Uber impresses analysts with favorable profit growth.
Note: Super Micro Computer, Meta and Amazon have upped capex guidance due to strong demand, focusing on long-term returns. While short-term margins may be squeezed, these investment supports future innovation and growth.
Global Markets Summary:
- Japan’s benchmark Nikkei 225 index ended the day up 10.23 percent on Tuesday, after its biggest single-day point drop Monday.
Strategic Investment Adjustments and Historical Market Trends:
Key Takeaways
- Long-Duration Bonds: Focus on long-duration bonds, which benefit from rate cuts due to their inverse relationship with interest rates. Historically, a 1% rate cut can increase long-duration bond prices by 10-15%. As the Fed eases rates, their value rises since fixed payments become more attractive compared to new, lower-rate bonds.
- Nasdaq/Tech and Growth Industries: Stay the course with Nasdaq/Tech for long-term growth in semiconductors, aiming for a CAGR of 12-15%. Top CAGR growth industries include Technology (10-15%), Healthcare (8-12%), Renewable Energy (8-12%), E-commerce (10-15%), Fintech (9-13%), AI and Machine Learning (12-20%), and Cybersecurity (11-14%).
- Diversification: Diversify with Russell 2000 (small-cap) ETFs, which have historically returned about 8-10% annually, and bank index ETFs, which typically return around 6-8%, to manage risk. Real estate sectors, benefiting from lower rates, can add stability with average returns of 8-10%.
- Election Year Trends: Historically, election years bolster market growth due to heightened fiscal stimulus and increased investor optimism, with the S&P 500 averaging returns of about 6-7%. In the past 50 years, 78% of election years have seen positive market performance, driven by increased government spending and economic policy proposals.
In the NEWS:
Central Banking, Monetary Policy & Economics:
- BOJ Won’t Raise Rates When Markets Are Unstable, Deputy Gov. Says – WSJ
- US Trade Deficit Narrows to $73.1 Billion as Exports Pick Up – Bloomberg
Business:
- Uber Shares Jump as Company Returns to Profitability – WSJ
- Lumen Technologies Extends Record Rally on AI Hopes – Bloomberg
China:
- Explainer | Is support coming at the right time for China’s economy? 4 takeaways from July’s PMI data – SCMP


