
Stay Informed and Stay Ahead: Market Watch, September 18th, 2024.
Late-Week Wall Street Markets
Key Takeaways
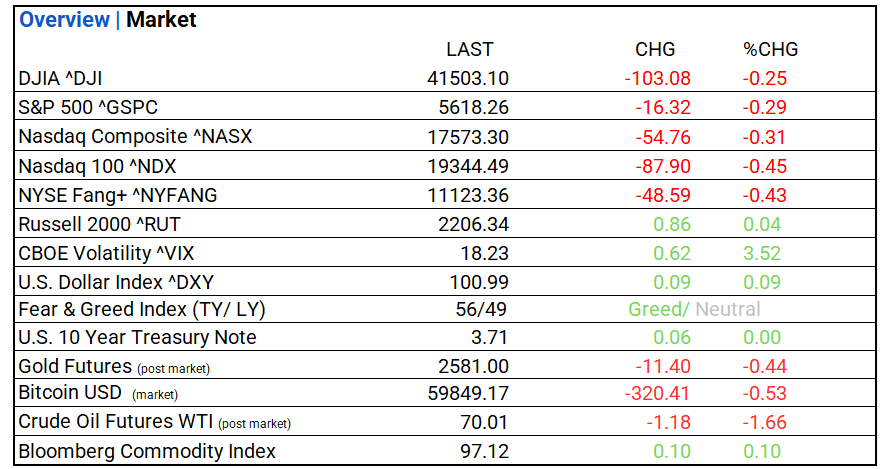
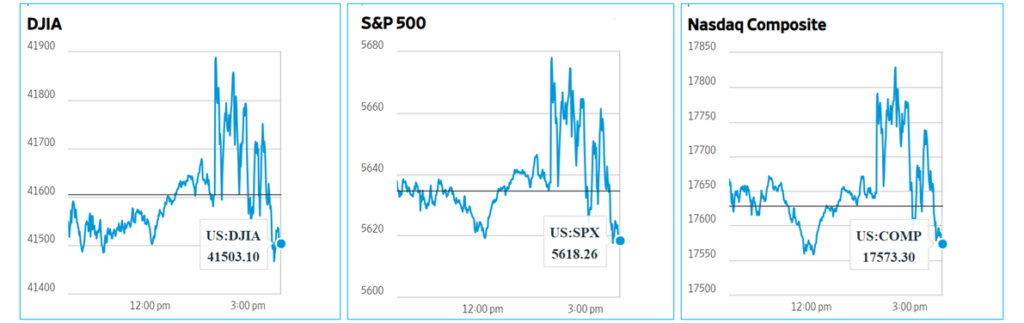
- Markets: DOW, S&P 500, and NASDAQ with late day declines. Energy leads, Utilities lags. Top industry: Technology Hardware Storage & Peripherals.
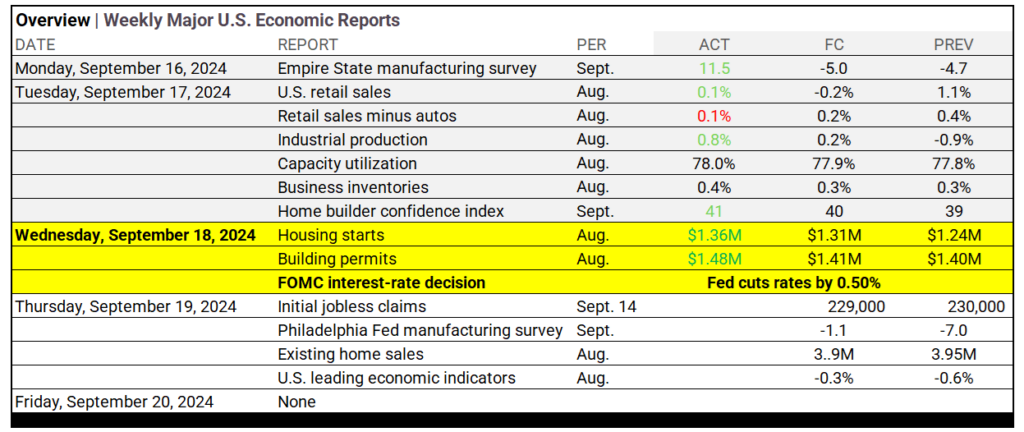
- Economics: The Federal Reserve cut interest rates by 0.5%, its first reduction since 2020, lowering the federal funds rate to 4.75%–5%. In the housing market, August saw 1.36 million housing starts, surpassing forecasts but facing future slowdown concerns.
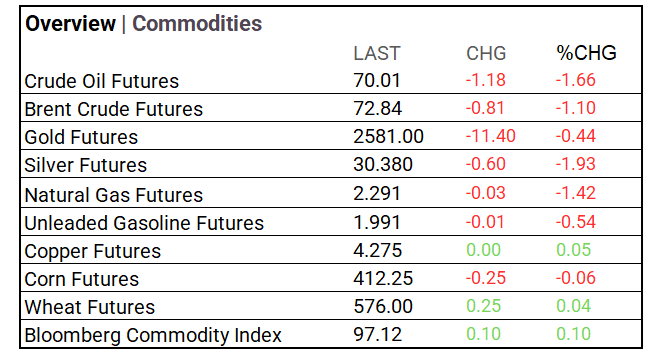
- Yields & Commodities: US Treasuries Long-term rates increased, short-term yields varied, reflecting typical curve behavior as the Fed cut rates by 0.50%. Commodity markets were mostly negative: crude oil fell 1.66%, natural gas dropped 1.42%, and silver declined 1.93%. Gold slid 0.44%. Minor gains were seen in copper, wheat, and the Bloomberg Commodity Index, up 0.10%.
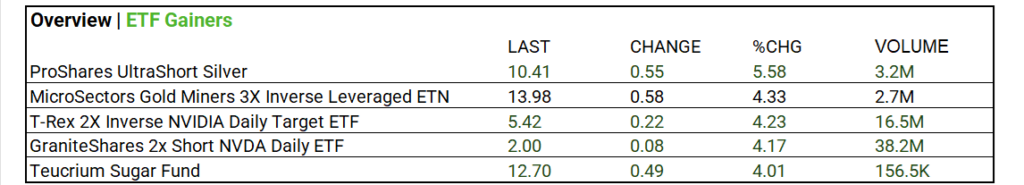
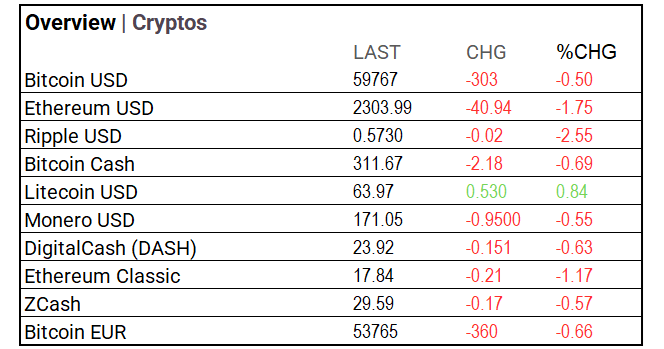
- Crypto & ETFs: Cryptocurrencies mostly fell: Bitcoin down 0.50%, Ethereum 1.75%, and Ripple 2.55%. Litecoin rose 0.84%. ETF volume gainers, NVIDIA shorts saw heavy volume: GraniteShares 2x Short NVDA ETF up 4.17% on 38.2M shares, T-Rex 2X up 4.23% on 16.5M shares.
- Market Tips: Focus on long-duration bonds and consider refinancing leading companies as Q4 rate cuts approach. Diversify with Russell 2000 ETFs “small caps will rally” with Fed cuts. Fed futures indicate a 98bps cut by year-end, with 50bps cut today.
Market Summary
Indices & Sectors Performance:
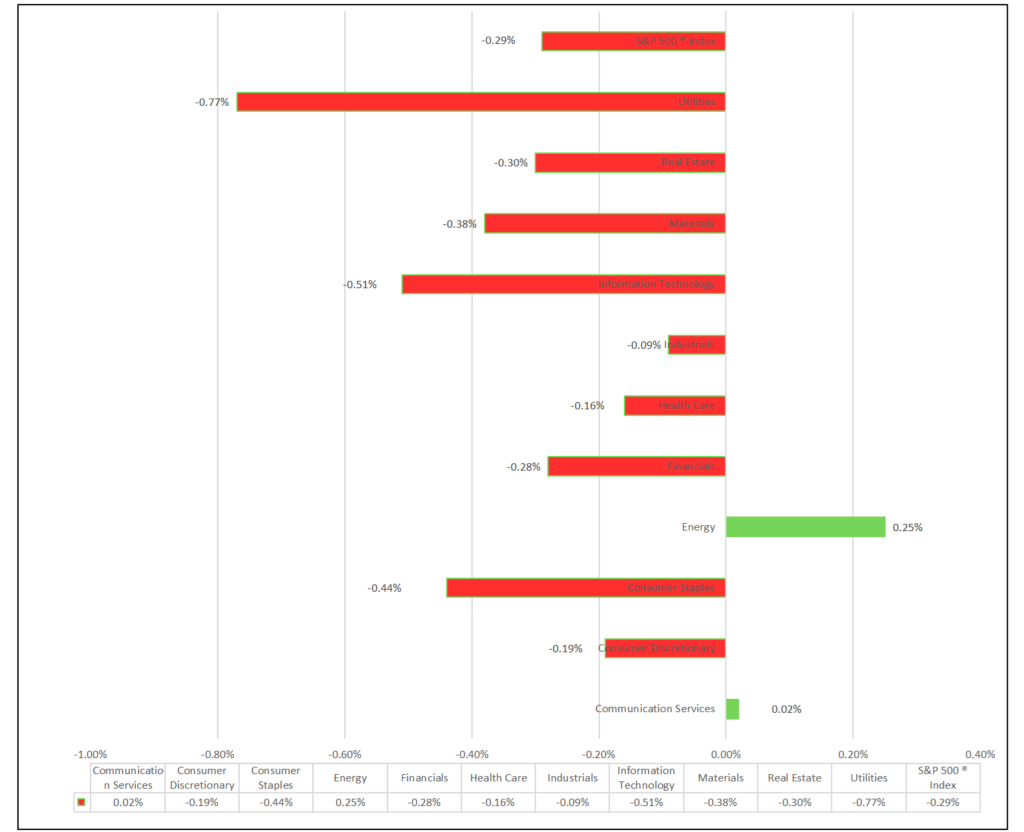
- DOW, S&P 500, and NASDAQ fell. 9 of 11 sectors decline, Energy leads, Utilities lags. Industry Leaders: Technology Hardware Storage & Peripherals (+1.70%), Real Estate Management & Development (+1.67%), and Office REITs (+1.09%).
Technical:
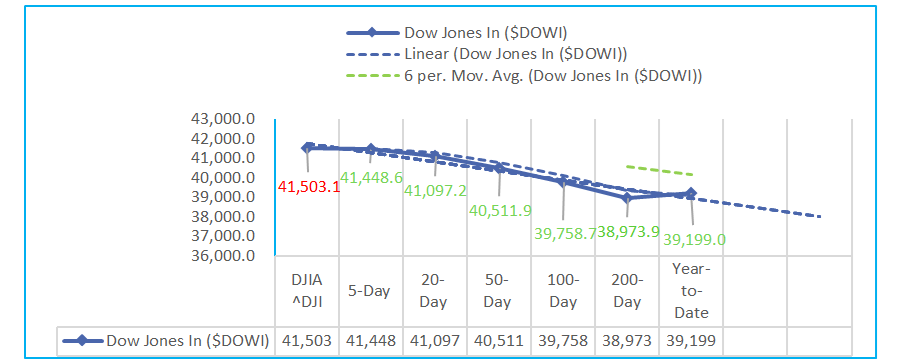
- The Dow Jones Industrials (DOWI) has seen consistent growth. Over the 5-day period, it increased by 1.57%, with a year-to-date rise of 10.12%. The 200-day moving average shows a 15.44% gain, indicating strong long-term performance. Stochastic indicators point to ongoing momentum, with the 9-day stochastic at 85.74%. Relative strength sits at 62.51%, reflecting moderate strength. Historic volatility remains low, while the MACD oscillator suggests positive trends, particularly over the longer term.
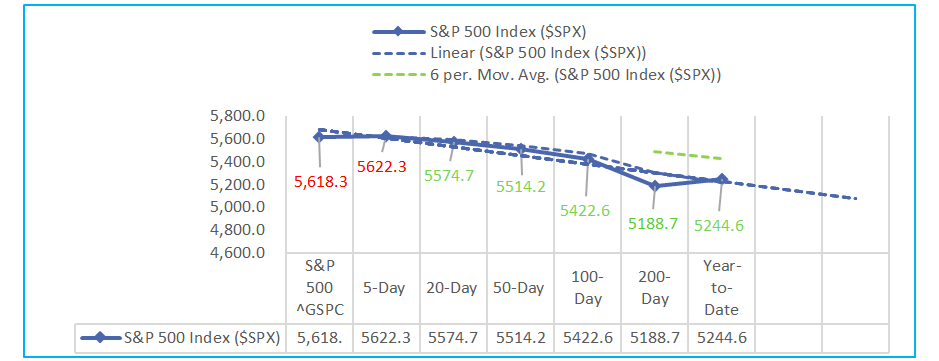
- The S&P 500 (SPX has shown steady gains across various timeframes. Over the 5-day period, it increased by 1.15%, while the year-to-date growth reached 17.79%. The 200-day moving average rose by 23%, reflecting strong overall performance. Stochastic and relative strength indicators suggest continued momentum, with 9-day stochastic at 86.85% and 9-day relative strength at 59.38%. Historic volatility remains moderate, and the MACD oscillator signals positive trends, particularly in the longer term.
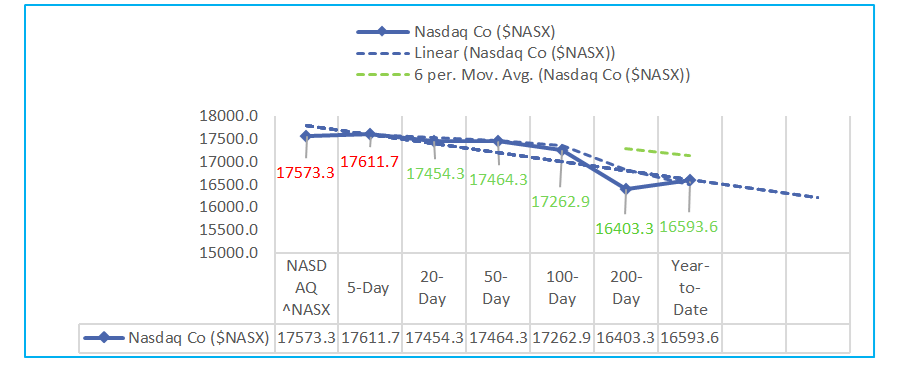
- The Nasdaq Composite (NASX) saw a 1.02% gain over the last 5 days but has faced a 4.64% drop over the past 50 days. Year-to-date, it has risen by 17.07%. The 200-day moving average shows a strong 23.53% increase, indicating long-term strength. Stochastic indicators suggest ongoing momentum, with a 9-day stochastic at 84%. Relative strength is moderate at 55.86%, while historic volatility is higher than usual. The MACD oscillator shows mixed trends, with more volatility over the longer term.
Sectors:
- Over the past 90 days, the S&P 500 sectors have shown mixed results. Real Estate led with a 16.88% gain, followed by Utilities at 13.13%, and Financials at 11.42%. While Information Technology declined 3.34% and Communication Services dipped 0.71%, most sectors maintained positive year-to-date (YTD) growth, with Information Technology up 24.89%. Energy showed slight improvement at 0.19%, reflecting the broad sectoral divergence. Overall, despite short-term fluctuations, most sectors have seen solid growth YTD.
Economic Highlights:
- The Federal Reserve’s decision to lower interest rates by 0.5 percentage points is its first cut since 2020, reflecting a significant policy shift after a two-year focus on fighting inflation, bringing the federal funds rate down to a range of 4.75%–5%. This cut hints at further potential easing, with projections indicating that additional quarter-point cuts could come in November and December. In the housing market, August’s stronger-than-expected data showed 1.36 million housing starts, surpassing the 1.31 million forecast and the previous 1.24 million. Building permits also exceeded expectations, rising to 1.48 million. However, despite this temporary boost, economists anticipate a slowdown due to rising inventories and tepid demand, even as mortgage rates decline.
NASDAQ Global Market Update:
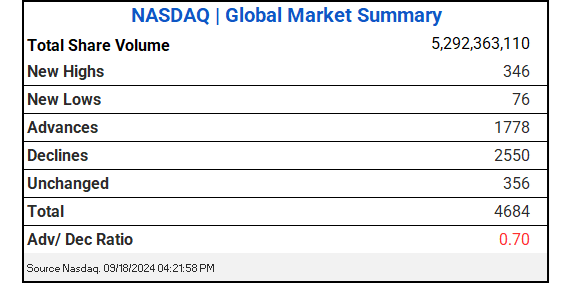
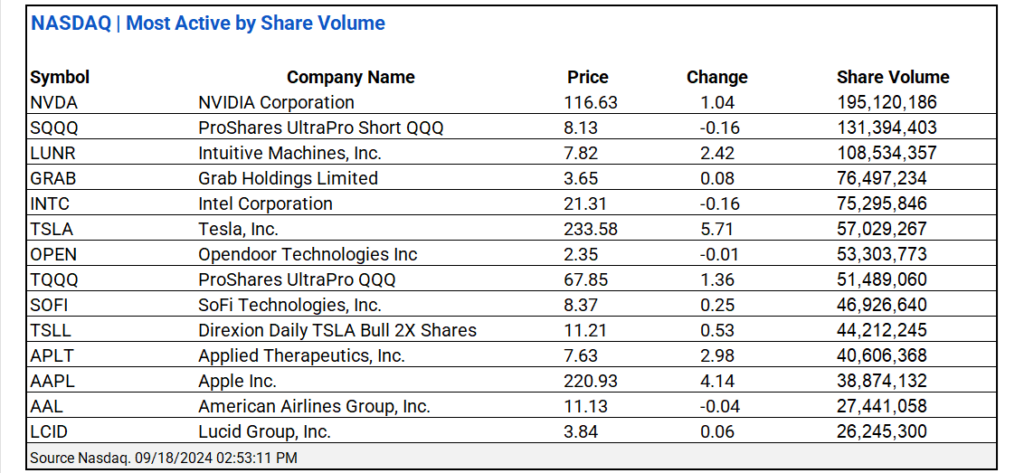
- NASDAQ saw 5.29B shares traded with a 0.74 advance/decline ratio. NVIDIA ^NVDA and ProShares UltraPro Short QQQ ^ SQQQ led share volume actives. Notable is Intuitive Machines, Inc. ^LUNR.
US Treasuries & Bond Markets:
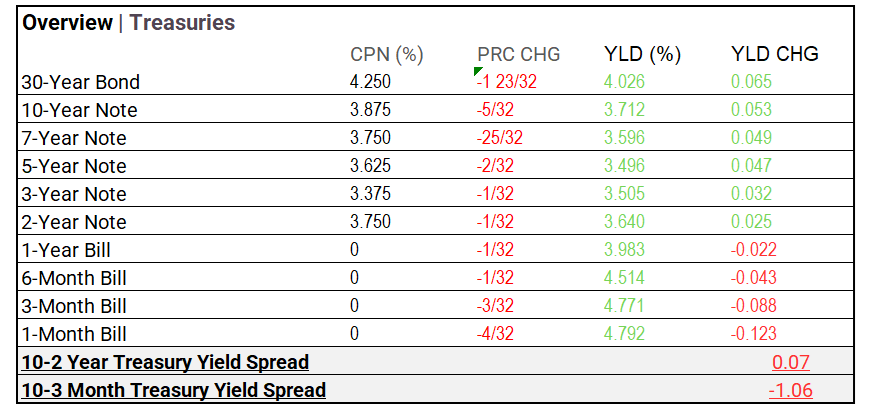
- US Treasuries: The 30-year bond yield rose by 6.5 basis points to 4.026%, while the 10-year note increased by 5.3 basis points to 3.712%. Shorter-term yields saw mixed movements, with the 1-year bill’s yield decreasing by 2.2 basis points to 3.983%, and the 3-month bill dropping by 8.8 basis points to 4.771%. This reflects a typical yield curve, where longer-term rates are increasing, while shorter-term yields have softened.
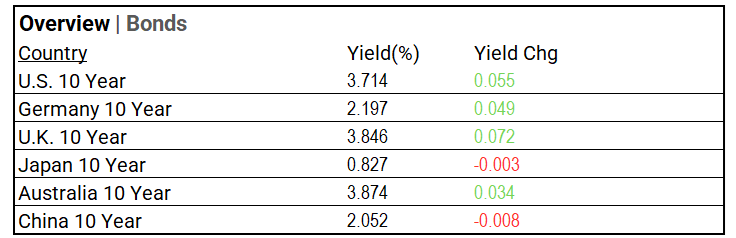
- Global bonds: Global 10-year bond yields mostly rose, with the U.S. at 3.714% and the U.K. leading gains at 3.846%. Germany and Australia saw modest increases, while Japan and China experienced slight declines.
Market Factors:
- Weekly update on Friday.
Volatility:
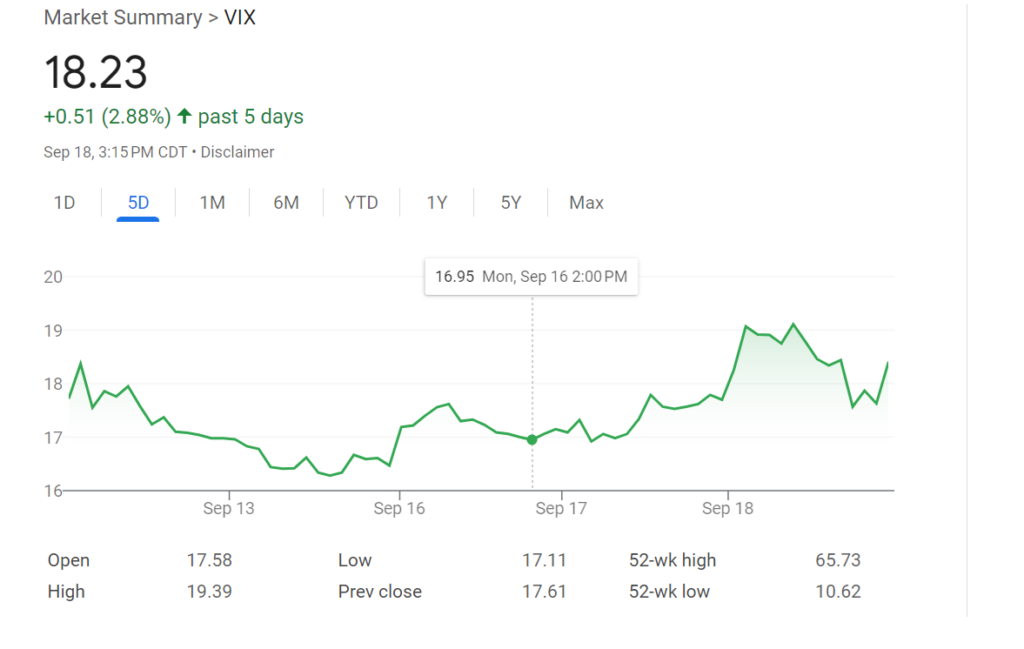
- VIX at 18.23 (+3.52%); The VIX Index increased 2.88% over the past five, indicating moderate market instability and investor indecision.
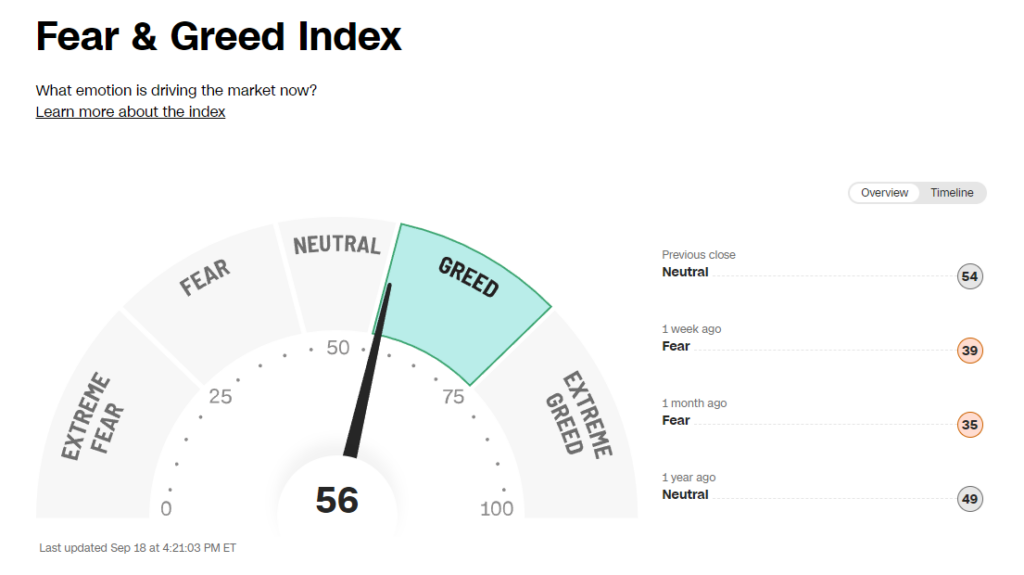
- The Fear & Greed Index rises to “Greed”, MCV Index returns to “Extreme Greed”.
Commodities & ETFs:
- Commodity markets saw mostly negative movement. Crude oil and natural gas futures declined, with crude oil dropping 1.66% and natural gas down 1.42%. Precious metals also slipped, as silver fell 1.93% and gold dipped 0.44%. Minor gains were noted in copper, wheat, and the Bloomberg Commodity Index, which edged up 0.10%.
- ETF volume gainers: NVIDIA shorts saw significant volume, with GraniteShares 2x Short NVDA Daily ETF trading 38.2 million shares, up 4.17%. The T-Rex 2X Inverse NVIDIA Daily Target ETF also moved up 4.23%, with 16.5 million shares traded. These figures reflect strong interest in NVIDIA short strategies.
Cryptocurrency & Currency:
- Cryptocurrency: Crypto’s saw mostly losses. Bitcoin dropped 0.50% to $59,767, and Ethereum fell 1.75% to $2,303.99. Ripple led the declines, down 2.55% to $0.5730. Litecoin was the only gainer, up 0.84% to $63.97.
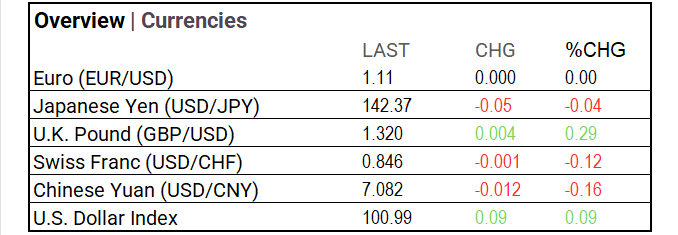
- Currencies: The U.S. Dollar Index edged up 0.09% to 100.99. The British Pound rose 0.29% to $1.320, while the Euro remained flat. The Japanese Yen, Swiss Franc, and Chinese Yuan saw small declines.
Stocks:
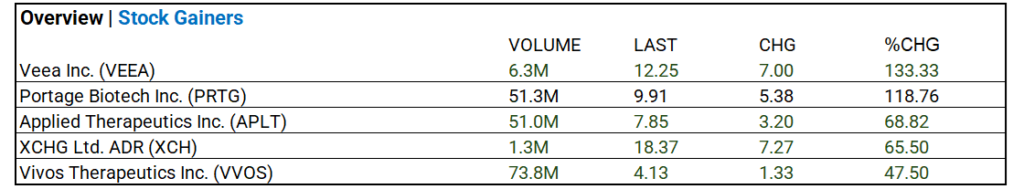
- Stock Advancers: High-volume gainers included Portage Biotech Inc. (PRTG), soaring 118.76% with 51.3M shares traded, while Applied Therapeutics Inc. (APLT) saw a 68.82% increase with 51.0M shares traded. Vivos Therapeutics Inc. (VVOS) climbed 47.50% with 73.8M shares exchanged.
Notable Weekly Earnings:
- General Mills (GIS) beat.
- Ferguson (FERG), Ermenegildo Zegna NV (ZGN) miss.
Global Markets Summary:
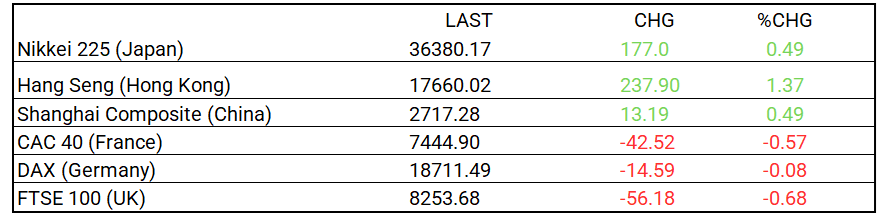
- Asian markets saw gains with Nikkei 225 up 0.49%, Hang Seng rising 1.37%, and the Shanghai Composite also up 0.49%. In contrast, European markets faced losses, with CAC 40 down 0.57%, DAX slipping 0.08%, and the FTSE 100 falling 0.68%.
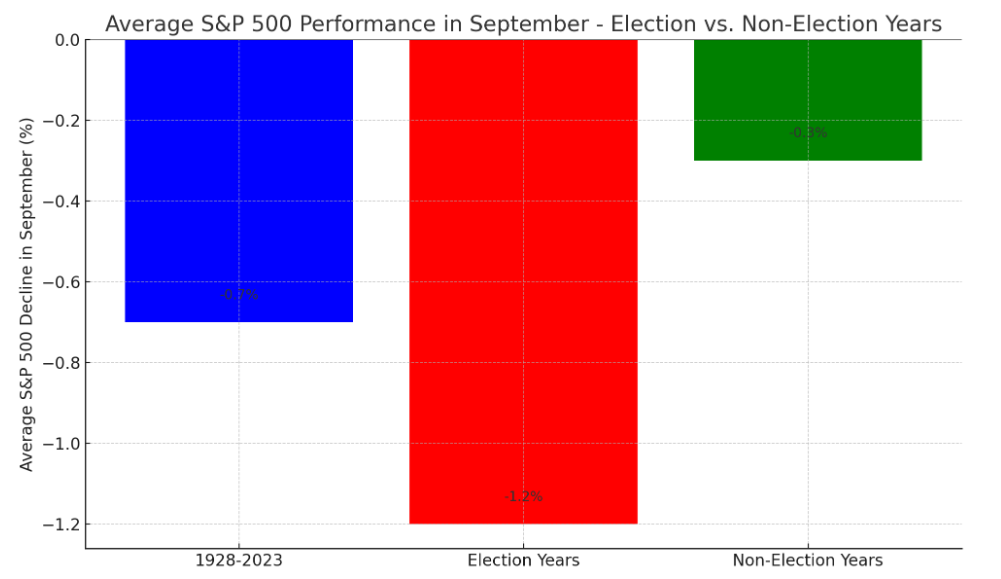
Historical Patterns and Market Impact September
- Election Years: The S&P 500 typically experiences a steeper average decline in September during election years. In election years, this drop becomes even more pronounced, with the index falling in 60% of Septembers. Historically, the VIX has been 10-15% higher in these Septembers compared to non-election years.
- Non-Election Years: The decline is less pronounced, reflecting lower uncertainty.
- Historical Average (1928-2023): September tends to be weak overall, with an average decline of 0.7%.
Strategic Investment Adjustments:
- Focus on long-duration bonds with leveraged ETFs like ZROZ (PIMCO 25+ Year Zero Coupon U.S. Treasury Index ETF) and EDV (Vanguard Extended Duration Treasury Index ETF) to gain on potential rate cuts. Nasdaq/Tech and growth sectors show strong long-term potential. Diversify with Russell 2000 ETFs and bank index ETFs. Election years historically boost market performance. Top Small-Cap ETFs Poised to Benefit: Vanguard Small-Cap Growth ETF (VBK), iShares Russell 2000 Growth ETF (IWO), iShares S&P Small-Cap 600 Growth ETF (IJT).
Strategic Investment Approaches
US Treasury Long Bond Opportunity
Small Cap Opportunities Fall 2024
In the NEWS
Central Banking, Monetary Policy & Economics:
- The Fed Isn’t First to Cut Rates, but It Is the Signal Other Central Banks Want – WSJ
- Powell Doesn’t See Signs of Recession Risk in US Economy – Bloomberg
Business:
- Nippon Steel Gets More Time for U.S. Steel Deal Review – WSJ
- Intuitive Machines Shares Soar on NASA Pact for Near-Space Grid – Bloomberg
- Sony Joins a Crypto Push in Japan as Calls Grow for Looser Rules – Bloomberg
China:
- Hong Kong cuts base rate by half point in lockstep with US Fed’s aggressive bid on economy – SCMP


