Stay Informed and Stay Ahead: Market Watch, October 14th, 2024.
Early-Week Wall Street Markets
Key Takeaways
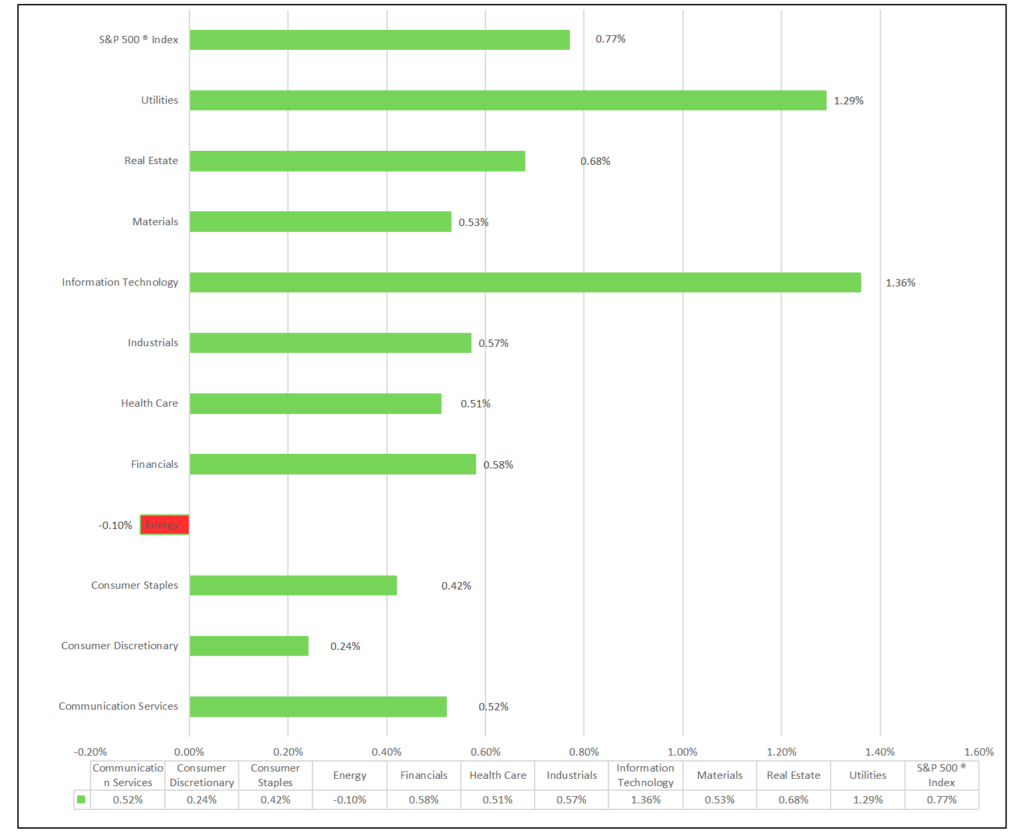
- Markets: DOW, S&P 500, and NASDAQ all rise. 10 of 11 sectors gain, Information Technology leads, Energy lags. Top industry: Independent Power & Renewable Electricity Producers.
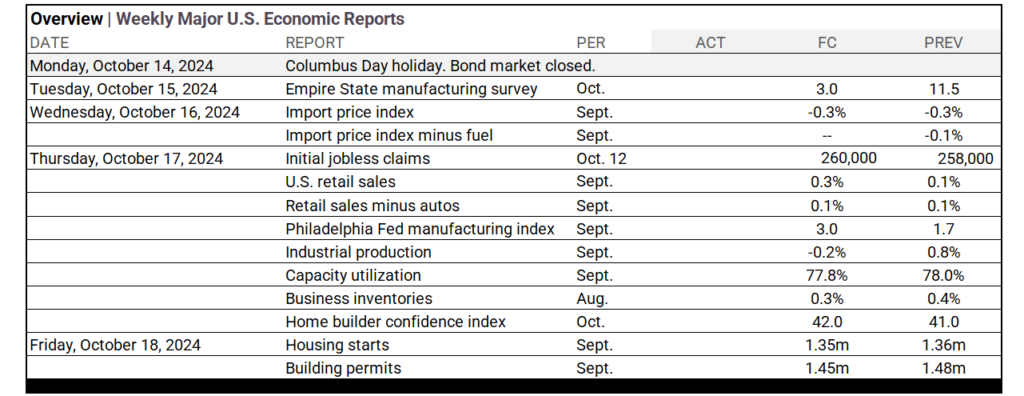
- Economics: Columbus Day holiday; bond market closed. Thursday features initial jobless claims and U.S. retail sales data.
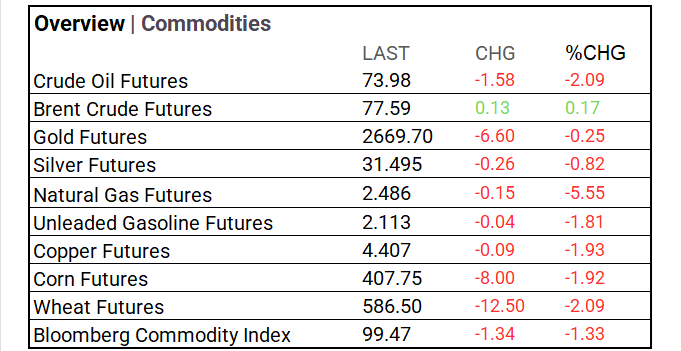
- Yields & Commodities: The bond market was closed today, leaving Treasury yields The yield curve shows a positive spread between the 10-year and 2-year notes, while the 10-year and 3-month bills reflect an inverted spread, indicating market uncertainty. Commodities showed mixed results, with energy and agricultural sectors underperforming. Crude oil futures fell, while Brent crude rose slightly. Gold and silver futures decreased, and natural gas dropped. This trend highlights market uncertainties regarding demand dynamics, as seen in the decline of the Bloomberg Commodity Index.
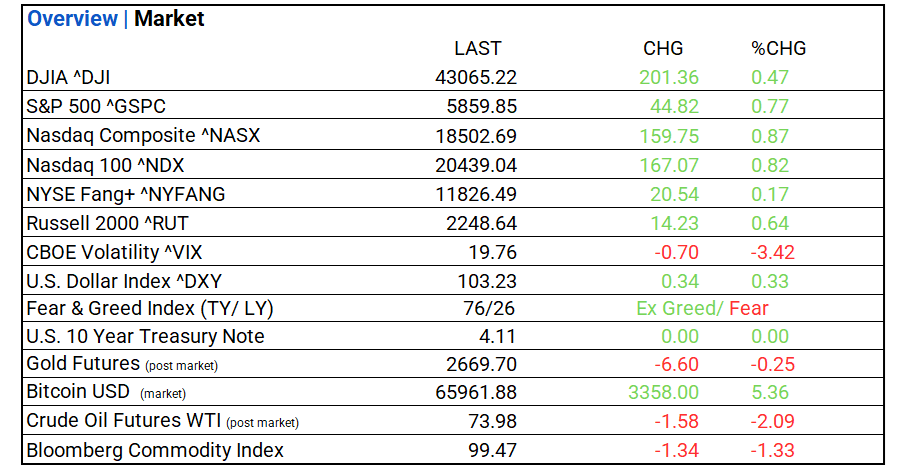
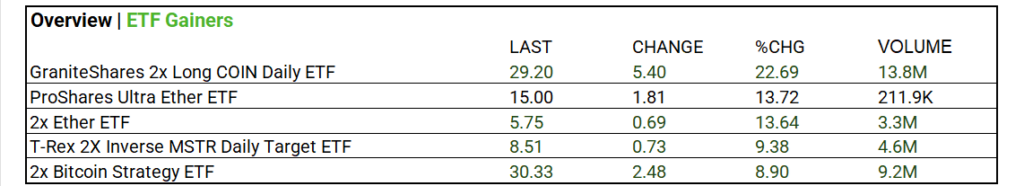
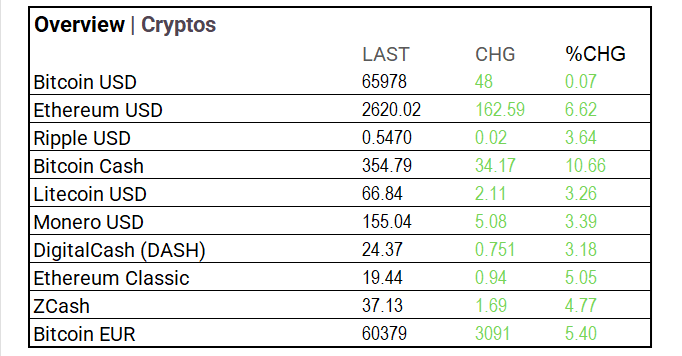
- Crypto & ETFs: Cryptocurrencies experienced a significant increase today, with Bitcoin trading at $65,961.88, up $3,358.00 (5.36%). Ethereum rose 6.62% to $2,620.02, reflecting strong interest in altcoins. ETFs also saw momentum, particularly the GraniteShares 2x Long COIN Daily ETF, which rallied 22.69% to $29.20 on 13.8M shares traded. This bullish trend indicates growing investor confidence in Bitcoin and Ethereum amid positive market developments.
- Market Tips: Stay the course and stick with long-duration bonds and consider adding leading mortgage refinancing companies like Rocket and SOFI, as Q4 rate cuts are expected to continue. Maintain long positions in Ai (read-up on our top CAGR’S report) ,diversify with Russell 2000 ETFs.
- Rate Cuts: Inflation data remains uneven, but fundamentals indicate a disinflationary trend. September’s headline CPI was 2.4%, the lowest since 2021, while producer price inflation has returned to pre-COVID levels, easing concerns of reacceleration. Employment conditions are balanced, supporting the Federal Reserve’s stance. Policymakers are not overly concerned with recent inflationary fluctuations and are expected to maintain a gradual easing path.
Market Summary
Indices & Sectors Performance:
- DOW, S&P 500, and NASDAQ rise. 10 of 11 sectors gain, Information Technology leads, Energy lags. Industry Leaders: Independent Power & Renewable Electricity Producers (+4.51%), Passenger Airlines (+2.24%), Semiconductor & Semiconductor Equipment (+1.96%), and Health Care REITs (+1.76%).
Technical:
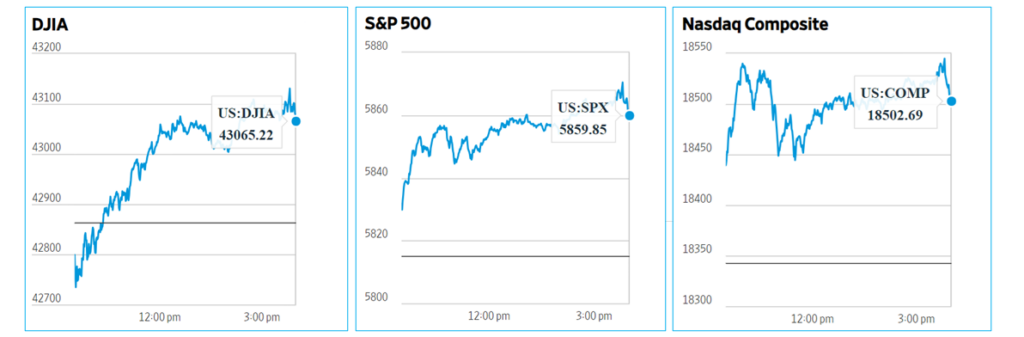
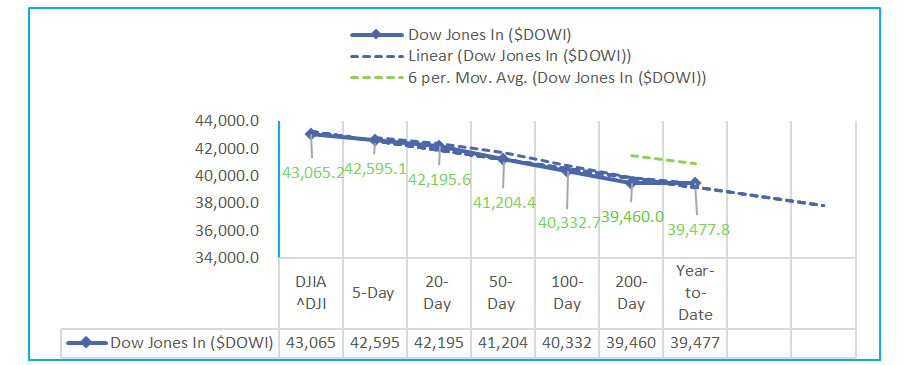
- The Dow Jones Industrial Average continues its upward trajectory, trading above key moving averages with positive price changes across all timeframes, from the 5-day (+2.65%) to the 200-day (+14.36%). The index’s 20-day Stochastic %K is at 93.82%, indicating overbought conditions, though buying interest remains strong. The MACD oscillator remains positive, especially over the 50-day (1,590.04), suggesting robust upward momentum. While elevated Stochastic levels could signal short-term consolidation, the broader uptrend appears well-supported by stable average true range (ATR) values and relatively low historical volatility, reflecting sustained market strength.
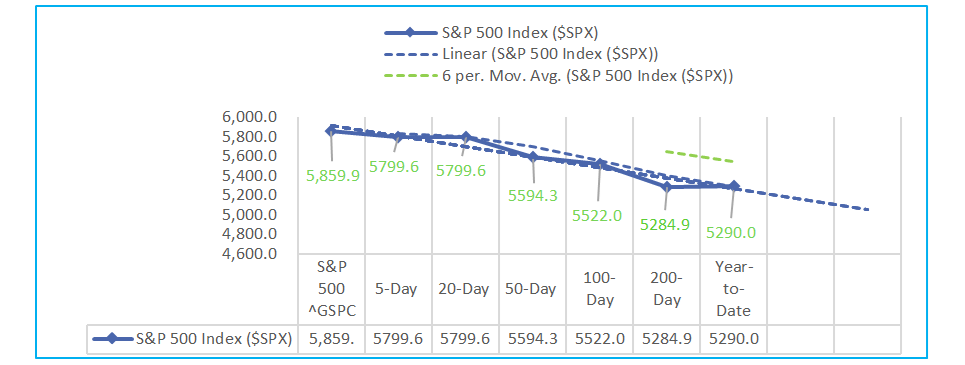
- The S&P 500 (SPX) shows solid bullish momentum, trading above all major moving averages with gains ranging from +2.88% over the 5-day period to +22.55% over the 200-day period. The 20-day Stochastic %K stands at 94.55%, suggesting overbought conditions but indicating strong buying pressure. The MACD oscillator remains positive, especially over the 50-day (223.99), reflecting continued upward momentum. While the elevated Stochastic readings could lead to potential short-term consolidation, the broader uptrend remains intact, supported by a stable average true range (ATR) and moderate historic volatility, signaling sustained market strength.
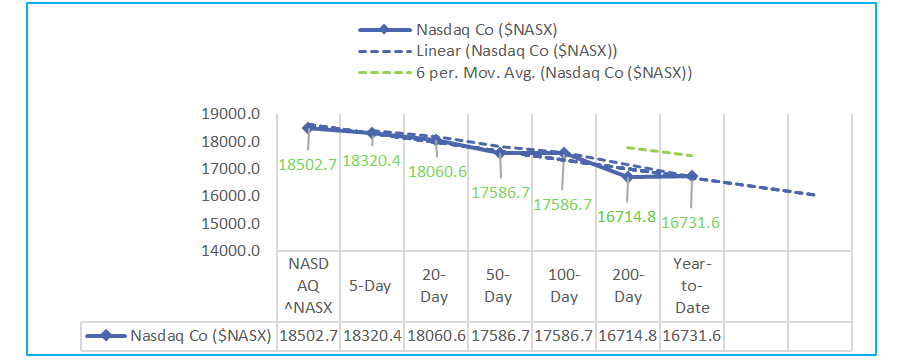
- The Nasdaq Composite (NASX) demonstrates strong bullish momentum, trading above all key moving averages, with price increases across timeframes from +3.23% over the 5-day period to +22.54% over the 200-day period. The 20-day Stochastic %K is at 95.28%, indicating overbought conditions but reflecting persistent buying interest. The MACD oscillator is positive, particularly over the 50-day (789.21), highlighting robust upward momentum. Although high Stochastic levels may suggest short-term consolidation, the overall uptrend remains solid, supported by a consistent average true range (ATR) and higher historic volatility, signaling sustained strength in the market.
Sectors:
- Over the past month, the S&P 500 gained +5.81%, driven by strong performance in key sectors like Energy (+10.02%), Communication Services (+9.92%), and Information Technology (+9.48%). The Industrials sector also saw notable gains at +8.26%, reflecting economic optimism. In contrast, the Real Estate (-3.20%) and Consumer Staples (-2.11%) sectors underperformed, facing downward pressure. Overall, the market’s strength was bolstered by tech and energy gains, while more defensive sectors lagged.
Economic Highlights:
- Columbus Day holiday. Bond market closed.
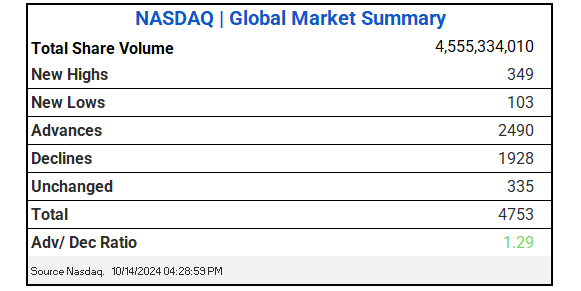
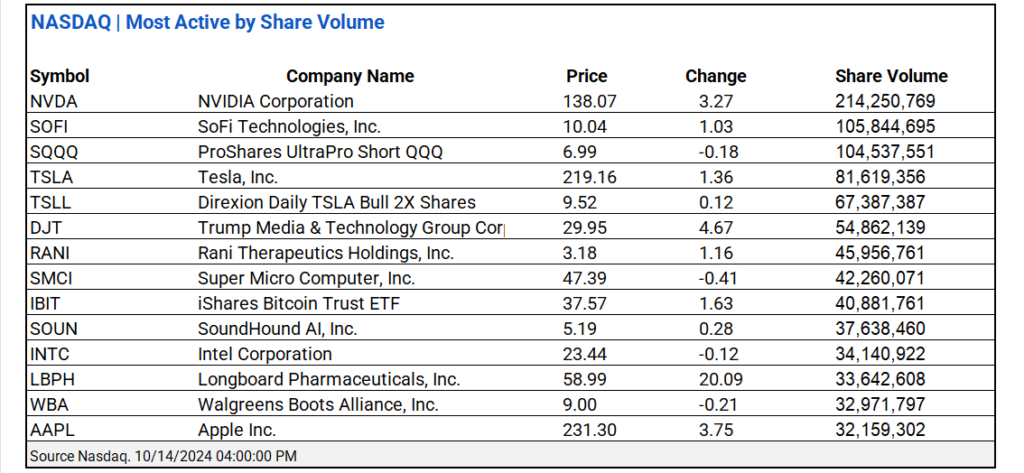
NASDAQ Global Market Update:
- NASDAQ saw 4.55B shares traded with a 1.29 advance/decline ratio. NVIDIA ^NVDA and SoFi Technologies, Inc. ^ SOFI led share volume actives.
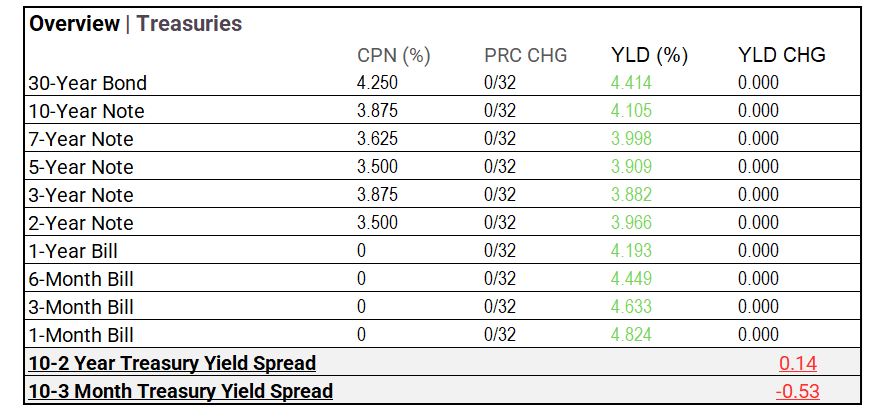
US Treasuries & Bond Markets:
- US Treasuries: The bond market was closed today, keeping Treasury yields unchanged across all maturities. With yields stable, attention remains on the yield curve’s shape, featuring a slightly positive spread between the 10-year and 2-year notes, while the 10-year and 3-month bills continue to show an inverted spread.
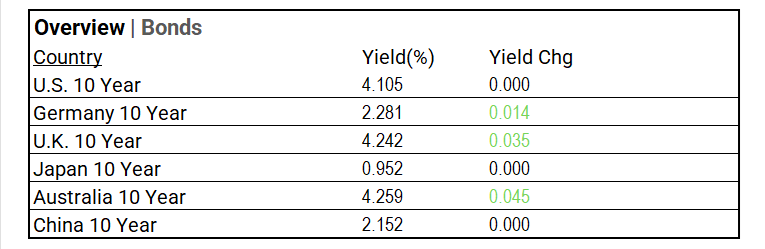
- Global bonds: Global bond markets experienced mixed movements today, with the U.S. bond market closed, leaving the 10-year Treasury yield unchanged at 4.105%. In Europe, Germany’s 10-year yield edged up by 1.4 basis points to 2.281%, while the U.K.’s 10-year yield rose by 3.5 basis points to 4.242%. In Asia-Pacific, Japan’s 10-year yield remained steady at 0.952%, while Australia’s 10-year yield increased by 4.5 basis points to 4.259%. China’s 10-year yield also stayed unchanged at 2.152%. The shifts highlight regional market dynamics amid a stable U.S. backdrop.
Market Factors:
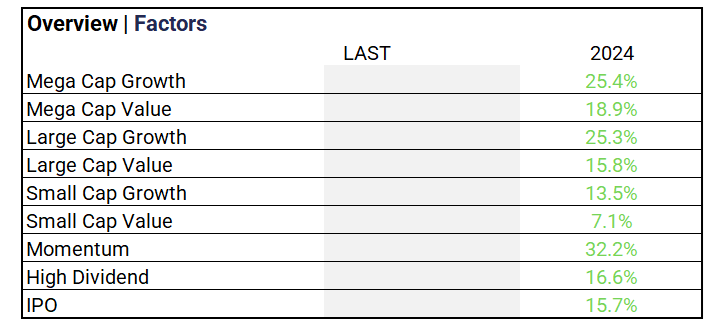
- Market Factors: Year-to-date performance across different equity factors shows significant variation, with Momentum leading at +32.2%. Mega Cap Growth closely follows with a +25.4% gain, while Large Cap Growth is up +25.3%. Mega Cap Value and Large Cap Value have returned +18.9% and +15.8%, respectively. High Dividend stocks gained +16.6%, while IPO stocks are up +15.7%. Small Cap Growth stocks have advanced by +13.5%, whereas Small Cap Value stocks lag behind with a +7.1% increase. The results reflect strong gains in growth-oriented and momentum-driven sectors in 2024.
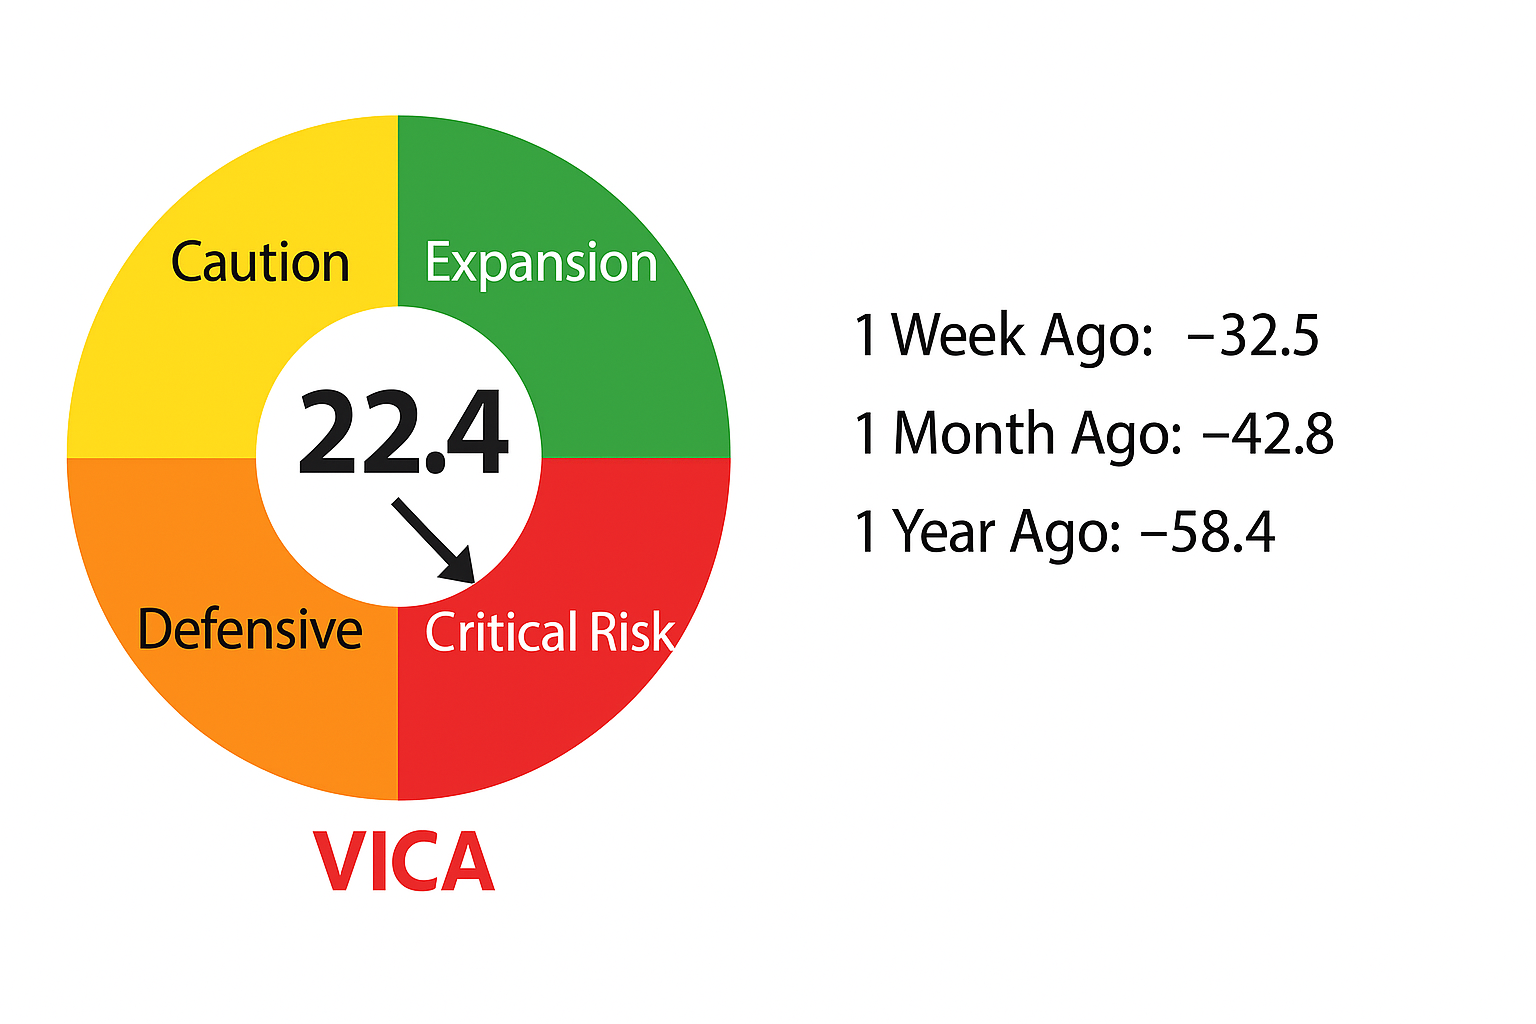
Volatility:
- The CBOE Volatility Index (VIX) indicates a significant upward trend in volatility year-to-date, increasing by 58.23% and reaching 15.26. Despite a recent 12.99% drop in the 5-day moving average to 20.67, longer-term averages show substantial increases, particularly a 66.10% rise in the 100-day moving average. A big picture trend suggests heightened market uncertainty and investor apprehension, reflected in the elevated volatility levels. This could be attributed to ongoing economic concerns, shifts in monetary policy, and geopolitical tensions, which typically drive fluctuations in investor sentiment and market activity. Overall, while short-term volatility has decreased, the long-term trend suggests that investors remain wary, anticipating potential market disruptions ahead.
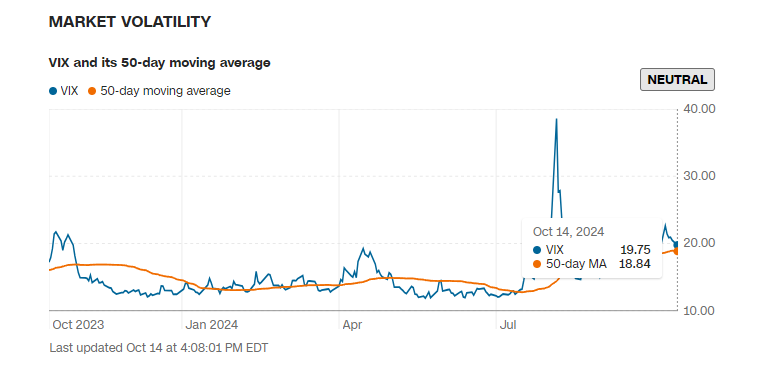
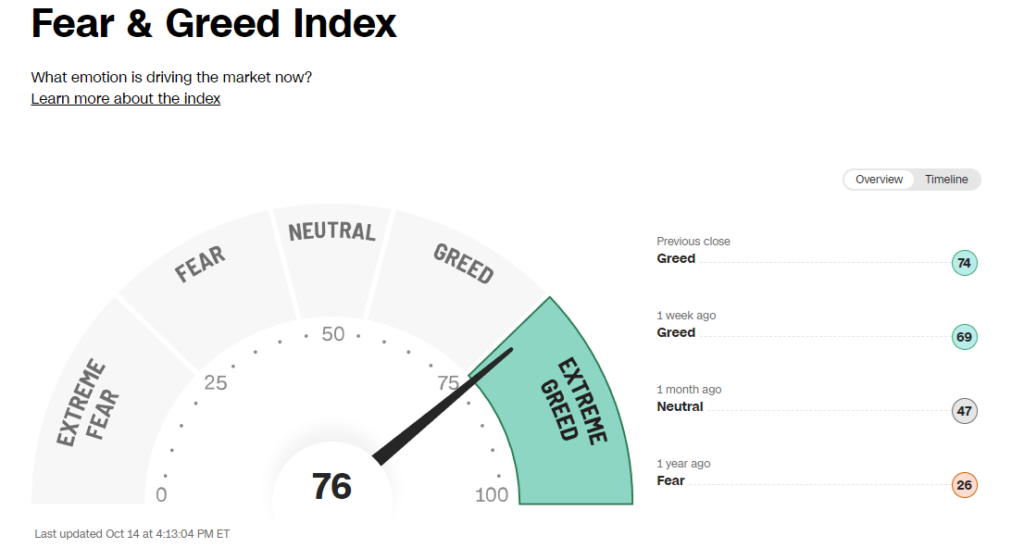
- The Fear & Greed Index registers “Ex Greed”, Volatility Index “Neutral”.
Commodities & ETFs:
- Commodity markets: showed mixed results, with energy and agricultural commodities lagging. Crude oil futures fell 2.09% to $73.98, while Brent crude rose slightly by 0.17% to $77.59. Gold futures decreased 0.25% to $2,669.70, and silver fell 0.82% to $31.495. Natural gas plummeted 5.55% to $2.486, with corn and wheat futures dropping 1.92% and 2.09%, respectively. The Bloomberg Commodity Index declined 1.33% to 99.47, indicating broader weakness in the sector amid demand concerns.
- ETF volume gainers: showed strong momentum in the crypto space, led by the GraniteShares 2x Long COIN Daily ETF, which rallied 22.69% to $29.20 on 13.8M shares traded. The 2x Ether ETF rose 13.64% to $5.75, with a volume of 3.3M shares, reflecting a growing interest in Ethereum-related investments. Additionally, the T-Rex 2X Inverse MSTR Daily Target ETF gained 9.38% to $8.51 on 4.6M shares, while the 2x Bitcoin Strategy ETF increased 8.90% to $30.33 with 9.2M shares exchanged. This focus on crypto ETFs highlights the market’s renewed enthusiasm for digital assets.
Cryptocurrency & Currency:
- Cryptocurrency: The cryptocurrency market with a significant jump today, with Bitcoin USD trading at $65,961.88, up $3,358.00 or 5.36% during the session. Ethereum is also performing well, rising 6.62% to $2,620.02, showcasing strong interest in altcoins. Bitcoin Cash has seen a notable increase of 10.66%, now at $354.79. In post-market trading, Bitcoin remains volatile but retains its upward momentum, while Ethereum continues to hold its gains. This overall bullish trend reflects growing investor confidence, particularly in Bitcoin and Ethereum, as the market responds positively to current developments.
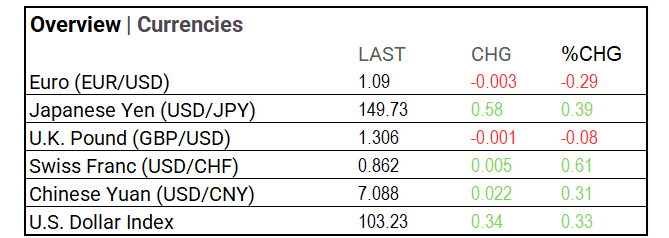
- Currencies: The currency market showed mixed results today. The Euro (EUR/USD) declined by 0.29% to 1.09, while the U.K. Pound (GBP/USD) fell slightly by 0.08% to 1.306. In contrast, the Japanese Yen (USD/JPY) appreciated by 0.39% to 149.73. The Swiss Franc (USD/CHF) gained 0.61%, reaching 0.862. The Chinese Yuan (USD/CNY) rose 0.31% to 7.088, and the U.S. Dollar Index increased by 0.33% to 103.23, reflecting overall strength in the dollar against major currencies.
Stocks:
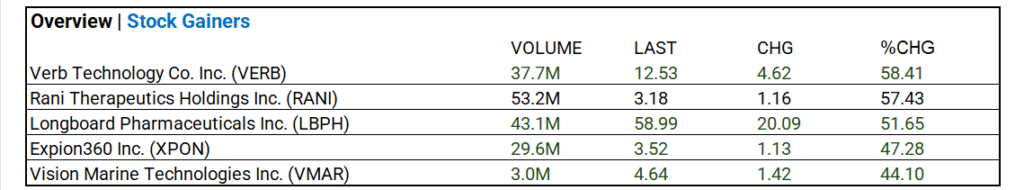
- Stock Advancers: Substantial gains in Verb Technology, Rani Therapeutics, Longboard Pharmaceuticals, and Expion360. This reflects heightened investor interest in smaller-cap, high-growth companies. The significant trading volume indicates robust activity and confidence, highlighting overall market optimism, especially in technology and healthcare sectors.
Notable Weekly Earnings:
- Up this Week; UnitedHealth (UNH), J&J (JNJ), Louis Vuitton ADR (LVMUY), Bank of America (BAC), Goldman Sachs (GS), Progressive (PGR), Citigroup (C), Charles Schwab (SCHW), Rio Tinto ADR (RIO), ASML ADR (ASML), Abbott Labs (ABT), Morgan Stanley (MS), BHP Group Ltd ADR (BHP), Lam Research (LRCX), Taiwan Semiconductor (TSM), Netflix (NFLX), Nestle ADR (NSRGY), Blackstone (BX), Elevance Health (ELV), P&G (PG), American Express (AXP), and Schlumberger (SLB).
Global Markets Summary:
- Leader: Shanghai Composite (China), up 2.07% to 3,284.32, indicating positive momentum. Loser: Hang Seng (Hong Kong), down 0.75% to 21,092.87, reflecting regional concerns. The Nikkei 225 (Japan) rose 0.57% to 39,605.80, showing market confidence. European markets also saw gains, with the CAC 40 (France) up 0.32% to 7,602.06, the DAX (Germany) increasing 0.69% to 19,508.29, and the FTSE 100 (UK) rising 0.47% to 8,292.66, highlighting resilience amid ongoing volatility.

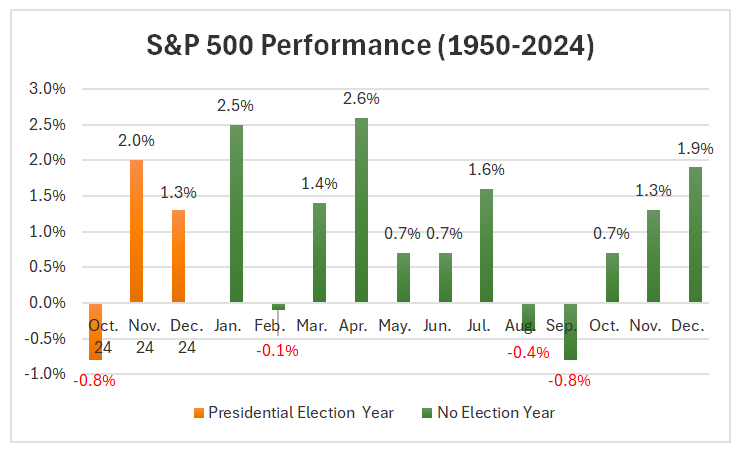
Historical Patterns and Market Impact October
- October: Based on S&P 500 historical data sets, the forecast is set to decline -0.8%, reflecting typical election-related volatility. However, over the past decade, October has averaged a gain of 1.6%, with a return of 2.4% in the last five years. Overall, the last quarter of 2024 suggests a net positive performance from November through December, effectively offsetting October’s losses and positioning the market for a strong year-end finish.
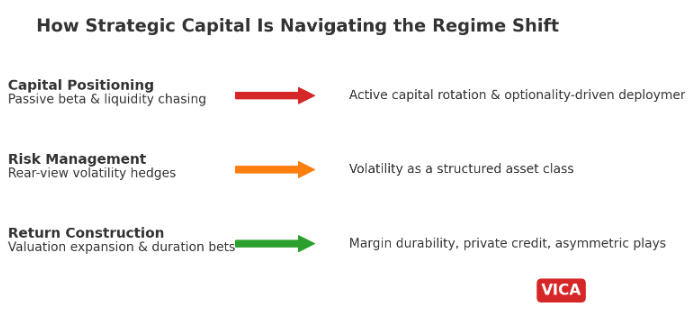
Strategic Investment Adjustments:
- Focus on long-duration bonds using leveraged ETFs like ZROZ (PIMCO 25+ Year Zero Coupon U.S. Treasury Index ETF) and EDV (Vanguard Extended Duration Treasury Index ETF) to capitalize on potential rate cuts. Nasdaq, tech, AI, and semiconductors show strong long-term potential. Diversify with Russell 2000 ETFs and bank index ETFs, as election years typically enhance market performance. Top Small-Cap ETFs to consider: Vanguard Small-Cap Growth ETF (VBK), iShares Russell 2000 Growth ETF (IWO), and iShares S&P Small-Cap 600 Growth ETF (IJT).
Strategic Investment Approaches
US Treasury Long Bond Opportunity
Small Cap Opportunities Fall 2024
Top 10 Fastest-Growing Technology Sectors Through 2028
In the NEWS
Central Banking, Monetary Policy & Economics:
- Singapore’s Central Bank Holds Steady as Economy Picks Up, Inflation Cools – WSJ
- Euro Zone’s Cooling Jobs Market Feeds Calls for Faster ECB Cuts – Bloomberg
Business:
- Coty Joins Competitors in Warning of Beauty Sales Slowdown – WSJ
- VW, BMW and Mercedes Are Getting Left in the Dust by China’s EVs – Bloomberg
China:
- Can China find a way around US restrictions on hi-tech computer chips? – SCMP