
“Empowering Your Financial Success”
Daily Market Insights: September 29th, 2023
Global Markets Summary:
Asian Markets:
- Hang Seng (Hong Kong): +2.59%
- Shanghai Composite (China): +0.13%
- Nikkei 225 (Japan): -0.05%
US Futures:
- S&P Futures: opened @ 4328.18 (+0.66%)
European Markets:
- Germany’s DAX: +0.70%
- France’s CAC 40: +0.63%
- London’s FTSE 100: +0.13%
US Market Snapshot:
Key Stock Market Indices:
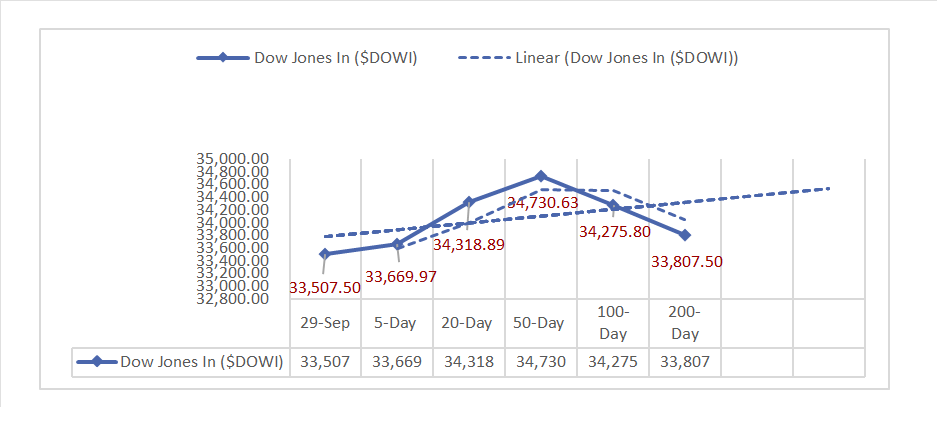
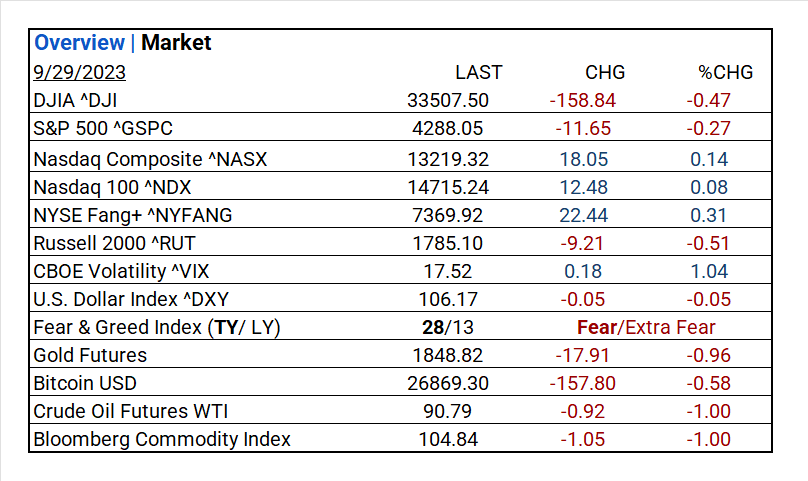
- DJIA ^DJI: 33,507.50 (-158.84, -0.47%)
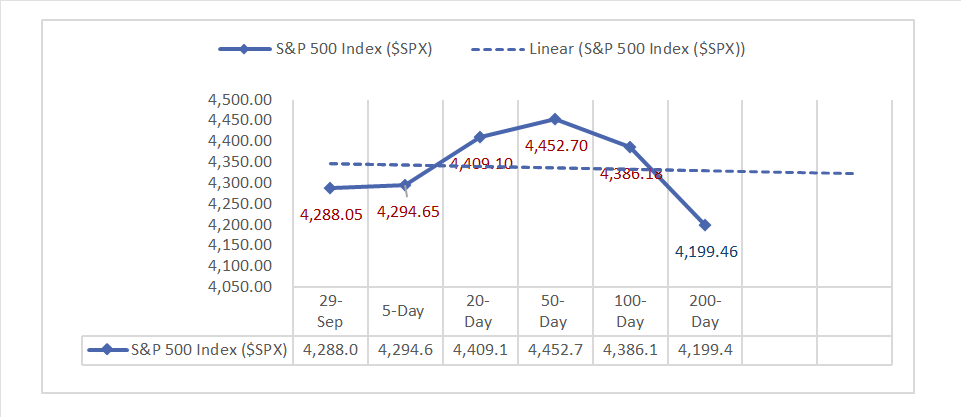
- S&P 500 ^GSPC: 4,288.05 (-11.65, -0.27%)
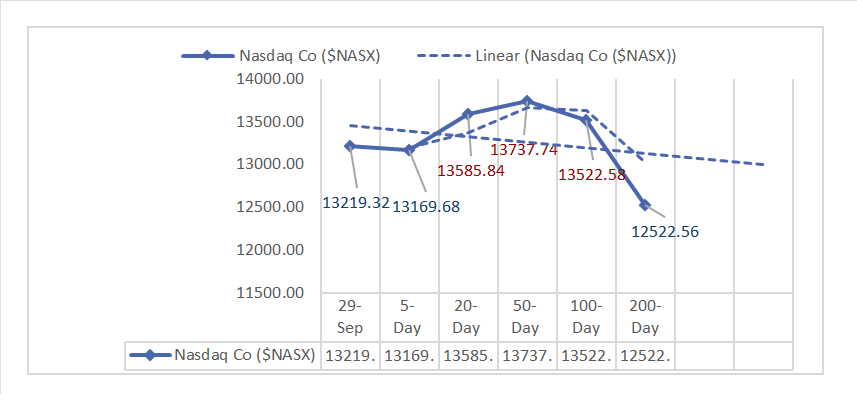
- Nasdaq Composite ^NASX: 13,219.32 (18.05, 0.14%)
- Nasdaq 100 ^NDX: 14,715.24 (12.48, 0.08%)
- NYSE Fang+ ^NYFANG: 7,369.92 (22.44, 0.31%)
- Russell 2000 ^RUT: 1,785.10 (-9.21, -0.51%)
Market Insights: Performance, Sectors, and Trends:
- Economic Data: Personal Income and Personal Spending meet consensus expectations, while PCE and Core-PCE inflation show stability. The U.S. Trade Balance in Goods improves, and Retail and Wholesale Inventories see divergent trends. This data paints a mixed economic picture with stable consumer activity but varying inflation and trade balance performance.
- Market Indices: The Nasdaq Composite led the way with gains, while the DJIA and S&P 500 experienced slight declines. The NYSE Fang+ also saw an increase, and the Russell 2000 experienced a slight decrease on the day.
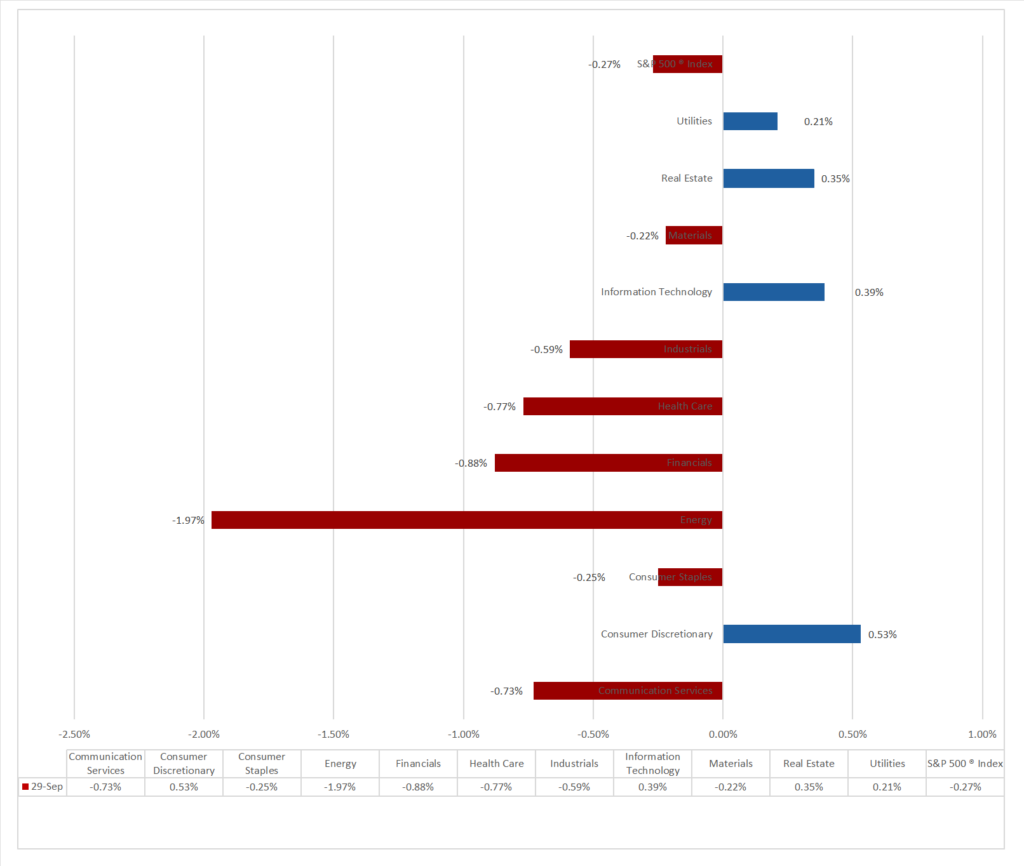
- Sector Performance: 7 of 11 sectors declined, Consumer Discretionary outperformed (+0.53%), while Energy (-1.97%) lagged. Top Industry: Textiles, Apparel & Luxury Goods (+6.21%).
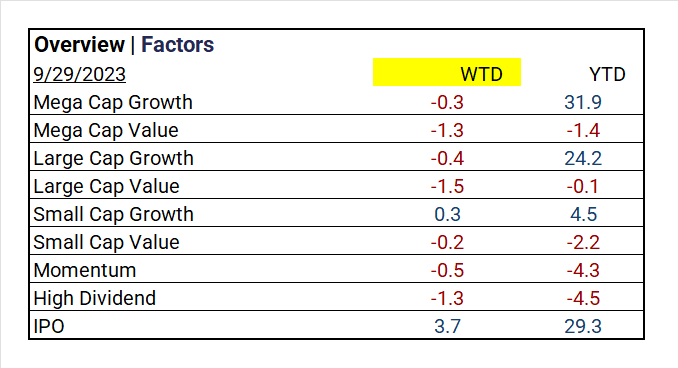
- Factors: IPOs (+3.7%) vastly outperformed for the week.
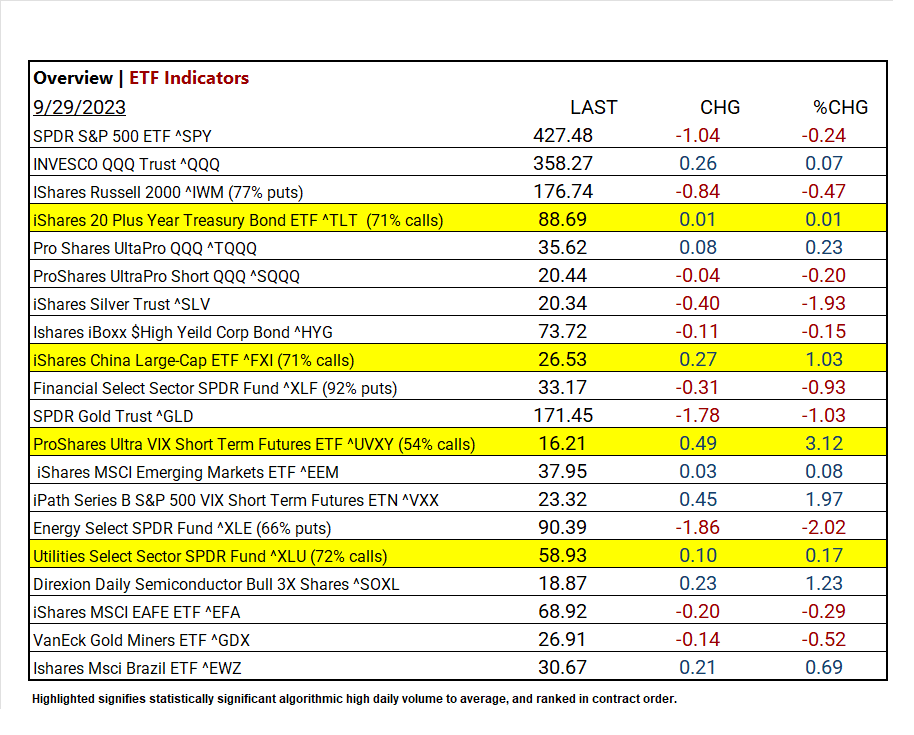
- Top ETF: ProShares Ultra VIX Short Term Futures ^UVXY +3.12%
- Worst ETF: Energy Select SPDR Fund ^XLE declined -2.02%
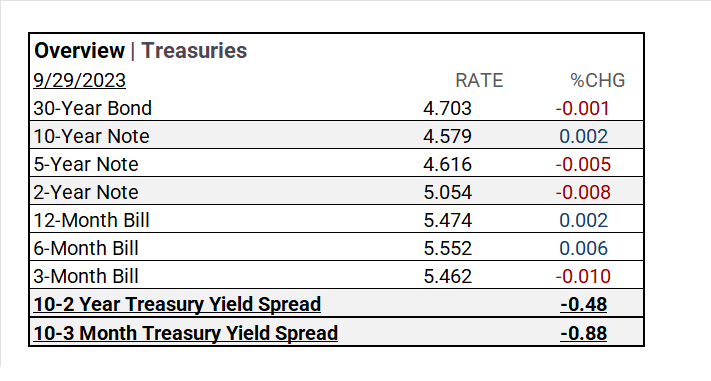
- Treasury Markets: The 30-Year Bond down, 10-Year Note up, 5-Year Note down, 2-Year Note down. Short-term bills mixed; yield spreads tightened.
- Currency and Volatility: The U.S. Dollar Index declined, CBOE Volatility increased, and the Fear & Greed Index showed a slight decline signaling fear.
- Commodity Markets: Gold Futures and Bitcoin declined, Crude Oil Futures WTI retreated, and the Bloomberg Commodity Index fell.
Sectors:
- 7 of 11 sectors declined, Consumer Discretionary outperformed (+0.53%), while Energy (-1.97%) lagged. Top Industry: Textiles, Apparel & Luxury Goods (+6.21%), Independent Power and Renewable Electricity Producers (+2.15%).
Treasury Yields and Currency:
- In Treasury markets, the 30-Year Bond yield decreased slightly, while the 10-Year Note yield increased marginally. The 5-Year Note yield declined, and the 2-Year Note yield decreased. Short-term bills saw mixed changes, with the 12-Month Bill increasing and the 6-Month Bill and 3-Month Bill showing slight decreases. Yield spreads tightened during this period.
- The U.S. Dollar Index ^DXY: 106.17 (-0.05, -0.05%)
Market Volatility and Sentiment:
- CBOE Volatility ^VIX: 17.52 (+0.18, +1.04%)
- Fear & Greed Index (TY/LY): 28/13 (Fear/Extreme Fear).
source: CNN Fear and Greed Index
Commodities:
- Gold Futures: 1848.82 (-17.91, -0.96%)
- Bitcoin USD: 26869.30 (-157.80, -0.58%)
- Crude Oil Futures WTI: 90.79 (-0.92, -1.00%)
- Bloomberg Commodity Index: 104.84 (-1.05, -1.00%)
Factors:
- Week to-date, IPOs led (+3.7%) followed by Small Cap Growth (+0.3%)
ETF Performance:
Top 3 Best Performers:
- ProShares Ultra VIX Short Term Futures ETF ^UVXY (54% calls) +3.12%
- iPath Series B S&P 500 VIX Short Term Futures ETN ^VXX +1.97%
- Direxion Daily Semiconductor Bull 3X Shares ^SOXL +1.23%
Top 3 Worst Performers:
- Energy Select SPDR Fund ^XLE (66% puts) -2.02%
- iShares Silver Trust ^SLV -1.93%
- SPDR Gold Trust ^GLD -1.03%
US Economic Data
August
- Personal Income: 0.4% (Actual) vs. 0.4% (Consensus) | 0.2% (Previous)
- Personal Spending: 0.4% (Actual) vs. 0.45% (Consensus)
- PCE (Personal Consumption Expenditures) Inflation: Monthly Change: 0.4% (Actual) vs. 0.5% (Consensus) | 0.2% (Previous) Yearly Change: 3.5% (Actual) vs. 3.5% (Consensus) | 3.3% (Previous)
- Core-PCE (Core Personal Consumption Expenditures) Inflation: Monthly Change: 0.1% (Actual) vs. 0.2% (Consensus) | 0.2% (Previous) Yearly Change: 3.9% (Actual) vs. 3.9% (Consensus) | 4.2% (Previous).
- Advanced U.S. Trade Balance in Goods: -$84.3Bm (Actual) | -$90.9B (Previous)
- Advanced Retail Inventories: 1.1% (Actual) | 0.2% (Previous)
- Advanced Wholesale Inventories: -0.1% (Actual) | -0.2% (Previous)
September
- Chicago Business Barometer: 44.1 (Actual) vs.47.0 (Consensus) | 48.7 (Previous)
- Consumer Sentiment (Final): 68.1 (Actual) vs.67.7 (Consensus) | 67.7 (Previous)
Earnings:
- Q1 ’23: 79% of companies beat analyst estimates.
- Q2 Forecast/Actual: Predicted <7.2%> FY 2023 S&P 500 EPS decline; FY 2023 EPS flat YoY. By 7-28, 51% reported Q2 2023, results; 80% beat EPS estimates, above 5-year (77%) and 10-year (73%) averages. Earnings exceeded estimates by 5.9%, slightly below the 5-year (8.4%) and 10-year (6.4%) averages.
- Q3 Forecast: S&P 500 to see -0.2% YoY earnings decline, marking 4th consecutive drop. S&P 500’s 12-month P/E ratio is 18.0, below 5-year (18.7%) average but above 10-year (17.5%) average. 74 S&P 500 firms gave negative EPS guidance, 42 exceeded expectations with positive guidance.
Notable Earnings Today:
- Beat: Carnival Corp (CCL)
- Miss:
Resources:
News
Investment and Growth News
- SoftBank-Backed Lululemon Rival Vuori Said to Plan IPO Next Year – Bloomberg
- Apple’s Latest China Challenge: A Crackdown That Could Shrink Its App Store – WSJ
- Tesla’s Streak of Record Deliveries Hits Third-Quarter Roadblock – Bloomberg
Infrastructure and Energy
- Biden to Offer Smallest-Ever Offshore Oil Rights Sale Plan – Bloomberg
- China’s Grip on Critical Minerals Draws Warnings at IEA Gathering – Bloomberg
Real Estate Market Updates
- About Four in Ten US Homeowners Are Mortgage Free. Are You One of Them? – Bloomberg
Central Banking and Monetary Policy
- Underlying Prices Cooled in August, Giving the Fed More Evidence of Softer Inflation – WSJ
- Once Unthinkable Bond Yields Are Now the New Normal for Markets – Bloomberg
- A Shutdown Poses Political Risks Across the Washington Spectrum – Bloomberg
International Market Analysis (China)
- China’s manufacturing expands for first time in 6 months in latest sign of stabilising economy – SCMP

