
“Empowering Your Financial Success”
Daily Market Insights: October 2nd, 2023
Global Markets Summary:
Asian Markets:
- Hang Seng (Hong Kong): +2.51%
- Shanghai Composite (China): +0.10%
- Nikkei 225 (Japan): -0.31%
US Futures:
- S&P Futures: opened @ 4284.52 (-0.08%)
European Markets:
- Germany’s DAX: -0.91%
- France’s CAC 40: -0.94%
- London’s FTSE 100: -1.31%
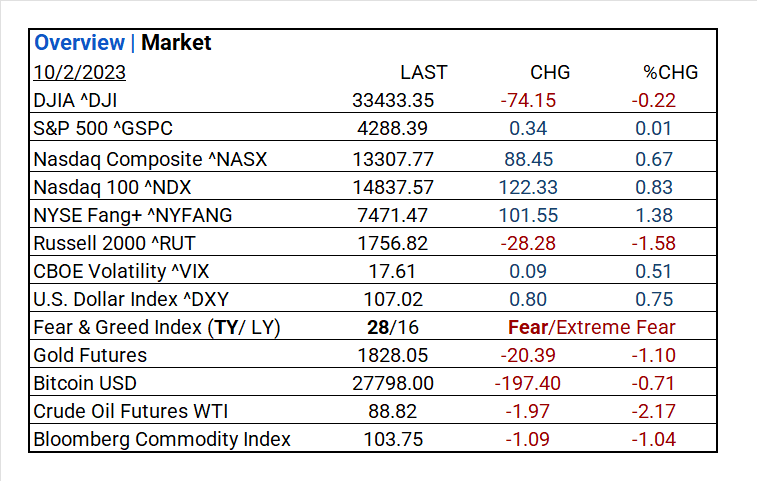
US Market Snapshot:
Key Stock Market Indices:
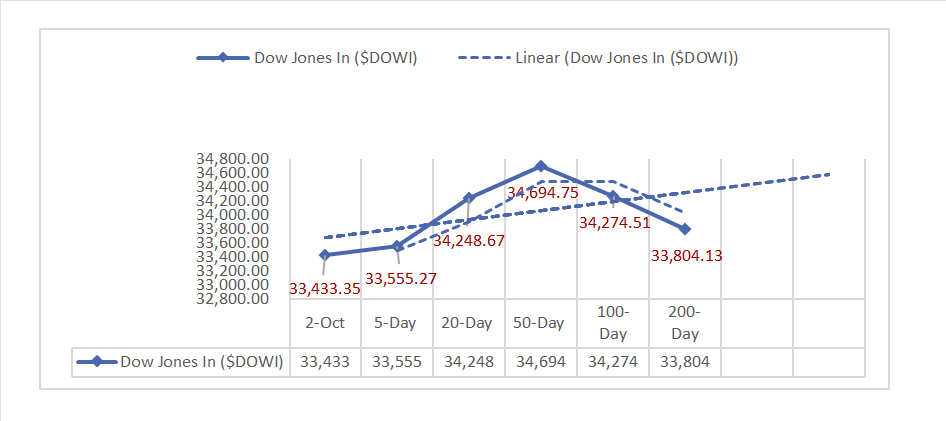
- DJIA ^DJI: 33,433.35 (-74.15, -0.22%)
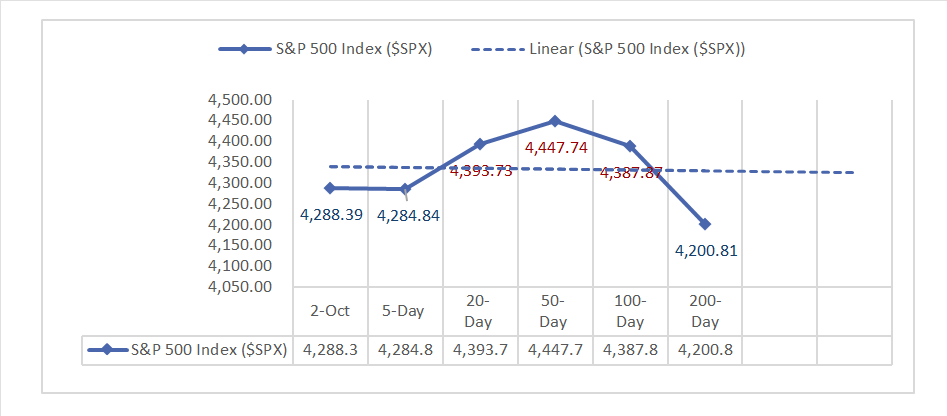
- S&P 500 ^GSPC: 4,288.39 (+0.34, 0.01%)
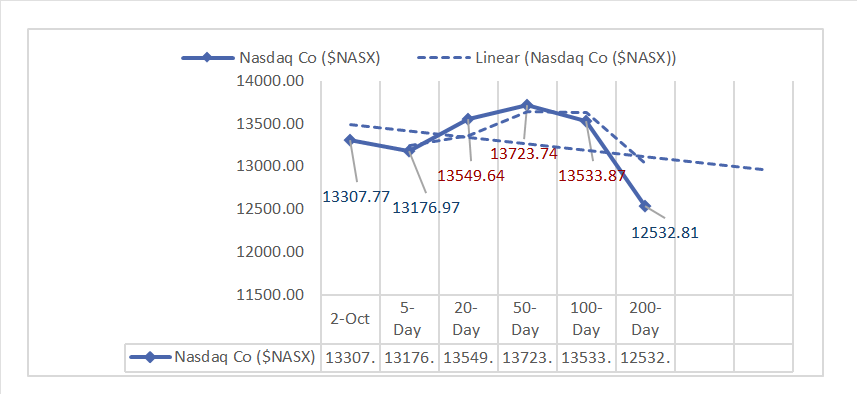
- Nasdaq Composite ^NASX: 13,307.77 (+88.45, 0.67%)
- Nasdaq 100 ^NDX: 14,837.57 (+122.33, 0.83%)
- NYSE Fang+ ^NYFANG: 7,471.47 (+101.55, 1.38%)
- Russell 2000 ^RUT: 1,756.82 (-28.28, -1.58%)
Market Insights: Performance, Sectors, and Trends:
- Economic Data: In August, construction spending was 0.5%, slightly below the consensus of 0.6% and lower than the previous 0.9%, while in September, the final manufacturing PMI rose to 49.8 from the previous 48.9, and the ISM manufacturing index exceeded expectations at 49.0, surpassing the consensus of 48.0 and the previous 47.6.
- Market Indices: The Nasdaq Composite gained 0.67%, S&P 500 rose slightly, DJIA declined, NYSE Fang+ increased by 1.38%, and the Russell 2000 fell by -1.58%.
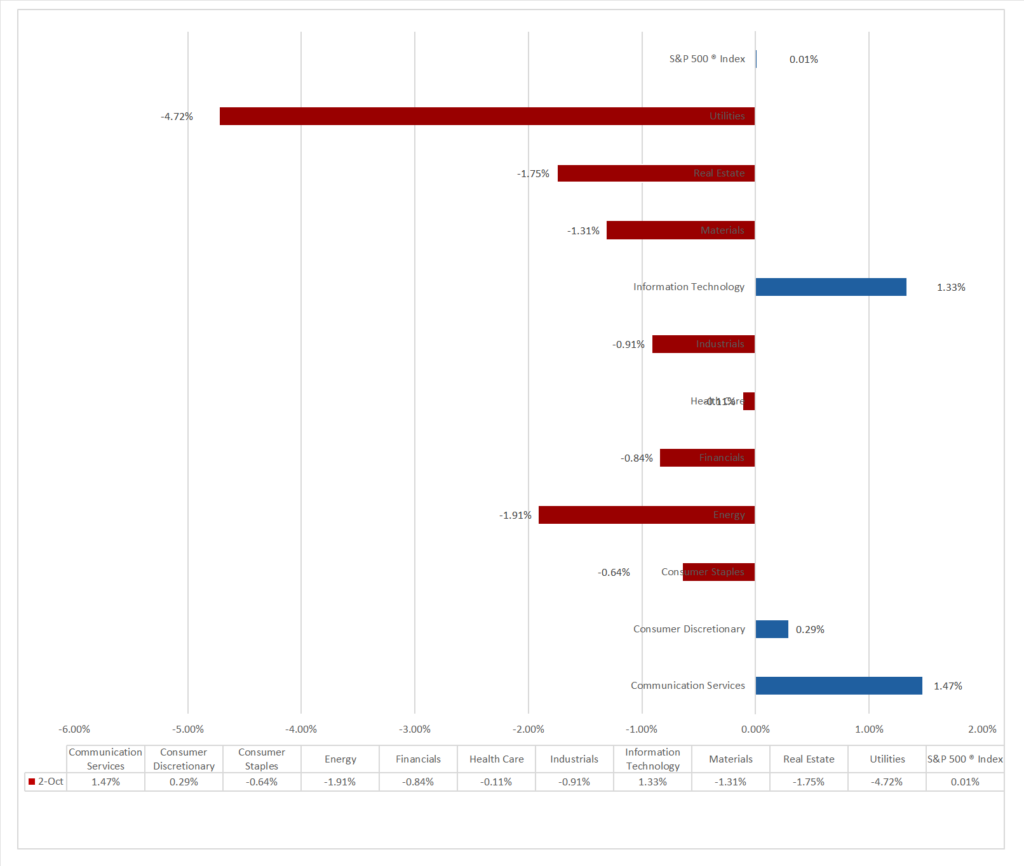
- Sector Performance: 8 of 11 sectors declined, Communication Services outperformed (+1.47%), while Utilities (-4.72%) lagged. Top Industry: Interactive Media & Services (+2.39%).
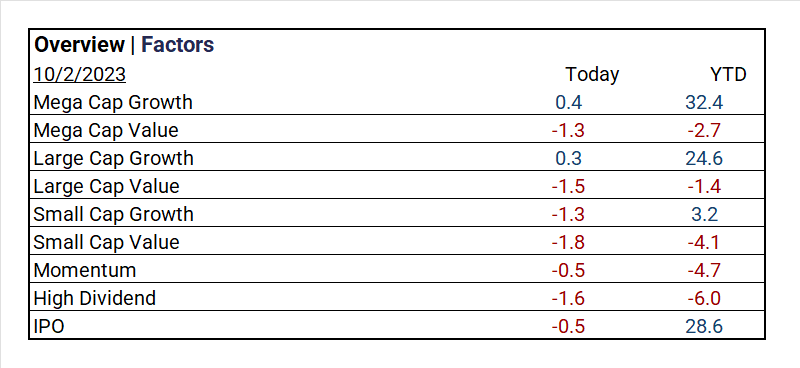
- Factors: Growth led over Value.
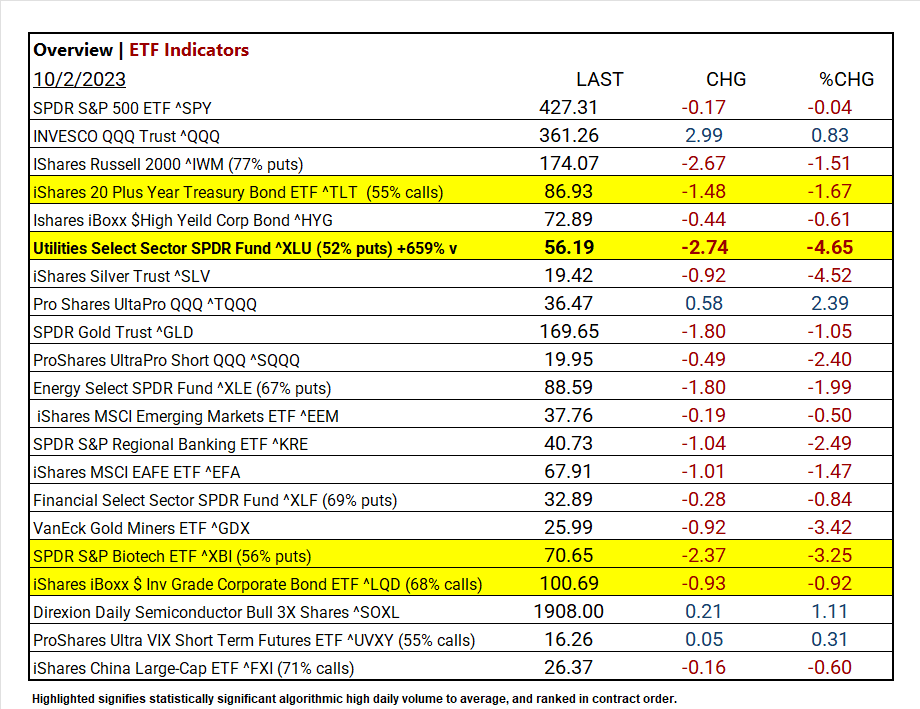
- Top ETF: Pro Shares UltaPro QQQ ^TQQQ +2.39%
- Worst ETF: Utilities Select Sector SPDR Fund ^XLU -4.65%
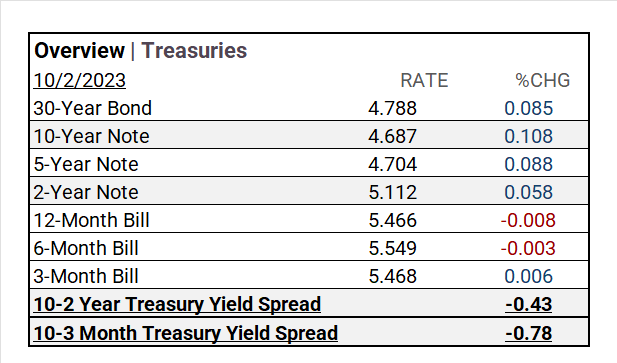
- Treasury Markets: Long-term bond yields increased, with 30-Year Bond at 4.788% and 10-Year Note at 4.687%. Short-term bills showed mixed changes.
- Currency and Volatility: The U.S. Dollar Index rose, CBOE Volatility increased, and the Fear & Greed Index continues signaling fear.
- Commodity Markets: Gold Futures and Bitcoin declined, Crude Oil Futures WTI retreated, and the Bloomberg Commodity Index fell.
Sectors:
- 8 of 11 sectors declined, Communication Services outperformed (+1.47%), while Utilities (-4.72%) lagged. Top Industry: Interactive Media & Services (+2.39%), Broadline Retail (+1.77%) and Software (+1.52%).
Treasury Yields and Currency:
- In Treasury markets, long-term bond yields increased, with the 30-Year Bond up to 4.788% and the 10-Year Note at 4.687%. Short-term bills had mixed changes, with the 12-Month Bill decreasing to 5.466% and the 6-Month Bill to 5.549%. The 3-Month Bill increased to 5.468%. Yield spreads tightened, with the 10-2 Year Treasury Yield Spread narrowing by -0.43 and the 10-3 Month Treasury Yield Spread decreasing by -0.78.
- The U.S. Dollar Index ^DXY: 107.02 (+0.80, +0.75%)
Market Volatility and Sentiment:
- CBOE Volatility ^VIX: 17.61 (+0.09, +0.51%)
- Fear & Greed Index (TY/LY): 28/16 (Fear/Extreme Fear).
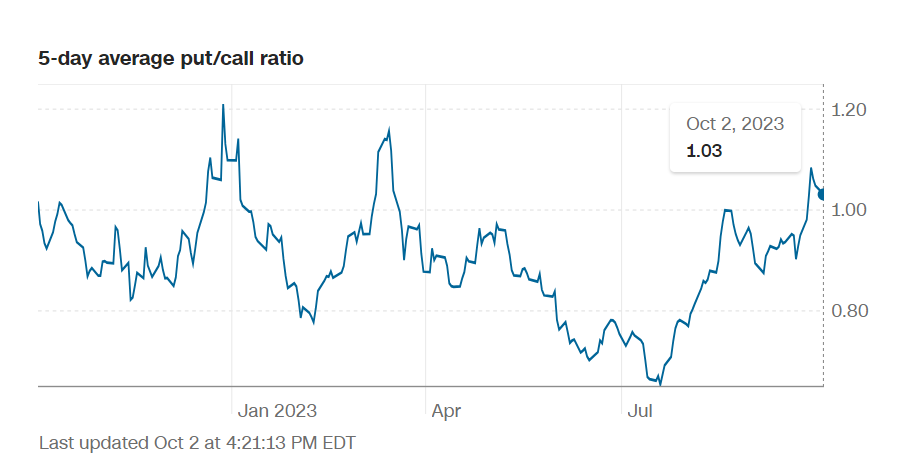
Source: CNN Fear and Greed Index
Commodities:
- Gold Futures: 1828.05 (-20.39, -1.10%)
- Bitcoin USD: 27798.00 (-197.40, -0.71%)
- Crude Oil Futures WTI: 88.82 (-1.97, -2.17%)
- Bloomberg Commodity Index: 103.75 (-1.09, -1.04%)
Factors:
- Mega Cap Growth led (+0.4%) followed by Large Cap Growth (+0.3%)
ETF Performance:
Top 3 Best Performers:
- Pro Shares UltaPro QQQ ^TQQQ +2.39%
- Direxion Daily Semiconductor Bull 3X Shares ^SOXL +1.11%
- INVESCO QQQ Trust ^QQQ +0.83%
Top 3 Worst Performers:
- Utilities Select Sector SPDR Fund ^XLU (52% puts) +659% volume, -4.65%
- iShares Silver Trust ^SLV -4.52%
- VanEck Gold Miners ETF ^GDX -3.42%
US Economic Data
August
- Construction Spending: 0.5% (Consensus 0.6%, Previous 0.9%)
September
- Final Manufacturing PMI: 49.8 (Previous 48.9)
- ISM Manufacturing: 49.0 (Consensus 48.0, Previous 47.6)
Earnings:
- Q1 ’23: 79% of companies beat analyst estimates.
- Q2 Forecast/Actual: Predicted <7.2%> FY 2023 S&P 500 EPS decline; FY 2023 EPS flat YoY. By 7-28, 51% reported Q2 2023, results; 80% beat EPS estimates, above 5-year (77%) and 10-year (73%) averages. Earnings exceeded estimates by 5.9%, slightly below the 5-year (8.4%) and 10-year (6.4%) averages.
- Q3 Forecast: S&P 500 to see -0.2% YoY earnings decline, marking 4th consecutive drop. S&P 500’s 12-month P/E ratio is 18.0, below 5-year (18.7%) average but above 10-year (17.5%) average. 74 S&P 500 firms gave negative EPS guidance, 42 exceeded expectations with positive guidance.
Notable Earnings Today:
- Beat:
- Miss:
Resources:
News
Investment and Growth News
- Honda Takes Another Crack at US EV Market With Help From GM – Bloomberg
- TikTok Parent ByteDance Turns Operating Profit, Sees Revenue Slow – WSJ
- X Partners With Paris Hilton for Shopping, Video Push – Bloomberg
Infrastructure and Energy
- NYC Subway Flood-Protection Projects Are Behind Schedule, Audit Says – Bloomberg
Real Estate Market Updates
- Severe Crash Is Coming for US Office Properties, Survey Says – Bloomberg
Central Banking and Monetary Policy
- Underlying Prices Cooled in August, Giving the Fed More Evidence of Softer Inflation – WSJ
- Fed’s Mester Says One More Rate Hike May Be Needed This Year – Bloomberg
International Market Analysis (China)
- China sees travel booming in first ‘golden week’ holiday since end of Covid restrictions – SCMP

