Stay Informed and Stay Ahead: Market Watch, September 6th, 2024.
Late-Week Wall Street Markets
Key Takeaways
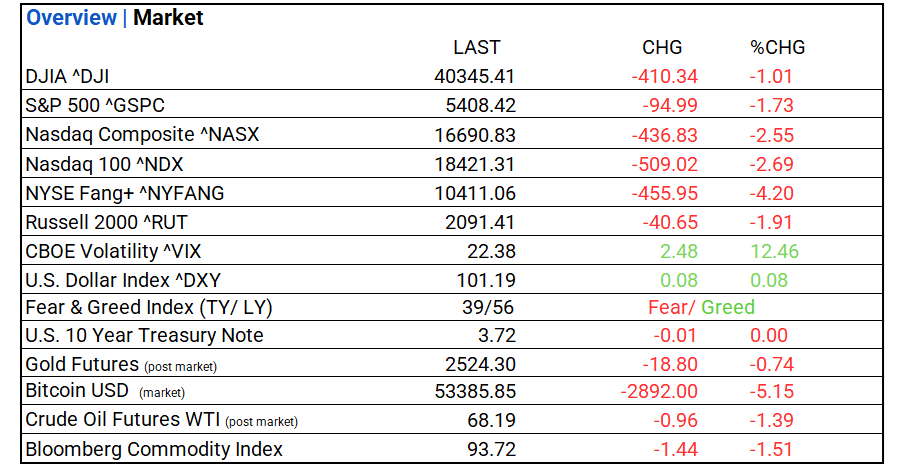
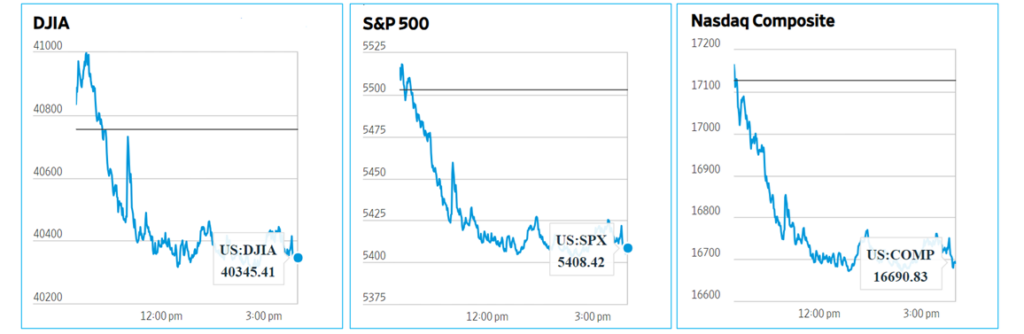
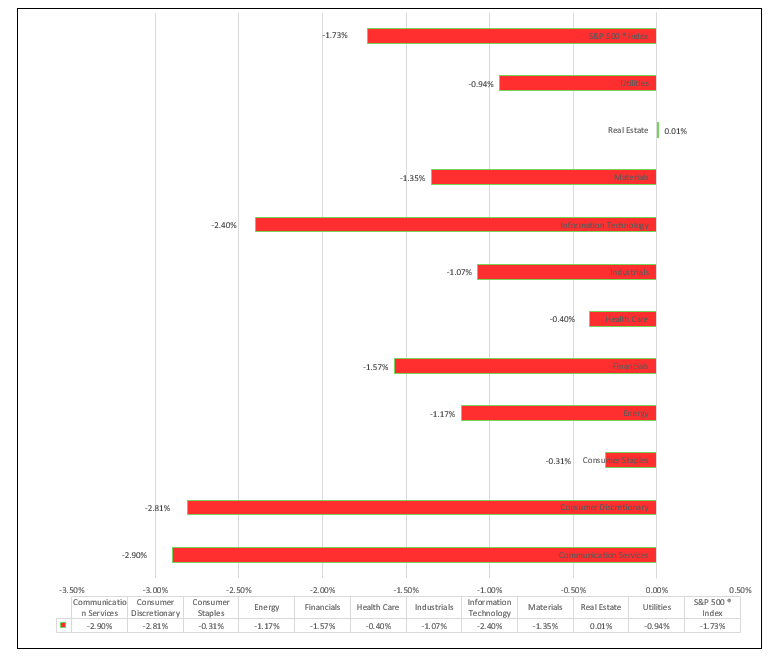
- Markets: DOW, S&P 500, and NASDAQ sharp declines. Real Estate leads, Communication Services lags. Top industry: Household Durables.
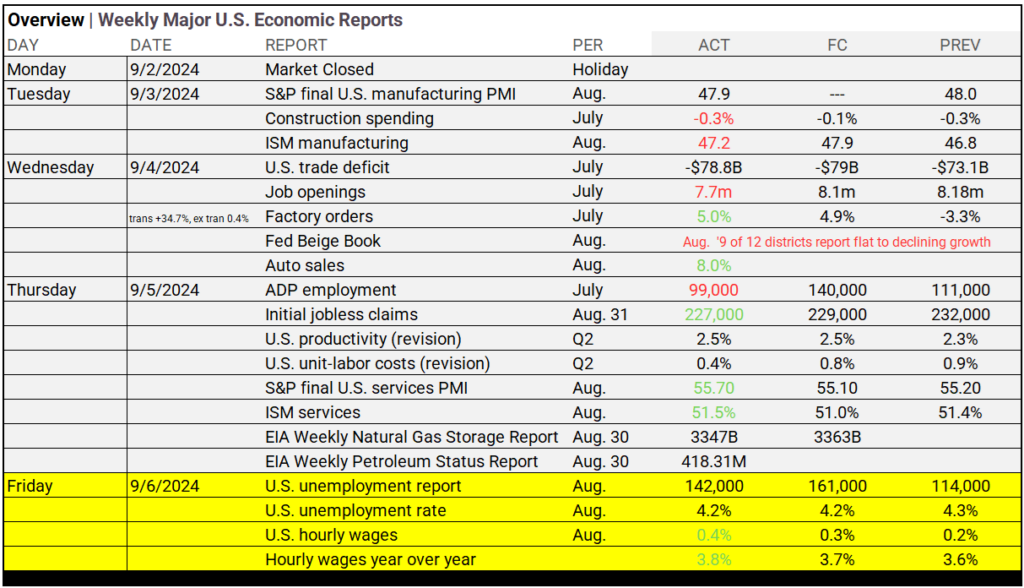
- Economic Reports: The unemployment rate dropped to 4.2%, with average weekly hours holding steady, reflecting labor market stability. Manufacturing payrolls remain tight, aligning with recent data suggesting labor moderation near the Fed’s 2% inflation target.
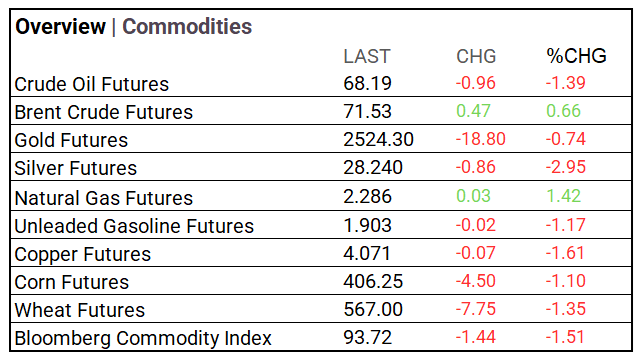
- Yields & Commodities: Long-term yields rose slightly, while shorter-term yields fell, particularly for the 2-Year Note, indicating expectations for possible Fed rate cuts next week. Commodities, Gold was relatively flat, and oil prices showed strong support following OPEC+’s confirmation of a two-month extension for output production cuts. Agricultural commodities have seen strong recent gains.
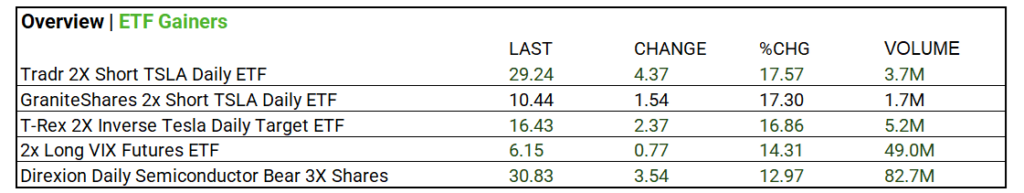
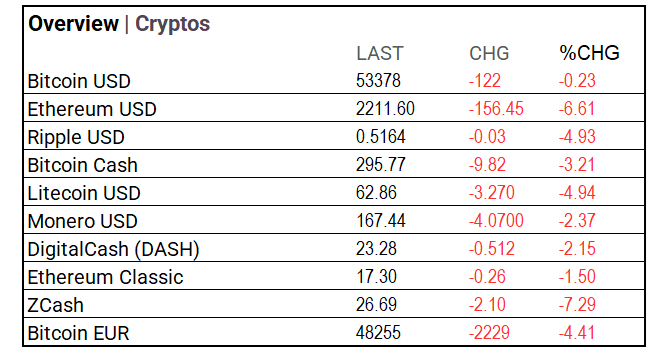
- Crypto & ETFs: Cryptocurrencies; Crypto’s have faced significant declines in September, with Ethereum and ZCash leading losses. The market has been hit hard as broader financial conditions reset, impacting all major digital assets. ETF volume gainers, 2x Long VIX Futures ETF and Direxion Daily Semiconductor Bear 3X Shares saw major trading volumes and gains, highlighting market volatility and semiconductor sector focus.
- Market Tips: Focus on long-duration bonds and consider refinancing leading companies as Q4 rate cuts approach. Keep in mind that Fed futures indicate a 98bps cut by year-end, and a 50bps cut will not address the market’s contraction concerns.
Market Summary
Indices & Sectors Performance:
- DOW, S&P 500, and NASDAQ fell. 10 of 11 sectors declined, Real Estate leads, Communication Services lags. Household Durables Industry (+0.77%), Specialized REITs (+0.54%), and Diversified Telecommunication Services (+0.51%), were largest advancers.
Technical:
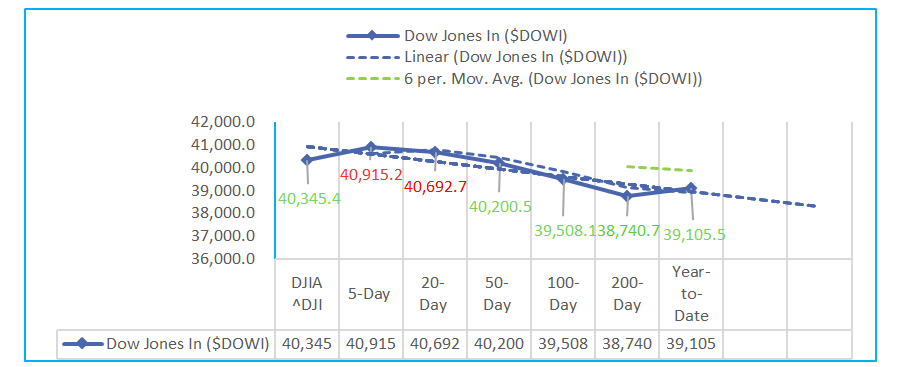
- The Dow Jones Industrial Average shows mixed performance, with short-term indicators like the 5-Day moving average reflecting a -2.39% decline and negative momentum in the 9-Day MACD Oscillator, while longer-term trends are more positive. The 100-Day and 200-Day averages show significant gains of +6.92% and +15.45%, respectively, suggesting underlying strength. Stochastic indicators reveal building momentum, particularly in the longer term, and RSI values indicate a balanced market with no extreme overbought or oversold conditions. Despite short-term volatility, the overall outlook suggests potential for continued recovery and upward movement in the medium to long term.
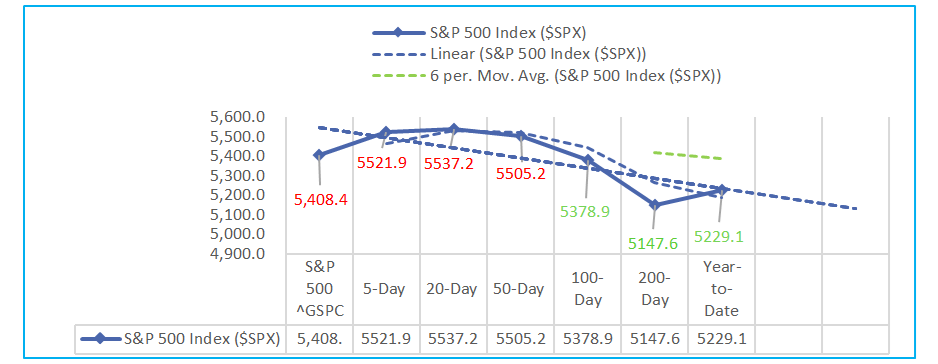
- The S&P 500 shows a mixed performance with short-term weaknesses but long-term strength. The 5-Day and 50-Day moving averages show declines of -3.28% and -1.27%, respectively, reflecting recent volatility. However, the 100-Day and 200-Day averages indicate significant gains of +6.85% and +19.81%, pointing to underlying market strength over a longer period. Stochastic indicators suggest building momentum, particularly in the 50-Day and 100-Day periods, while RSI levels are balanced, indicating no extreme market conditions. The MACD Oscillator shows negative divergence in the short term, but a positive shift occurs in the 100-Day period, signaling potential for continued growth in the medium to long term.
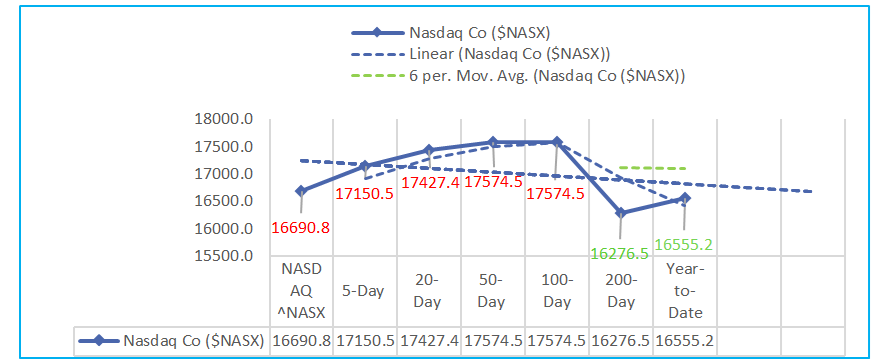
- The NASDAQ reflects significant short-term volatility but strong long-term performance. The 5-Day and 50-Day moving averages show declines of -4.71% and -6.26%, respectively, indicating recent downward pressure. However, the 100-Day and 200-Day averages reveal gains of +5.07% and +18.16%, pointing to resilience and growth over a longer period. Stochastic indicators highlight weak short-term momentum, particularly in the 9-Day and 14-Day periods, but a recovery is evident in the 50-Day and 100-Day periods. RSI levels suggest the market is not in extreme conditions, while the MACD Oscillator shows substantial negative divergence across most periods, indicating potential caution in the short term. Despite the current volatility, the longer-term outlook remains positive for continued recovery.
Sectors:
- Over the past 3 months, the S&P 500 Real Estate Sector has shown strong performance with a +14.16% gain, leading among sectors. The Financials Sector also performed well, gaining +9.14%. Other sectors, such as Consumer Staples (+7.02%) and Utilities (+6.74%), showed moderate gains, while Health Care saw a +6.46% increase. The Consumer Discretionary Sector had a modest +5.00% gain. The broader S&P 500 rose by +4.01%, with Industrials closely following at +4.51%. In contrast, the Information Technology (+1.62%), Materials (+1.34%), and Communication Services (-1.46%) sectors underperformed, with the Energy Sector facing a -2.71% decline.
Economic Highlights:
- Today in reports, the unemployment rate dropped to 4.2%, with average weekly hours holding steady, reflecting labor market stability. Manufacturing payrolls remain tight, aligning with recent data suggesting labor moderation near the Fed’s 2% inflation target.
NASDAQ Global Market Update:
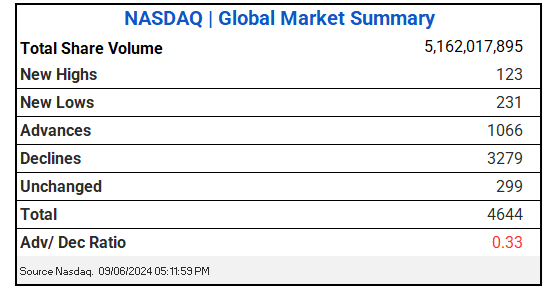
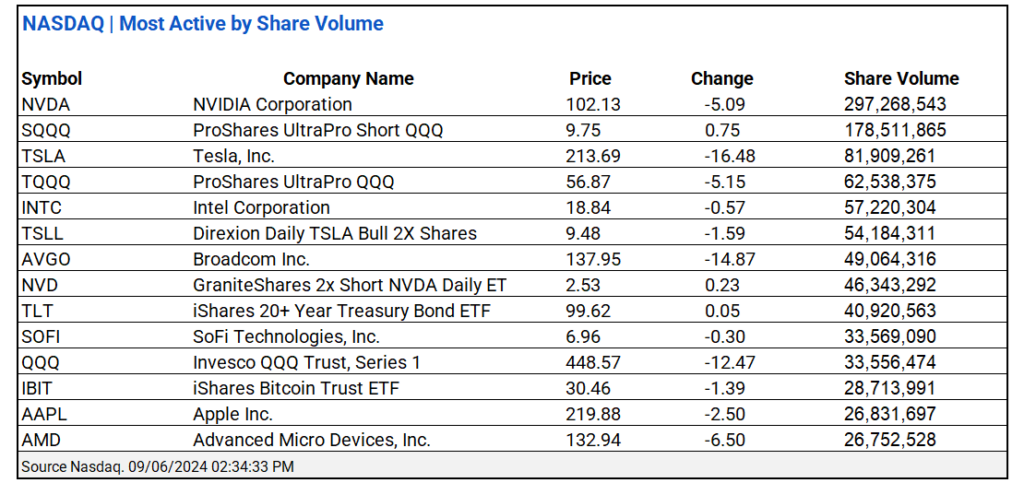
- NASDAQ saw 5.16B shares traded with a 0.33 advance/decline ratio. NVIDIA ^NVDA and ProShares UltraPro Short QQQ ^ SQQQ led share volume actives.
US Treasuries & Bond Markets:
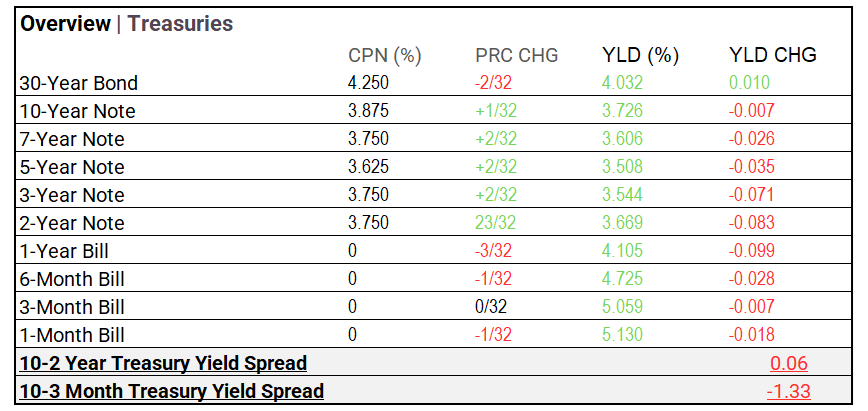
- US Treasuries: Long-term yields edged higher, with the 30-Year Bond yield increasing by 0.010% to 4.032%, while shorter-term yields saw declines, particularly in the 2-Year Note, which dropped by 0.083% to 3.669%. This shift suggests a market focus on the possibility of rate cuts next week, as economic conditions favor easing. Shorter-term bills, such as the 1-Year and 6-Month, also experienced yield drops, reflecting expectations for a more accommodative stance from the Fed in the near term.
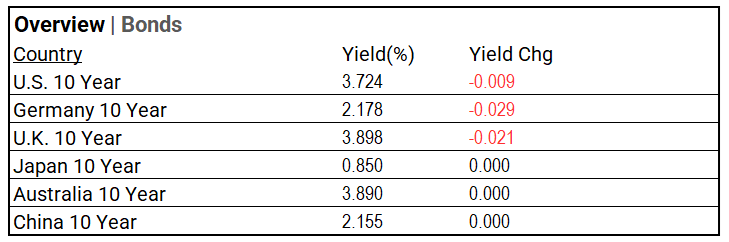
- Global bonds: Global bond yields show a mixed outlook, with declines in key regions like the U.S., Germany, and the U.K., signaling cautious optimism or expectations of slower economic growth. The U.S. 10-Year yield decreased slightly to 3.724%, while Germany’s and the U.K.’s 10-Year yields fell to 2.178% and 3.898%, respectively. Stable yields in Japan, Australia, and China indicate a steady outlook in these regions. This broader picture suggests global investors are pricing in the potential for economic moderation, with central bank rate decisions closely watched for further guidance.
Market Factors:
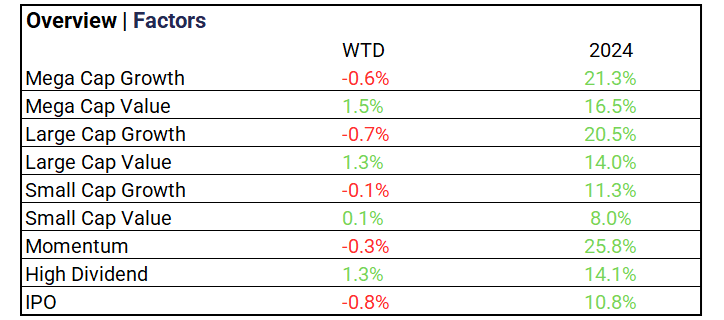
- In the past week, value-oriented sectors outperformed growth sectors, with Mega Cap Value and Large Cap Value gaining 1.5% and 1.3%, respectively, while Mega Cap Growth and Large Cap Growth declined by 0.6% and 0.7%. Small Cap Value showed slight gains at 0.1%, whereas Small Cap Growth was relatively flat at -0.1%. High Dividend stocks also saw a solid increase of 1.3%, indicating a preference for stability and income. Momentum and IPO stocks underperformed, with declines of 0.3% and 0.8%, reflecting investor caution towards higher-risk assets.
Volatility:
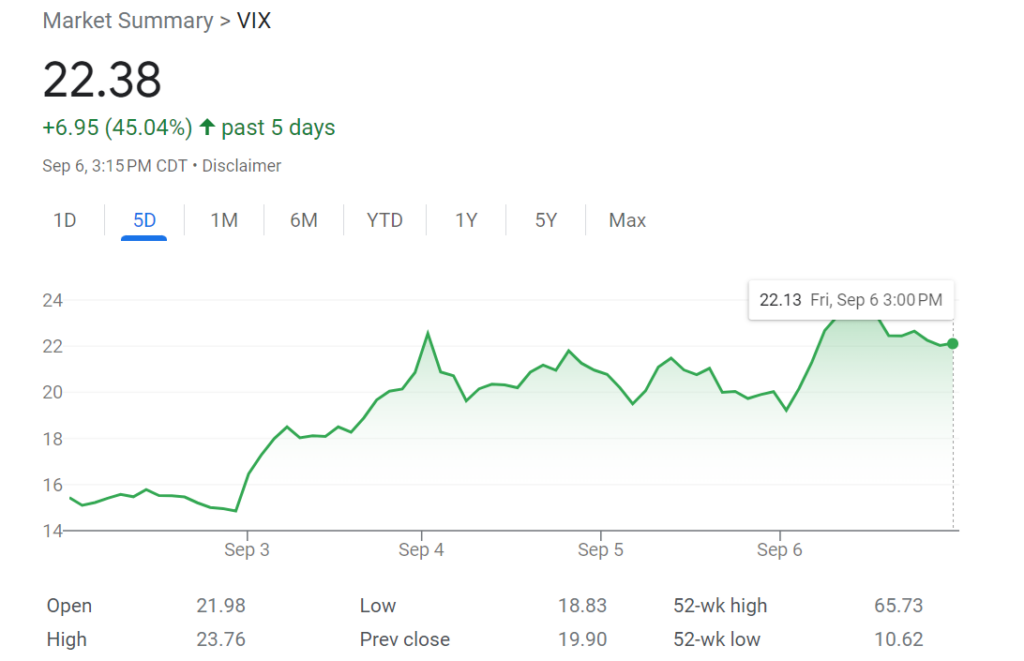
- VIX at 22.38 (+12.46%); The VIX Index rose 45.04% over the past five days to 22.38, indicating increased market volatility and investor uncertainty.
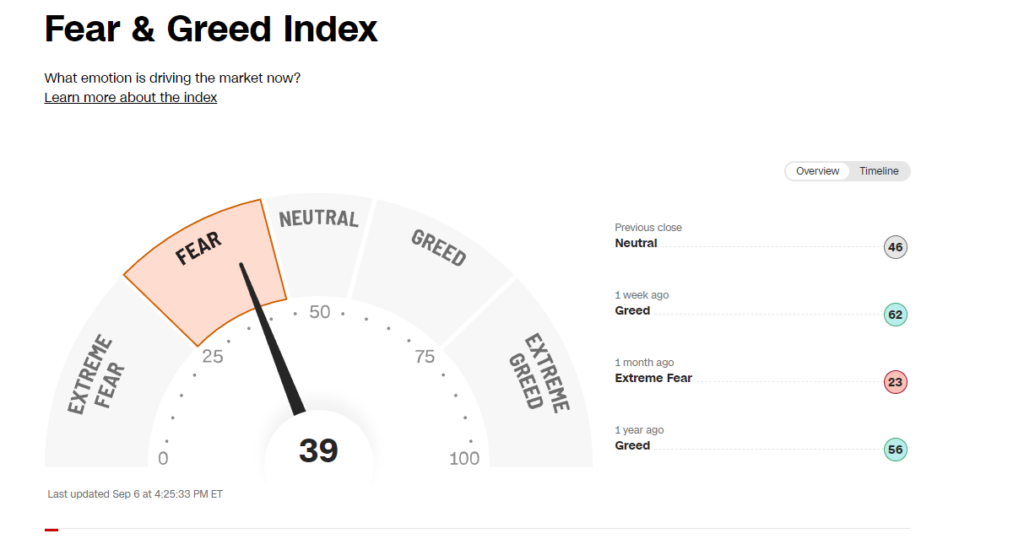
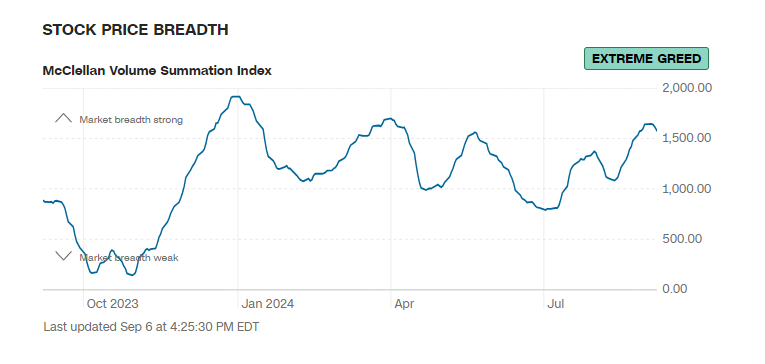
- Fear & Greed Index falls to “Fear”, MCV Index remains at “Extreme Greed”.
Commodities & ETFs:
- Commodity markets, industrial metals were mixed, Gold was relatively flat, and oil prices showed strong support following OPEC+’s confirmation of a two-month extension for output production cuts. Agricultural commodities, such as wheat, have seen strong recent gains.
- ETF volume gainers: The 2x Long VIX Futures ETF and Direxion Daily Semiconductor Bear 3X Shares stand out due to their significant trading volumes. The 2x Long VIX Futures ETF, with a volume of 49 million shares, increased by 14.31%, reflecting heightened investor interest in volatility. The Direxion Daily Semiconductor Bear 3X Shares, with an even higher volume of 82.7 million shares, gained 12.97%, indicating substantial activity and focus in the semiconductor sector.
Cryptocurrency & Currency:
- Cryptocurrency: Crypto’s have faced significant declines in September, with Ethereum and ZCash leading losses. The market has been hit hard as broader financial conditions reset, impacting all major digital assets.
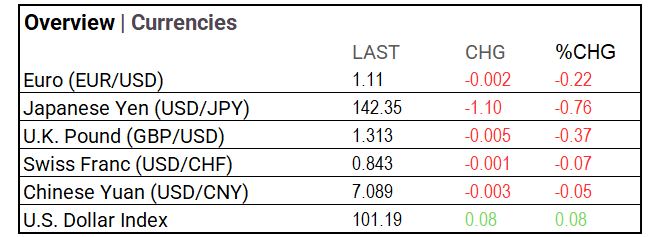
- Currencies: As the U.S. anticipates potential rate cuts, the Japanese Yen weakens amid expectations of a rate hike by Japan. The U.S. Dollar Index shows modest strength, reflecting differing central bank signals.
Stocks:
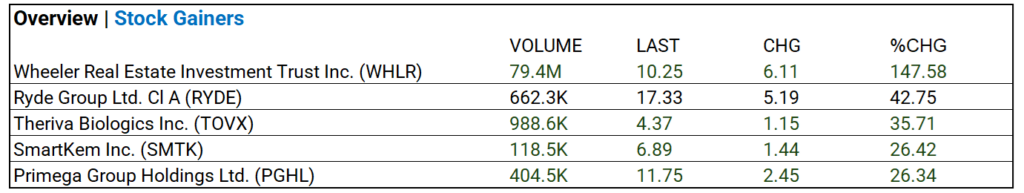
- Stock Advancers: Wheeler Real Estate Investment Trust Inc. (WHLR) experienced a notable gain, with its stock price rising 147.58% to $10.25 on a substantial volume of 79.4 million shares.
Notable Weekly Earnings:
- Broadcom (AVGO), Zscaler (ZS), Gitlab (GTLB), Hewlett Packard (HPE), Hewlett Packard (HPE), Samsara (IOT), DocuSign (DOCU),and UiPath (PATH) beat, while Ashtead Gro (ASHTY), Copart (CPRT), Hormel Foods (HRL), Nio A ADR (NIO), and Dollar Tree (DLTR) miss.
Global Markets Summary:
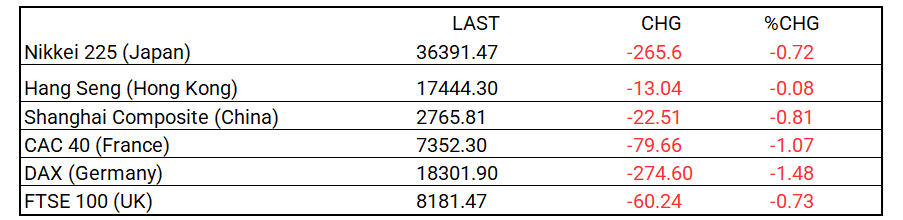
- Major indices across Asia and Europe experienced losses, reflecting broad market declines. In Asia, Japan’s Nikkei 225 and China’s Shanghai Composite both showed notable decreases. In Europe, the declines were more pronounced, with the DAX leading the losses.
Historical Patterns and Market Impact September
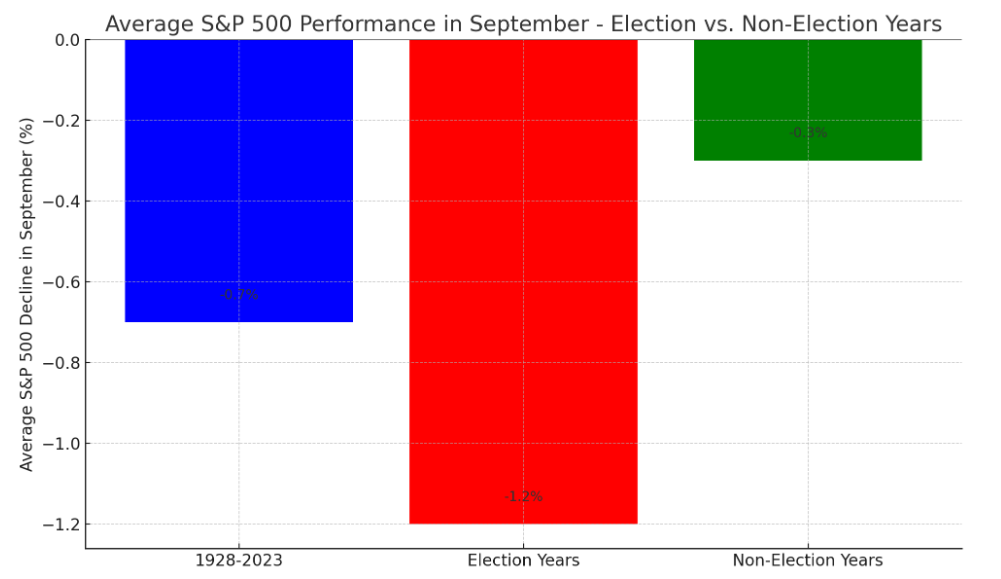
- Election Years: The S&P 500 typically experiences a steeper average decline in September during election years. In election years, this drop becomes even more pronounced, with the index falling in 60% of Septembers. Historically, the VIX has been 10-15% higher in these Septembers compared to non-election years.
- Non-Election Years: The decline is less pronounced, reflecting lower uncertainty.
- Historical Average (1928-2023): September tends to be weak overall, with an average decline of 0.7%.
Strategic Investment Adjustments:
- Focus on long-duration bonds with leveraged ETFs like ZROZ (PIMCO 25+ Year Zero Coupon U.S. Treasury Index ETF) and EDV (Vanguard Extended Duration Treasury Index ETF) to gain on potential rate cuts. Nasdaq/Tech and growth sectors show strong long-term potential. Diversify with Russell 2000 ETFs and bank index ETFs. Election years historically boost market performance. Top Small-Cap ETFs Poised to Benefit: Vanguard Small-Cap Growth ETF (VBK), iShares Russell 2000 Growth ETF (IWO), iShares S&P Small-Cap 600 Growth ETF (IJT).
Strategic Investment Approaches
US Treasury Long Bond Opportunity
Small Cap Opportunities Fall 2024
Top 10 Fastest-Growing Technology Sectors Through 2028
In the NEWS
Central Banking, Monetary Policy & Economics:
- German Recession Fears Mount as Industry Slump Endures – WSJ
- US Employment Rises Less Than Expected – Bloomberg
- Fed’s Waller Says Jobs Data ‘Requires Action,’ Open to Big Cut – Bloomberg
Business:
- U.S. Dockworkers Are Bracing for a Strike at Major American Ports – WSJ
- Big Lots Prepares Bankruptcy Filing With Plans to Sell Stores – Bloomberg
China:
- China’s economy shows up as a top concern for US companies, business council survey finds – SCMP