
Stay Informed and Stay Ahead: Market Watch, September 24th, 2024.
Early-Week Wall Street Markets
Key Takeaways
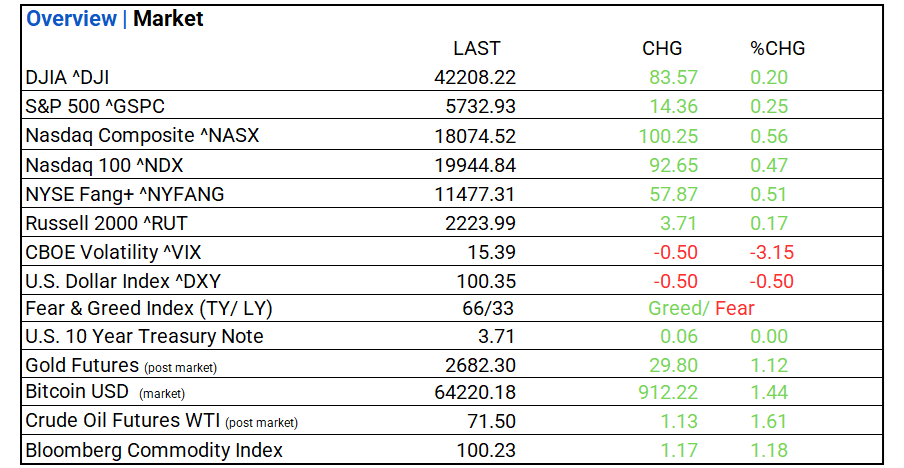
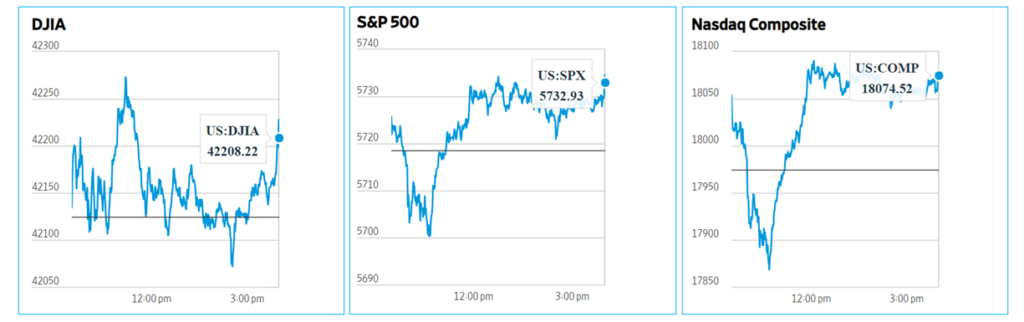
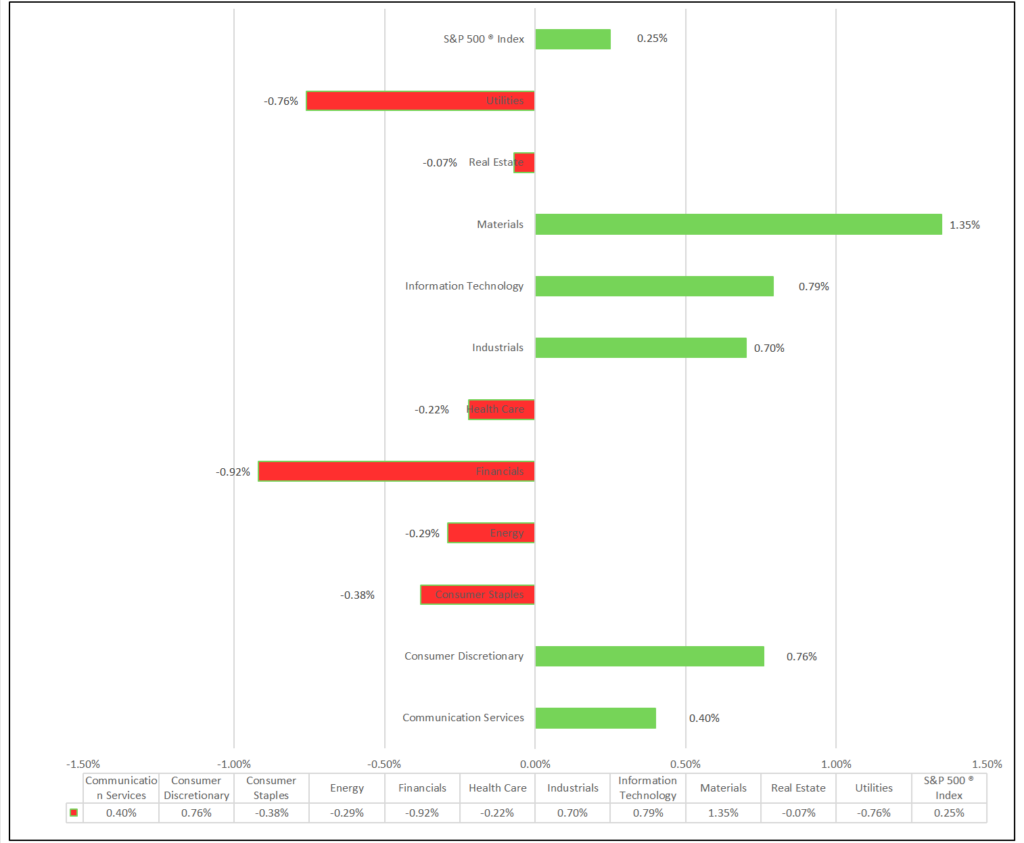
- Markets: DOW, S&P 500, and NASDAQ all rise. 5 of 11 sectors declined, Materials leads, Utilities lags. Top industry: Metals & Mining.
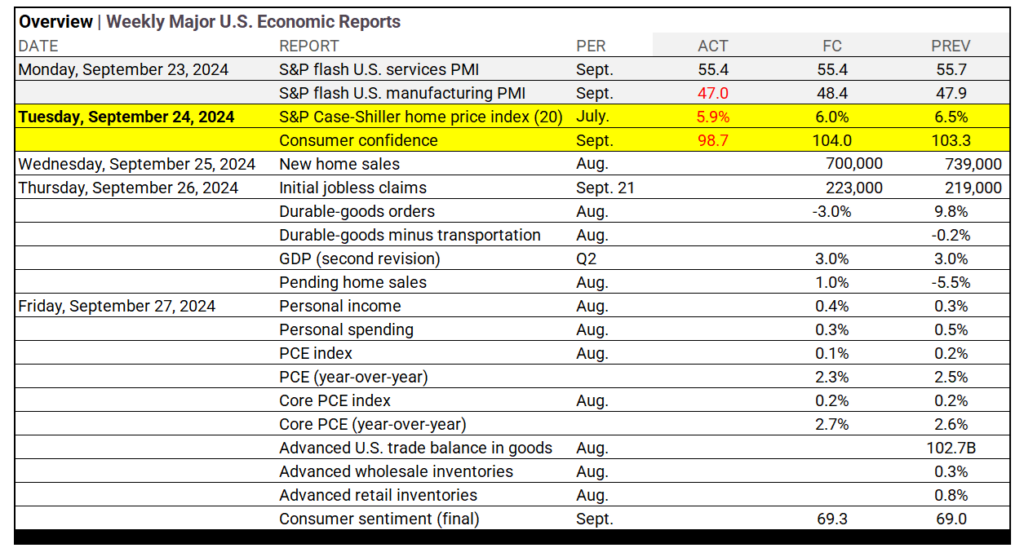
- Economics: Home prices in the 20 largest U.S. metro areas rose 5.9% in July year-over-year, falling short of the 6% forecast. New York led with an 8.8% increase. Meanwhile, the Conference Board reported a drop in the Consumer Confidence index to 98.7, indicating weaker sentiment.
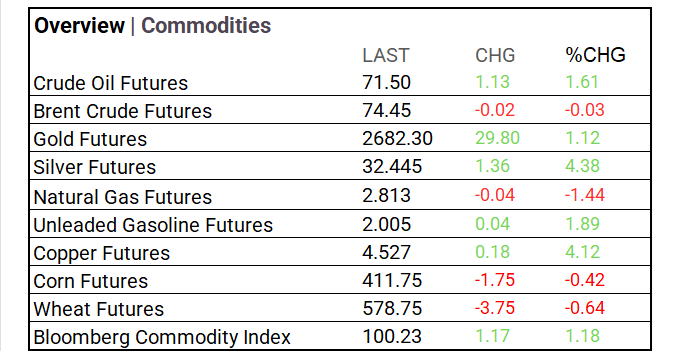
- Yields & Commodities: US Treasuries Following last week’s 50bps Fed rate cut, Treasury yields declined, with the 2-year note at 3.544% and the 10-year at 3.733%, reflecting expectations for further easing amid slowing economic conditions. Commodity markets Crude oil futures rose 1.61% to $71.50, while gold increased 1.12% to $2,682.30. Silver also gained, contributing to a 1.18% rise in the Bloomberg Commodity Index, reflecting strength in energy and precious metals.
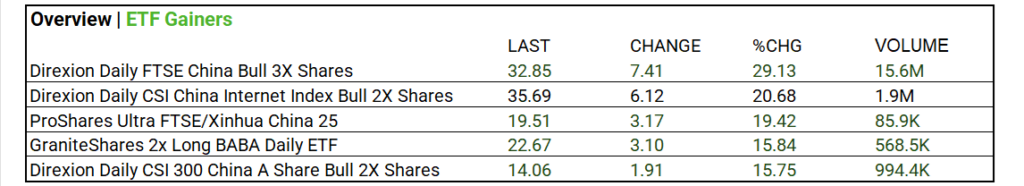
- Crypto & ETFs: Cryptocurrencies Bitcoin (BTC-USD) closed at $64,220, up $912, reflecting cautious optimism as its recovery gains momentum. ETF volume gainers, : Direxion Daily FTSE China Bull 3X Shares rose 29.13% to $32.85, with a significant trading volume of 15.6 million shares.
- Market Tips: Focus on long-duration bonds and consider refinancing leading companies as Q4 rate will continue. Stay long in Ai (read-up on our top CAGR’S report) diversify with Russell 2000 ETFs.
Market Summary
Indices & Sectors Performance:
- DOW, S&P 500, and NASDAQ rise. 5 of 11 sectors declined, Materials leads, Utilities lags. Industry Leaders: Metals & Mining (+4.51%), Semiconductor & Semiconductor Equipment (+2.59%), and Personal Care Products (+2.18%).
Technical:
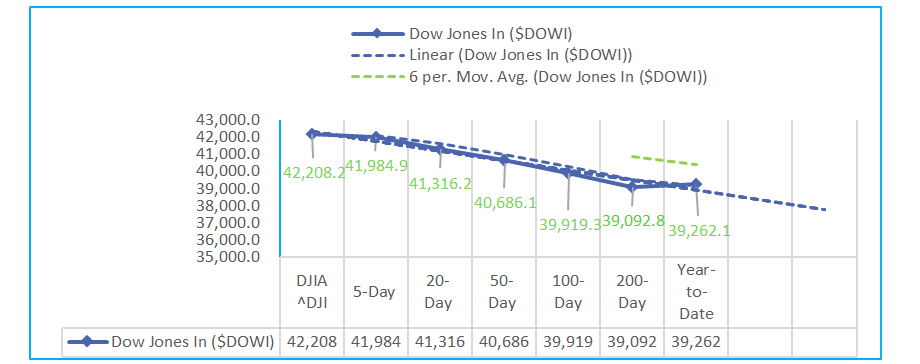
- The Dow Jones Industrials (DOWI) is on a strong upward trajectory with consistent gains. Over the 5-Day period, the index has risen by 1.45%, and this momentum extends to 17.07% over the 200-Day period. Stochastic values remain elevated, signaling potential overbought conditions. The Relative Strength is decreasing, but remains above 50%, indicating some ongoing strength. Volatility is moderate to high, with MACD oscillators showing increasing bullish momentum, particularly over the longer 50- and 100-Day periods, suggesting a sustained positive trend despite some cooling in short-term strength.
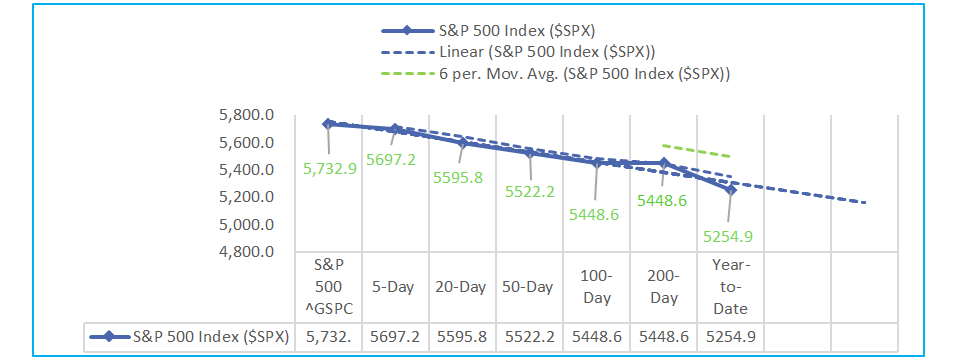
- The S&P 500 (SPX) is showing solid upward momentum with notable price gains across key time frames. Over the 5-Day period, there’s a 1.75% rise, increasing to 26.02% on the 200-Day period, with moving averages steadily climbing. Stochastic indicators are elevated, nearing overbought conditions with values close to 100%. Volatility is moderate, with the MACD oscillator confirming bullish trends, especially over the 50- and 100-Day periods, reflecting strong momentum. Relative Strength indicates weakening over time, but overall, the trend remains positive with no immediate signs of a reversal.
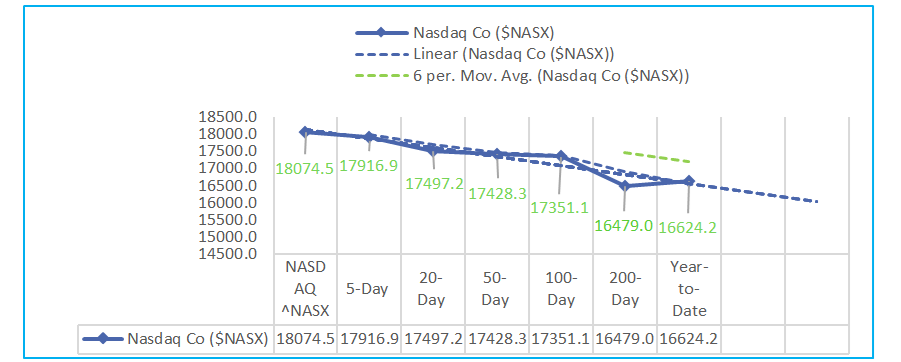
- The Nasdaq Composite (NASX) shows mixed performance with short-term gains but some volatility over the medium term. In the last 5 days, the index has risen by 2.53%, though it faced a 2.15% decline over the 50-Day period. Over the long term, the Nasdaq has gained 27.76% over 200 days. Stochastic indicators suggest a potential overbought condition, especially in the 9- and 14-Day periods, while the Relative Strength is declining, hovering around 55%-67%. Volatility is increasing, with the MACD oscillator indicating bullish momentum over the long term but signaling short-term caution.
Sectors:
- Over the past month, the S&P 500 sectors In the past month, the Consumer Discretionary and Utilities sectors led with strong gains (+8.41% and +7.30% respectively), while Energy (+0.97%) and Health Care (0.00%) lagged, with overall market strength supported by steady technicals—RSI levels remain solid across most sectors, while volatility was moderate.
Economic Highlights:
- Home prices in the 20 largest U.S. metro areas rose 5.9% in July year-over-year, below the 6% forecast, hitting record highs. New York led with an 8.8% increase, despite slowing growth.
- The Conference Board reported a drop in the Consumer Confidence index to 98.7, below the forecasted 103.9, signaling weaker consumer sentiment and potential reduced spending.
NASDAQ Global Market Update:
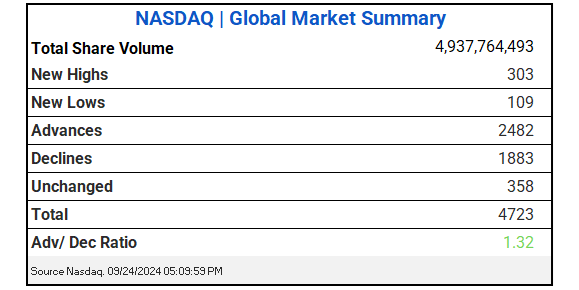
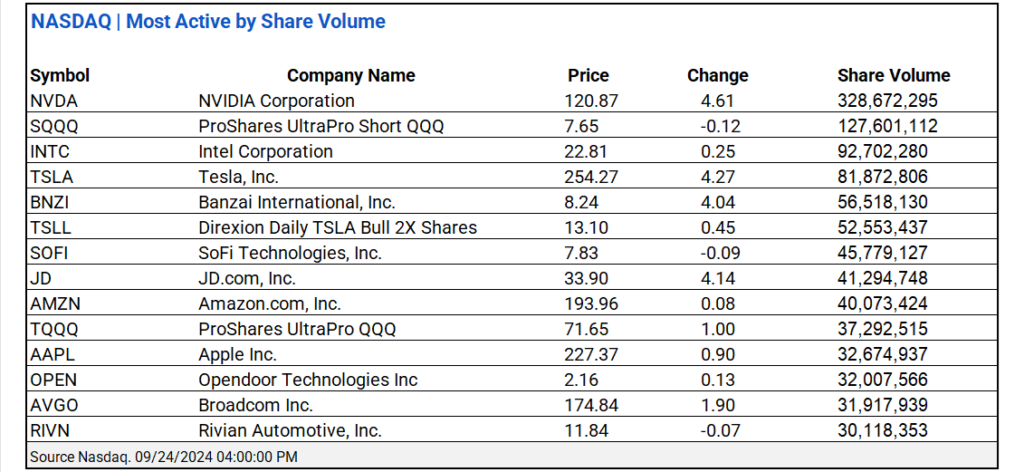
- NASDAQ saw 4.939B shares traded with a 1.32 advance/decline ratio. NVIDIA ^NVDA and ProShares UltraPro Short QQQ ^ SQQQ led share volume actives. Notable is Intel, Corp. ^INTC.
US Treasuries & Bond Markets:
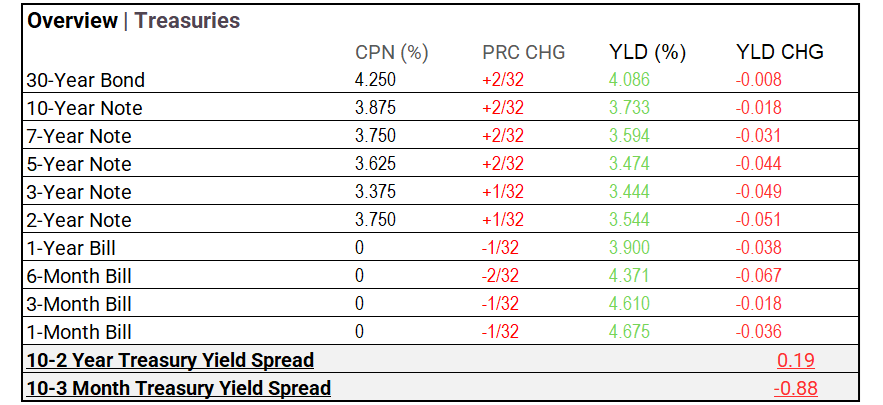
- US Treasuries: Following last week’s 50bps Fed rate cut, Treasury yields have broadly declined, reflecting a shift in market sentiment towards looser monetary policy. The 2-year note dropped 5.1 bps to 3.544%, leading the short end of the curve, while the 10-year fell 1.8 bps to 3.733%. This movement indicates market expectations for further easing, as investors seek longer-duration assets, driving prices up. The decline across the curve suggests the Fed’s policy shift is being priced in, with expectations of slowing economic conditions and lower inflation risks.
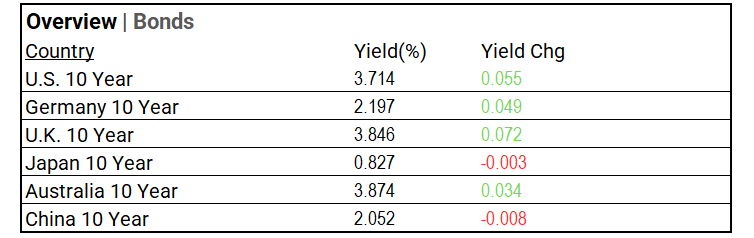
- Global bonds: The upward trend in global bond yields is particularly evident in the U.S. and U.K. markets. The U.S. 10-year yield increased by 5.5 bps to 3.714%, reflecting market adjustments to rising inflation concerns. The U.K. showed a significant rise of 7.2 bps to 3.846%, indicating strong inflationary pressures in the region. In contrast, Germany’s yield rose modestly by 4.9 bps to 2.197%, while Japan’s yield remained stable, reflecting a divergence in monetary policy impacts across these major economies.
Market Factors:
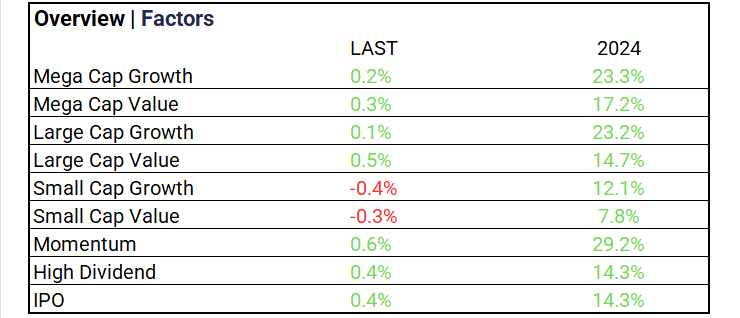
- The big picture trend in equity performance shows a notable divergence between growth and value, with mega cap growth leading at 23.3% year-to-date, closely followed by mega cap value at 17.2%. Large cap growth also performed well, up 23.2%, while large cap value lagged slightly at 14.7%. Conversely, small cap segments showed weaker performance, particularly small cap growth, which declined by 0.4% and is up only 12.1% year-to-date. Momentum strategies have excelled with a robust 29.2% gain, alongside high dividend and IPO sectors both at 14.3%, indicating strong investor interest in income-generating equities.
Volatility:
- VIX at 15.39 (-3.15%); The VIX Index decreased 15.72% over the past five days, indicating a market recovery.
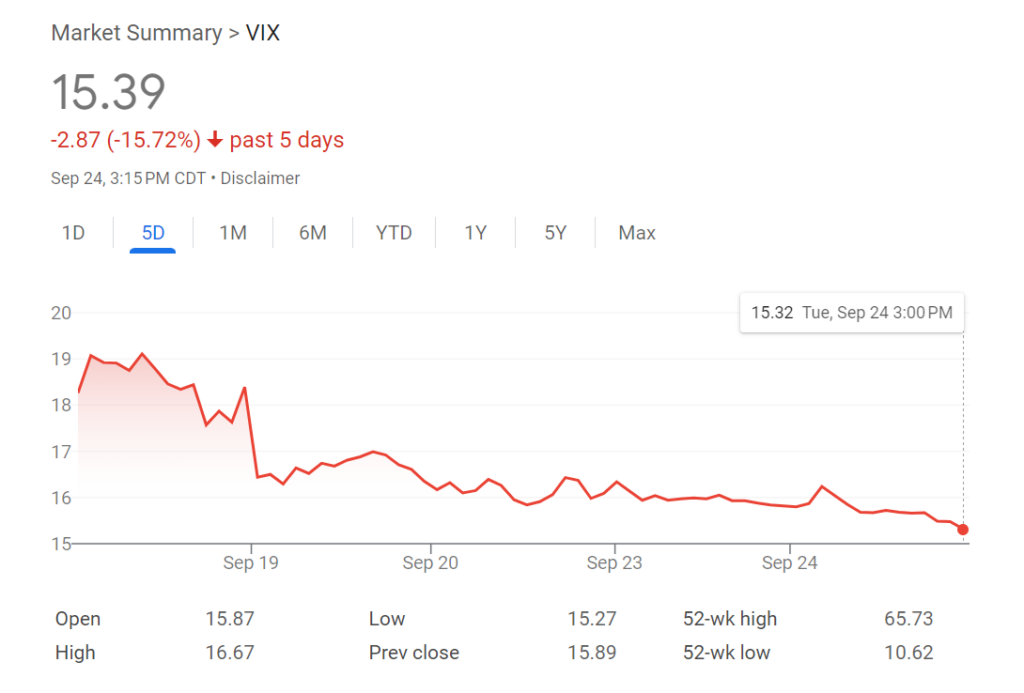
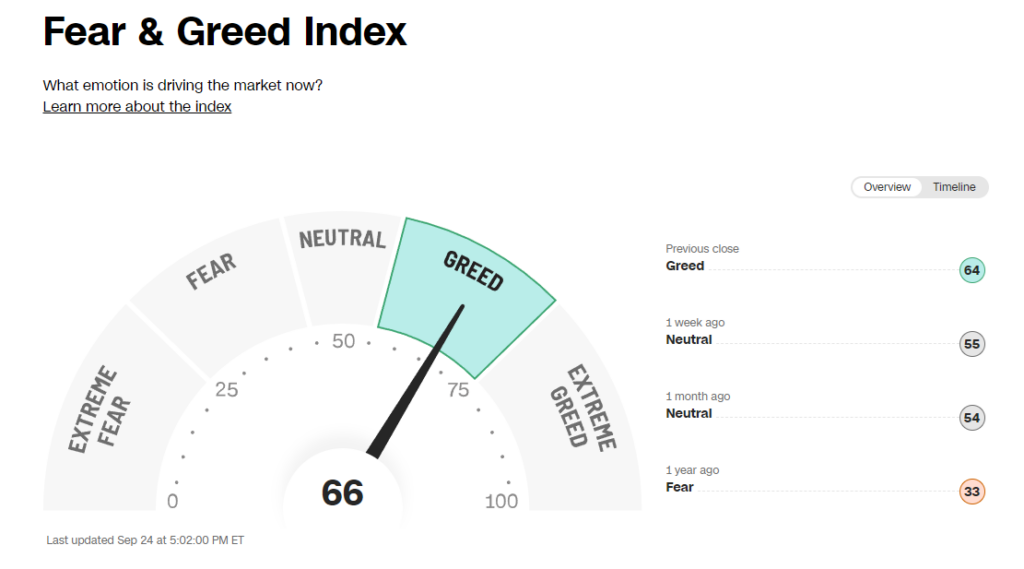
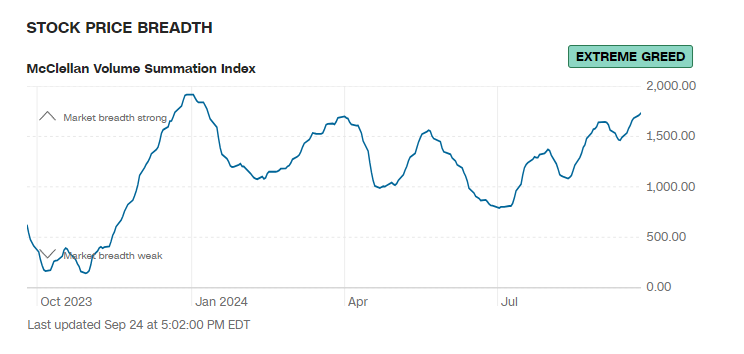
- The Fear & Greed Index registers “Greed”, MCV Index returns to “Extreme Greed”.
Commodities & ETFs:
- Commodity markets: Crude oil futures rose 1.61% to $71.50, while Brent crude remained stable. Gold increased 1.12% to $2,682.30, and silver surged 4.38% to $32.445. In contrast, natural gas fell 1.44%, and agricultural commodities declined. The Bloomberg Commodity Index gained 1.18%, led by energy and precious metals.
- ETF volume gainers: Direxion Daily FTSE China Bull 3X Shares rose 29.13% to $32.85, with a significant trading volume of 15.6 million shares.
Cryptocurrency & Currency:
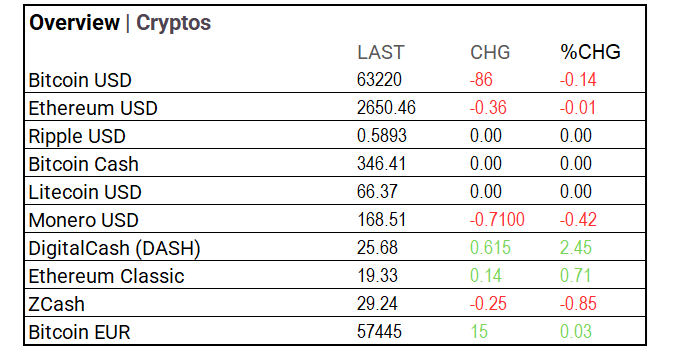
- Cryptocurrency: In market hours, Bitcoin (BTC-USD) closed at $64,220, gaining $912. Post market Ethereum remained stable at $2,650.46, and overall sentiment shows cautious optimism as Bitcoin’s recovery gathers momentum.
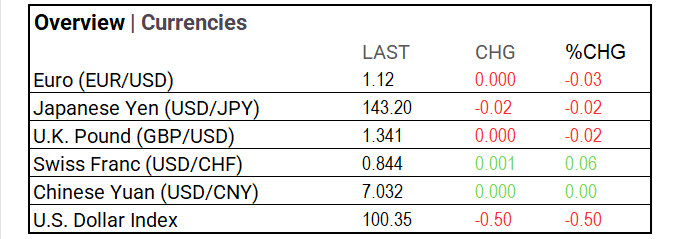
- Currencies: The U.S. Dollar Index fell 0.50% to 100.35, indicating a slight weakening against major currencies. The Euro and Japanese Yen remained stable, while the U.K. Pound and Swiss Franc showed minimal changes, reflecting a cautious trading environment.
Stocks:
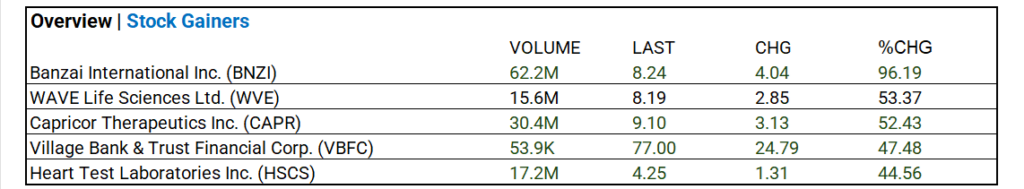
- Stock Advancers: Banzai International Inc. climbed 96.19% to $8.24 on 62.2M shares traded. WAVE Life Sciences rose 53.37% to $8.19, while Capricor Therapeutics gained 52.43% to $9.10 with 30.4M shares.
Notable Weekly Earnings:
- Thor Industries (THO) beat.
- AutoZone (AZO), and KB Home (KBH) miss.
Global Markets Summary:
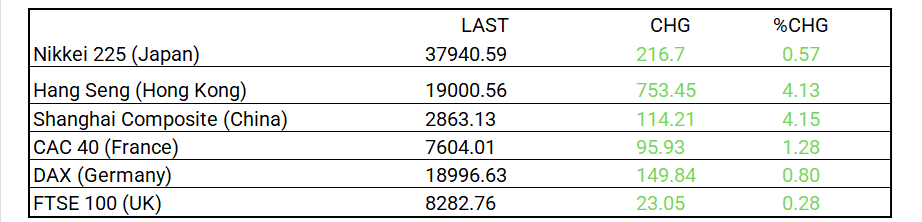
- Asian markets showed strength, with Japan’s Nikkei up 0.57%, Hong Kong’s Hang Seng gaining 4.13%, and China’s Shanghai Composite rising 4.15%, while European indices like France’s CAC 40 and Germany’s DAX also posted gains.
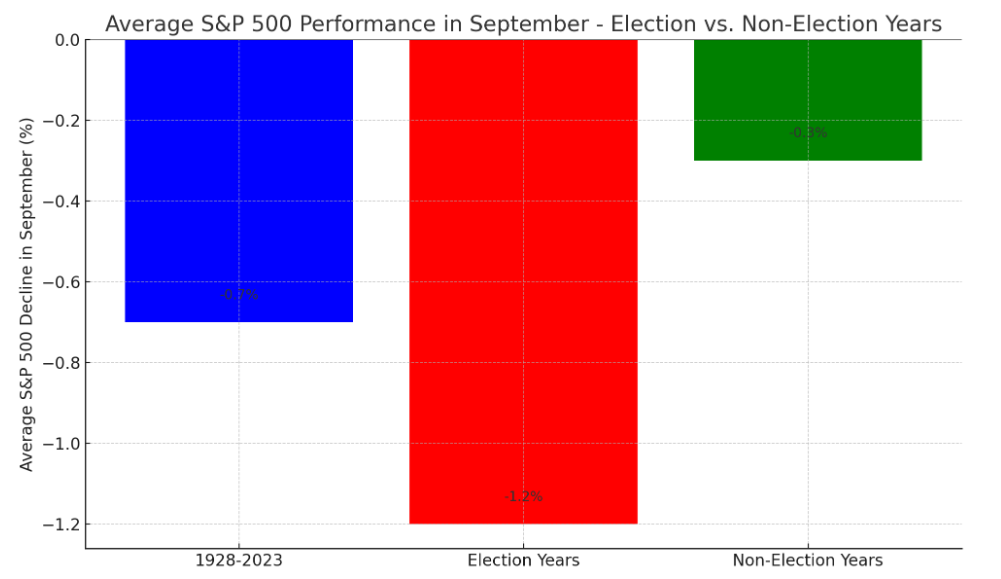
Historical Patterns and Market Impact September
- Election Years: The S&P 500 typically experiences a steeper average decline in September during election years. In election years, this drop becomes even more pronounced, with the index falling in 60% of Septembers. Historically, the VIX has been 10-15% higher in these Septembers compared to non-election years.
- Non-Election Years: The decline is less pronounced, reflecting lower uncertainty.
- Historical Average (1928-2023): September tends to be weak overall, with an average decline of 0.7%.
Strategic Investment Adjustments:
- Focus on long-duration bonds with leveraged ETFs like ZROZ (PIMCO 25+ Year Zero Coupon U.S. Treasury Index ETF) and EDV (Vanguard Extended Duration Treasury Index ETF) to gain on potential rate cuts. Nasdaq/Tech and growth sectors show strong long-term potential. Diversify with Russell 2000 ETFs and bank index ETFs. Election years historically boost market performance. Top Small-Cap ETFs Poised to Benefit: Vanguard Small-Cap Growth ETF (VBK), iShares Russell 2000 Growth ETF (IWO), iShares S&P Small-Cap 600 Growth ETF (IJT).
Strategic Investment Approaches
US Treasury Long Bond Opportunity
Small Cap Opportunities Fall 2024
Top 10 Fastest-Growing Technology Sectors Through 2028
In the NEWS
Central Banking, Monetary Policy & Economics:
- BOJ Governor’s Cautious Comments Damp Speculation of October Hike – WSJ
- China Unleashes Stimulus Package to Revive Economy, Markets – Bloomberg
Business:
- Rio Tinto Aims to Increase Aluminum Margin, Return on Capital – WSJ
- Moody’s Downgrades Alaska Air to Junk on Plan to Borrow More – Bloomberg
China:
- Exclusive | How China’s can-do attitude on canals opens the door to white elephants – SCMP