
Stay Informed and Stay Ahead: Market Watch, September 13th, 2024.
Late-Week Wall Street Markets
Key Takeaways
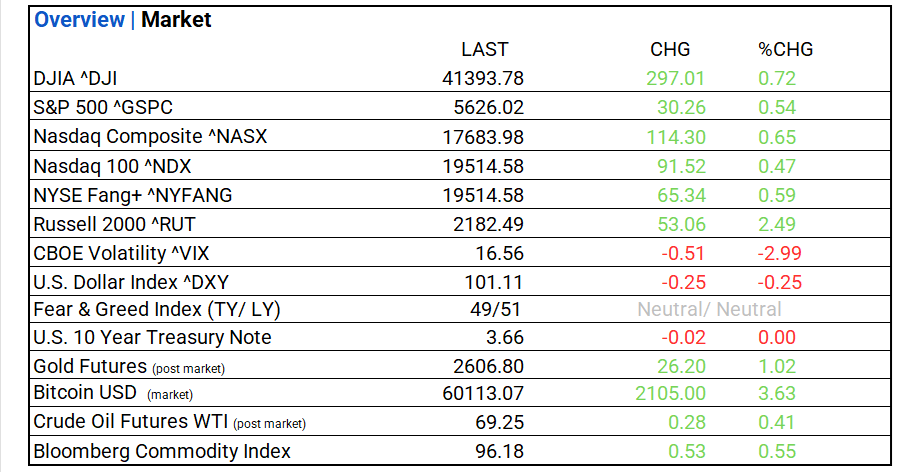
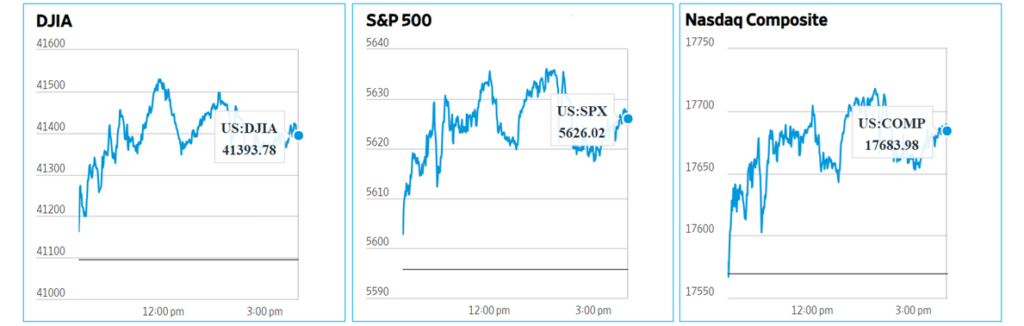
- Markets: DOW, S&P 500, and NASDAQ advance. Utilities leads, Health Care lags. Top industry: Independent Power & Renewable Electricity Producers.
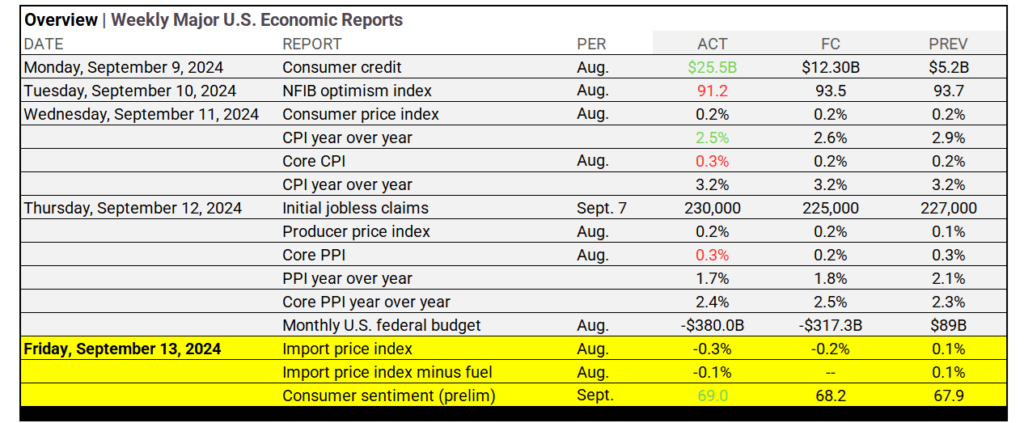
- Economic Reports: Over the past three days, inflation has remained steady, with CPI at 2.5% YoY. Producer prices rose slightly, jobless claims increased, and consumer sentiment improved to 69.0, signaling resilience amidst slowing price pressures and stable job markets.
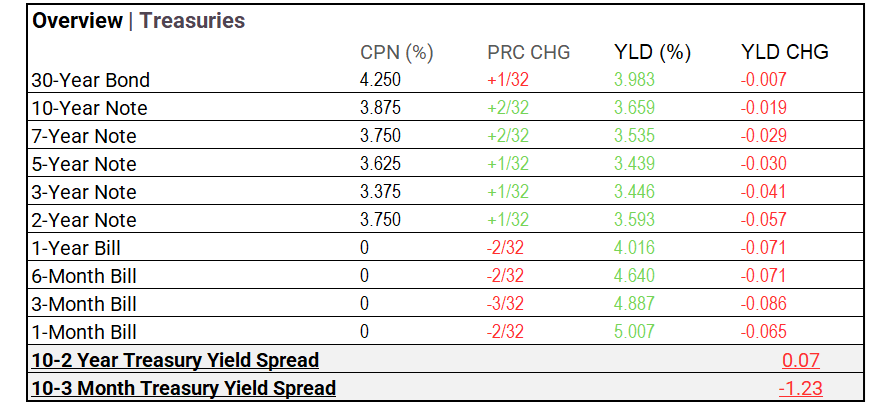
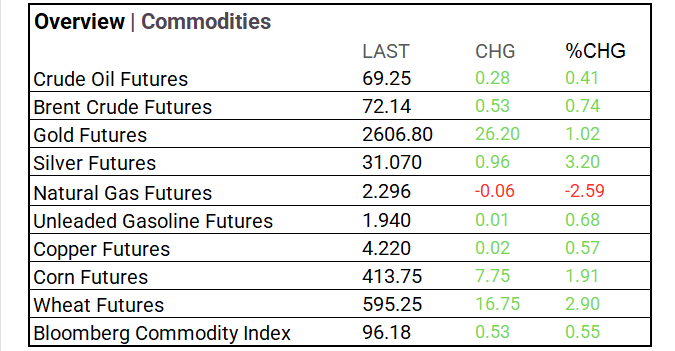
- Yields & Commodities: US Treasuries rallied with yields falling across the curve. The 10-year yield dropped to 3.659%, and the 2-year yield fell to 3.593%, indicating cautious optimism. Commodity markets showed mixed results: crude oil and Brent gained modestly, gold rose 1.02%, and silver advanced 3.20%. Corn and wheat increased, while natural gas fell 2.59%.
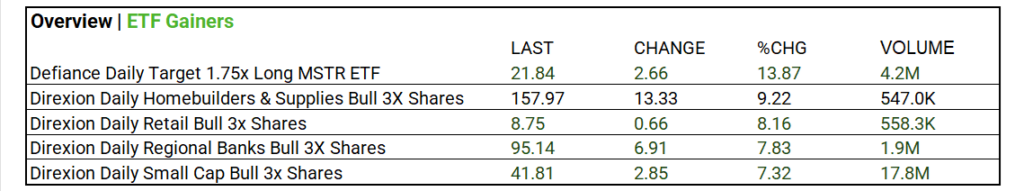
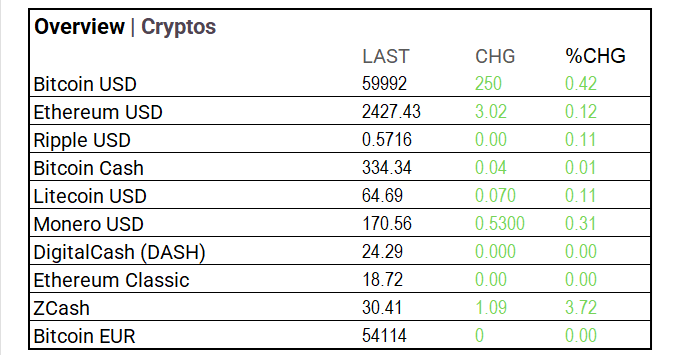
- Crypto & ETFs: Cryptocurrencies; Bitcoin led with a 3.63% gain, while Ethereum and Ripple showed minimal changes. ETF volume gainers, high-volume gainers today are the Direxion Daily Small Cap Bull 3x Shares, up 7.32% with 17.8M volume, and the Defiance Daily Target 1.75x Long MSTR ETF, which rose 13.87% on 4.2M volume.
- Market Tips: Focus on long-duration bonds and consider refinancing leading companies as Q4 rate cuts approach. Diversify with Russell 2000 ETFs “small caps will rally” with Fed cuts and possibly bank index ETFs. Keep in mind that Fed futures indicate a 98bps cut by year-end, and a 50bps cut will not address the market’s contraction concerns.
Market Summary
Indices & Sectors Performance:
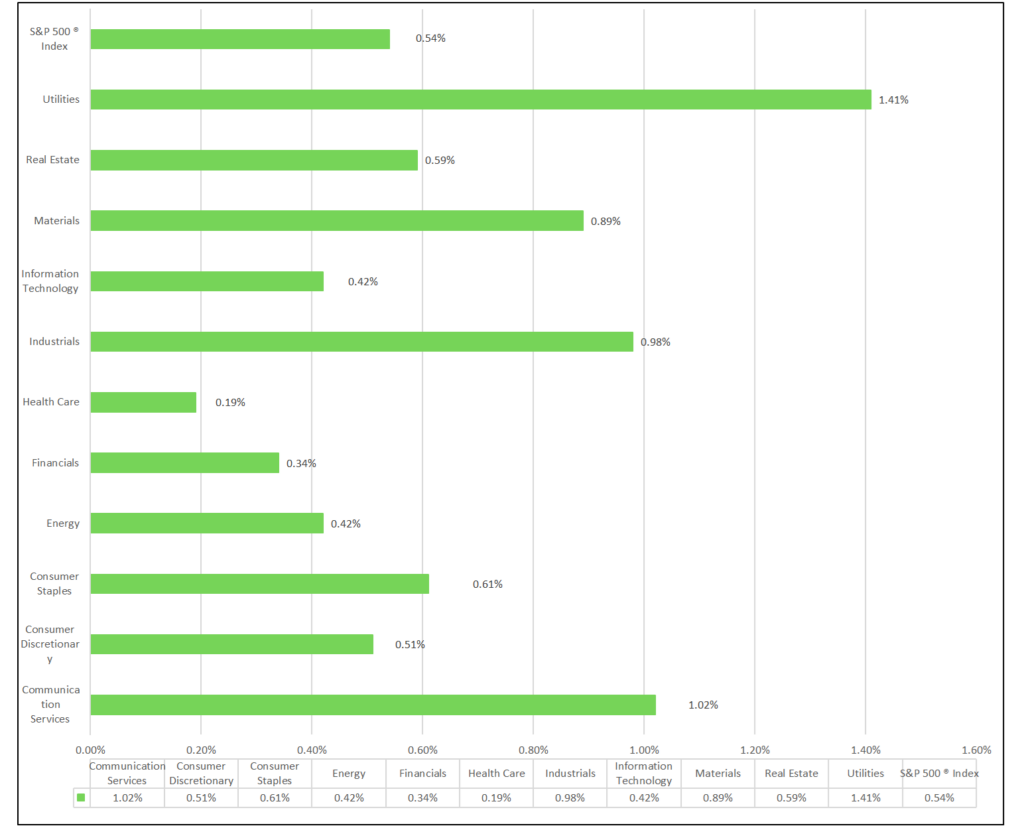
- DOW, S&P 500, and NASDAQ rise. All 11 sectors advance, Utilities leads, Health Care lags. Independent Power & Renewable Electricity Producers (+5.00%), Automobile Components (+2.28%), and Leisure Products (+2.11%).
Technical:
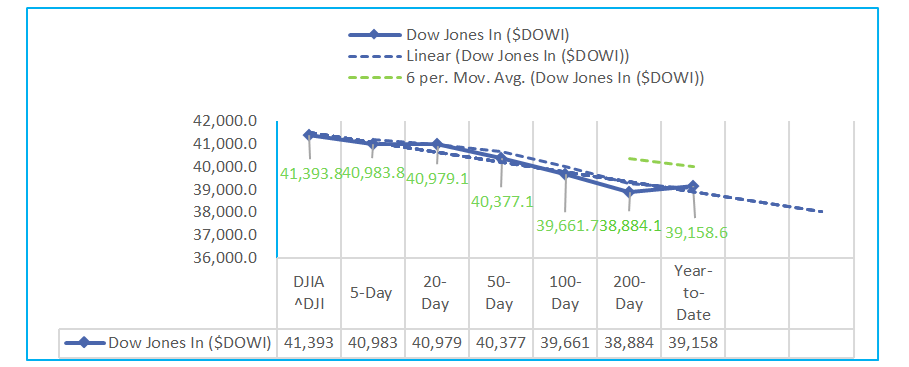
- The Dow Jones Industrials (DOWI) rose 2.60% over the past 5 days, supported by steady gains across all periods. Stochastic indicators suggest overbought conditions, while RSI sits at 62.87%. Volatility remains controlled, and the MACD shows continued bullish momentum.
- The S&P 500 (SPX) gained 4.02% over the past 5 days, driven by strong momentum across short and long-term trends. Stochastic indicators suggest overbought conditions, with RSI stabilizing at 61.83%. Volatility remains low, and MACD signals continued bullish momentum.

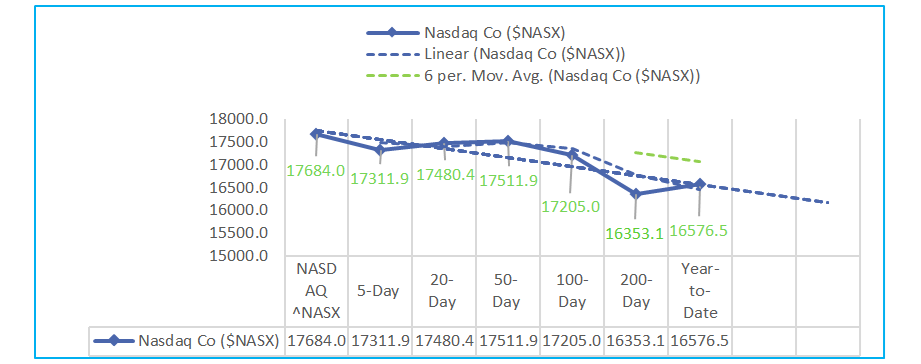
- The Nasdaq Composite (NASX) gained 5.95% over the past 5 days, driven by strong short-term momentum despite a 50-day decline. Stochastic indicators reflect overbought conditions, with RSI at 60.28%. Volatility remains moderate, and MACD suggests ongoing bullish momentum.
Sectors:
- Over the past month, the S&P 500 sectors have shown a strong performance, led by Consumer Discretionary (+9.95%) and Real Estate (+7.15%). Information Technology gained 6.34%, reflecting robust growth trends, while Energy lagged, falling 5.44%, indicating sector-specific challenges.
Economic Highlights:
- Over the past three days, inflation has remained steady, with CPI at 2.5% YoY. Producer prices rose slightly, jobless claims increased, and consumer sentiment improved to 69.0, signaling resilience amidst slowing price pressures and stable job markets.
NASDAQ Global Market Update:
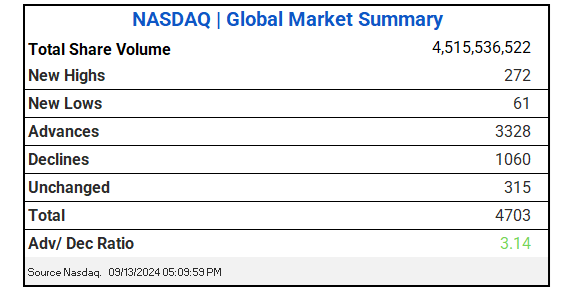
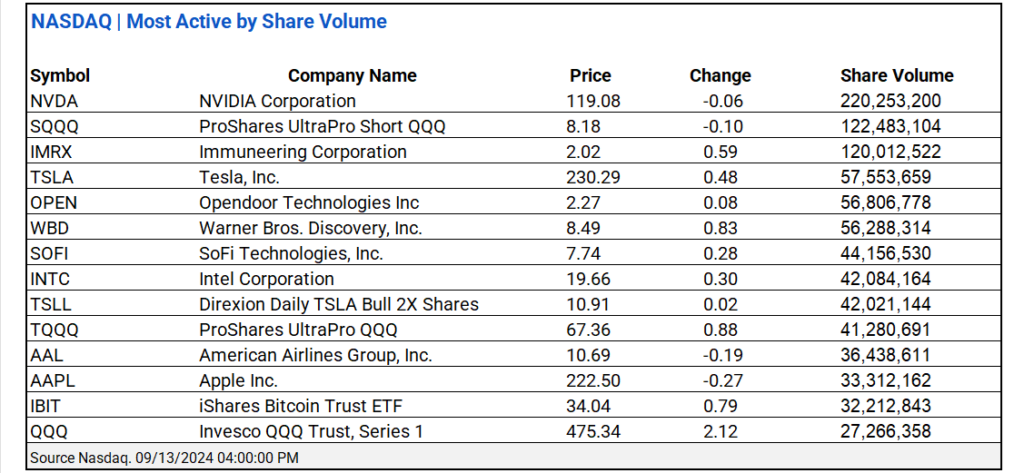
- NASDAQ saw 4.51B shares traded with a 3.14 advance/decline ratio. NVIDIA ^NVDA and ProShares UltraPro Short QQQ ^ SQQQ led share volume actives.
US Treasuries & Bond Markets:
- US Treasuries: Treasuries rallied across the curve with yields falling. The 10-year yield dropped 1.9 basis points to 3.659%, while short-term yields saw larger declines, including the 2-year at 3.593%. The market reflects cautious optimism amid potential rate cuts.
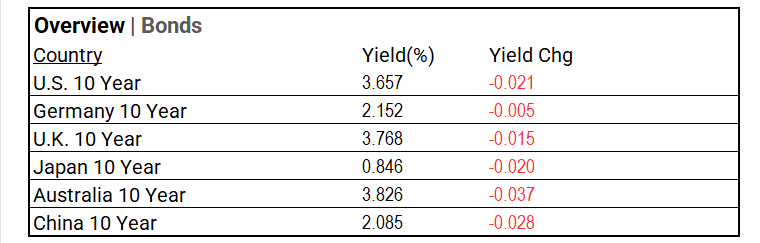
- Global bonds: Global bond yields generally fell, with U.S. 10-year yields down 2.1 basis points to 3.657%. Australia led declines, dropping 3.7 basis points. European and Asian yields also dipped, signaling broad market caution amid potential shifts in monetary policy globally.
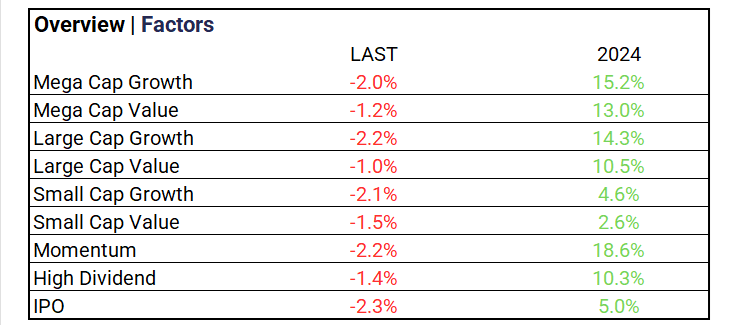
Market Factors:
- Today’s market saw broad declines across growth and value factors, with Mega Cap Growth down 2.0%, Large Cap Growth down 2.2%, and IPOs hit hardest at -2.3%, reflecting widespread risk-off sentiment.
Volatility:
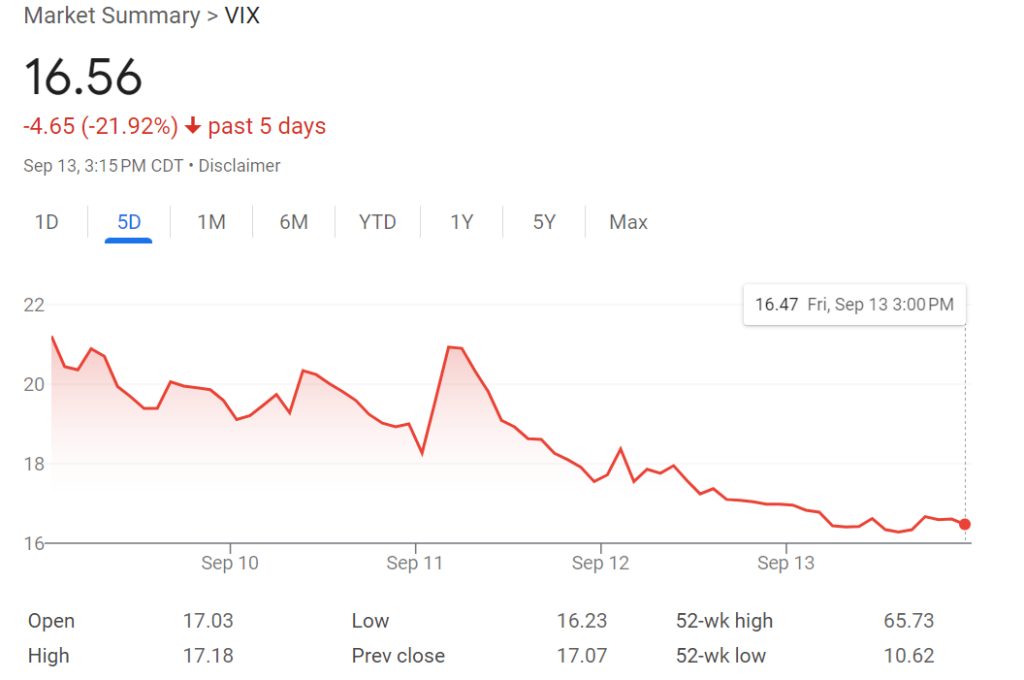
- VIX at 16.56 (-2.99%); The VIX Index declined 21.92% over the past five, indicating increased market stability and investor confidence.
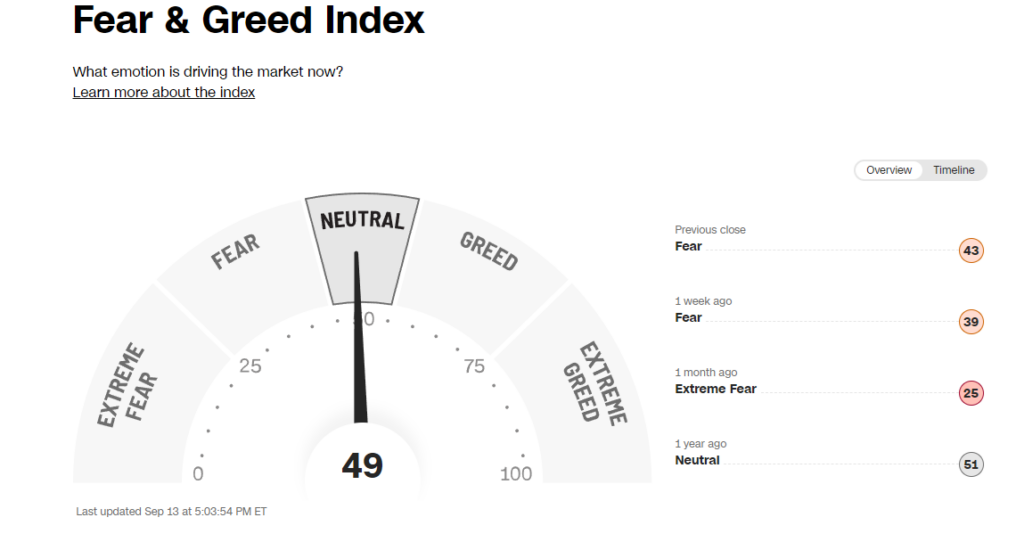
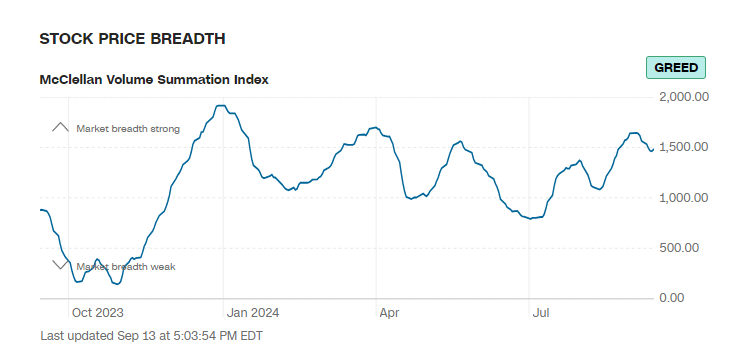
- The Fear & Greed Index rises to “Neutral”, MCV Index moderates at “Greed”.
Commodities & ETFs:
- Commodity markets displayed mixed movements today. Crude oil and Brent saw modest gains, gold increased by 1.02%, and silver advanced by 3.20%. Corn and wheat also rose significantly, while natural gas declined by 2.59%.
- ETF volume gainers: High-volume ETF gainers today include the Direxion Daily Small Cap Bull 3x Shares (+7.32% with 17.8M volume) and the Defiance Daily Target 1.75x Long MSTR ETF (+13.87% with 4.2M volume).
Cryptocurrency & Currency:
- Cryptocurrency: Aftermarket settling, Bitcoin USD was up 0.42% to $59,992, closing at $60,113.07, a 3.63% increase. Ethereum and Ripple saw minimal changes, with Ethereum up 0.12% and Ripple rising 0.11%. ZCash led with a 3.72% gain.
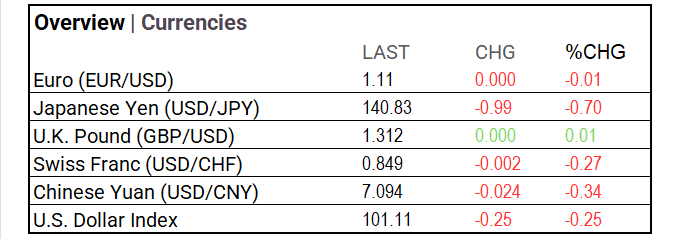
- Currencies: The U.S. Dollar Index fell 0.25% to 101.11. The Japanese Yen dropped 0.70%, while the Euro and Swiss Franc saw minor changes. The U.K. Pound and Chinese Yuan were relatively stable.
Stocks:
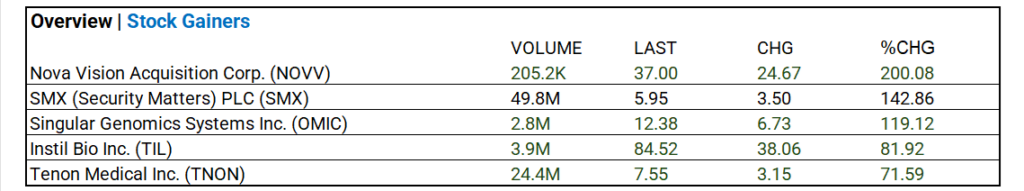
- Stock Advancers: SMX PLC saw a substantial volume of 49.8M shares and a notable 142.86% gain, highlighting significant investor interest and momentum.
Notable Weekly Earnings:
- Oracle (ORCL), Adobe (ADBE), and RH (RH) beat.
- Inditex ADR (IDEXY), Kroger (KR), and GameStop Corp (GME) miss.
Global Markets Summary:
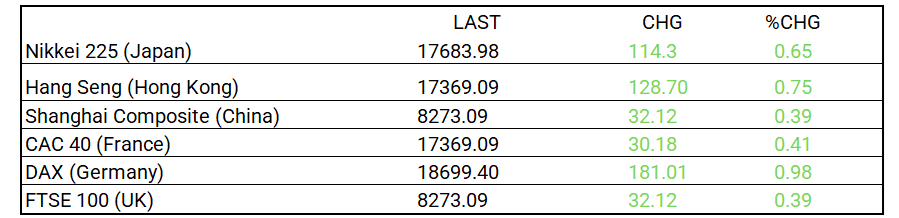
- Asian indices saw modest gains with the Nikkei up 0.65% and Hang Seng rising 0.75%. In Europe, the DAX led with a 0.98% increase, while other major indices posted smaller gains.
Historical Patterns and Market Impact September
- Election Years: The S&P 500 typically experiences a steeper average decline in September during election years. In election years, this drop becomes even more pronounced, with the index falling in 60% of Septembers. Historically, the VIX has been 10-15% higher in these Septembers compared to non-election years.
- Non-Election Years: The decline is less pronounced, reflecting lower uncertainty.
- Historical Average (1928-2023): September tends to be weak overall, with an average decline of 0.7%.
Strategic Investment Adjustments:
- Focus on long-duration bonds with leveraged ETFs like ZROZ (PIMCO 25+ Year Zero Coupon U.S. Treasury Index ETF) and EDV (Vanguard Extended Duration Treasury Index ETF) to gain on potential rate cuts. Nasdaq/Tech and growth sectors show strong long-term potential. Diversify with Russell 2000 ETFs and bank index ETFs. Election years historically boost market performance. Top Small-Cap ETFs Poised to Benefit: Vanguard Small-Cap Growth ETF (VBK), iShares Russell 2000 Growth ETF (IWO), iShares S&P Small-Cap 600 Growth ETF (IJT).
Strategic Investment Approaches
US Treasury Long Bond Opportunity
Small Cap Opportunities Fall 2024
In the NEWS
Central Banking, Monetary Policy & Economics:
- The Fed’s Rate-Cut Dilemma: Start Big or Small? – WSJ
- Lagarde Signals ECB Open to October Cut But December More Likely – Bloomberg
Business:
- DSV to Buy Deutsche Bahn’s DB Schenker Arm for Over $12 Billion – WSJ
- DirecTV, Dish Are in Talks Again to Merge Satellite-TV Businesses – Bloomberg
China:
- Developing | China’s economic activity softens in August as major figures miss projections – SCMP


