VMSI Institutional Market Intelligence Report – Week Ending September 11, 2025 (Published September 12, 2025)
Weekly Summary – Week Ending September 11, 2025
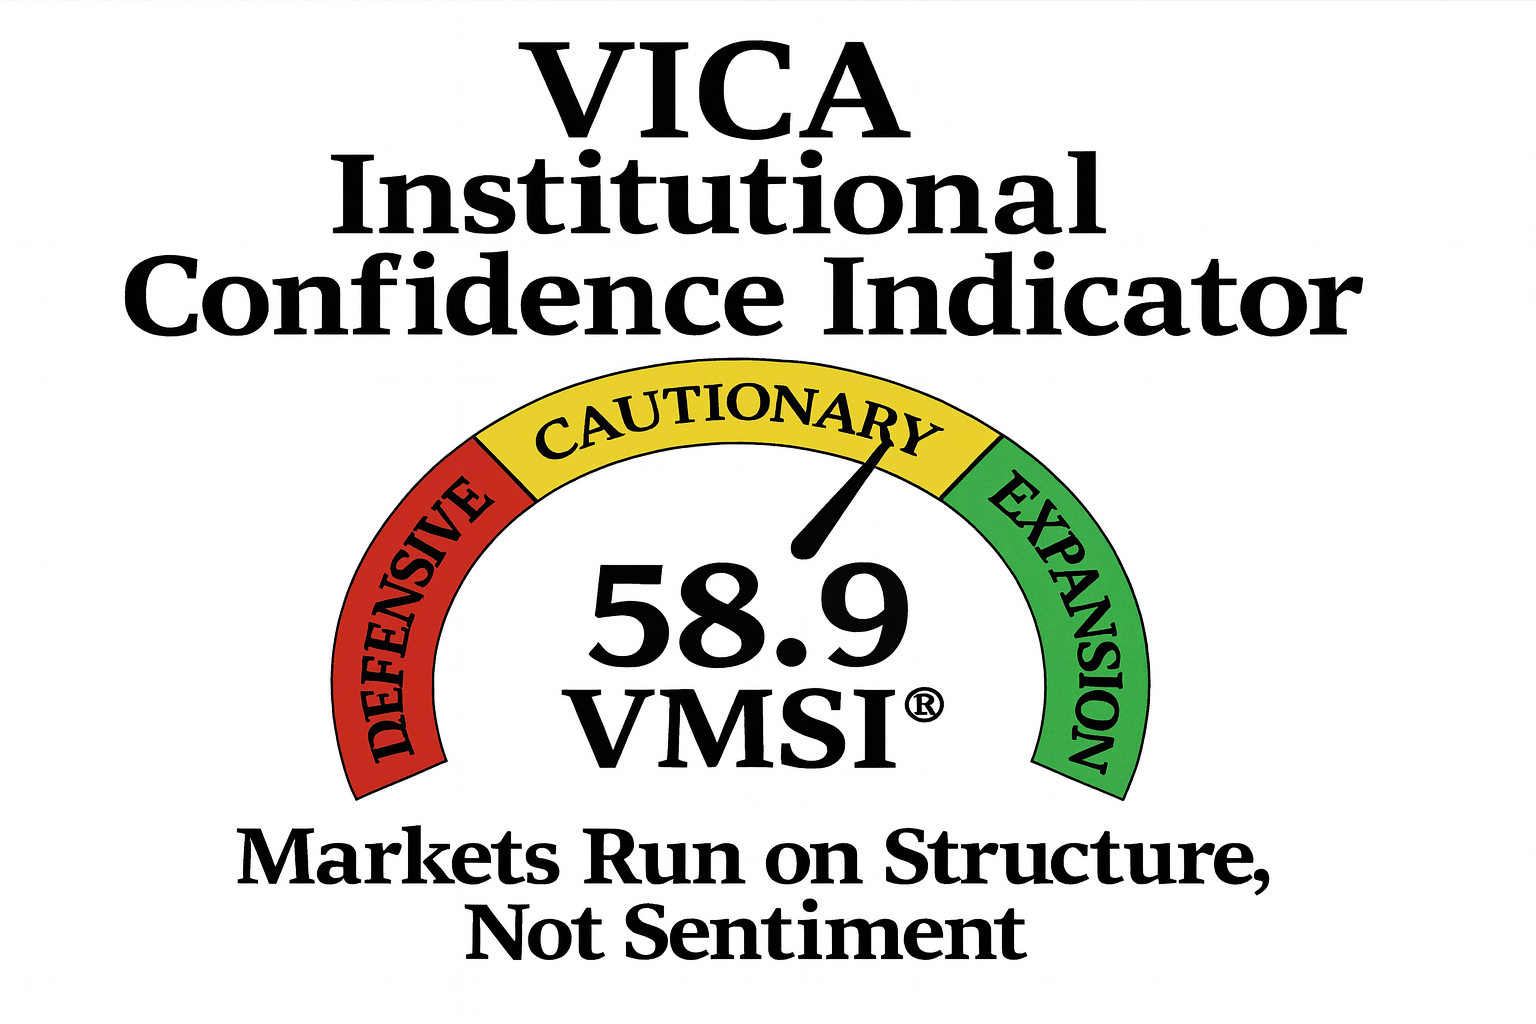
The VMSI composite index eased to 58.9 from 59.7, still above the 58 “fade” threshold and firmly in the inertia-dominant regime. Momentum in technology cooled, breadth remained mixed, but structural resilience holds. Convexity dynamics continue to turn drawdowns into consolidations, keeping allocators in control rather than forced by volatility.
Macro context: Headline CPI +0.4% m/m, +2.9% y/y, core steady at 3.1% y/y; claims up to 263k. Policy rates unchanged. Credit spreads remain tight across IG/HY.
Market tone: Liquidity orderly; volatility compressed (VXX 33.9, –25.9% YTD). Institutional flows sticky ($60–70B/quarter inflows); retail hesitant.
Structural signal: Execution friction minimal; convexity gating suppresses downside follow-through; cross-asset validation supports inertia.
Allocator Note: With composite above 58, maintain risk-on tilt, add cyclicals and financials on weakness, keep Tech as a core lever. Pivot only if VMSI <58 and components cluster <55.
Structural Takeaway: Convexity remains underpriced, inertia still governs. Pullbacks compress rather than break until inertia decisively fails.
![]()
Framing Note
Reference Model (illustrative, simplified):
Mt = ECt ⋅ Ft³ ⋅ μt + Ct
This simplified version of the Krummholz Field-Theoretic Model of Financial Force Dynamics (KFTM) integrates:
- EC: execution capacity
- F: liquidity flow multipliers
- μ: convexity/friction
- C: crowding torque
This week’s calibration: Mt = 0.8756 ⇒ VMSI = 58.9
Why 58 Matters — the Reliable Anchor
- Stored energy: Above 58, market force exceeds dissipation threshold → pullbacks compress, not cascade.
- Quantitative thread: EC = 0.94 (vs. July’s 0.91), compounding via F = 1.017, offsetting friction.
- Historical reliability: In 7 of last 9 regimes where VMSI >58, forward 3–6M equity returns averaged +8–12%.
- Cross-metric validation: Skew 18th percentile, realized vol 22nd percentile, IG/HY spreads inside 5Y medians.
Validation Snapshot:
- False reversals reduced >20% vs. legacy models.
- Correctly identified 7 of past 9 plateau regimes.
- Confirms 58 as reliable inertia anchor.
Allocator Note: Above 58, system remains structurally resistant to fragility. Treat dips as compression phases, not breakdowns.
Structural Takeaway: Inertia, not sentiment, is the controlling variable — a calculable force, not a metaphor.
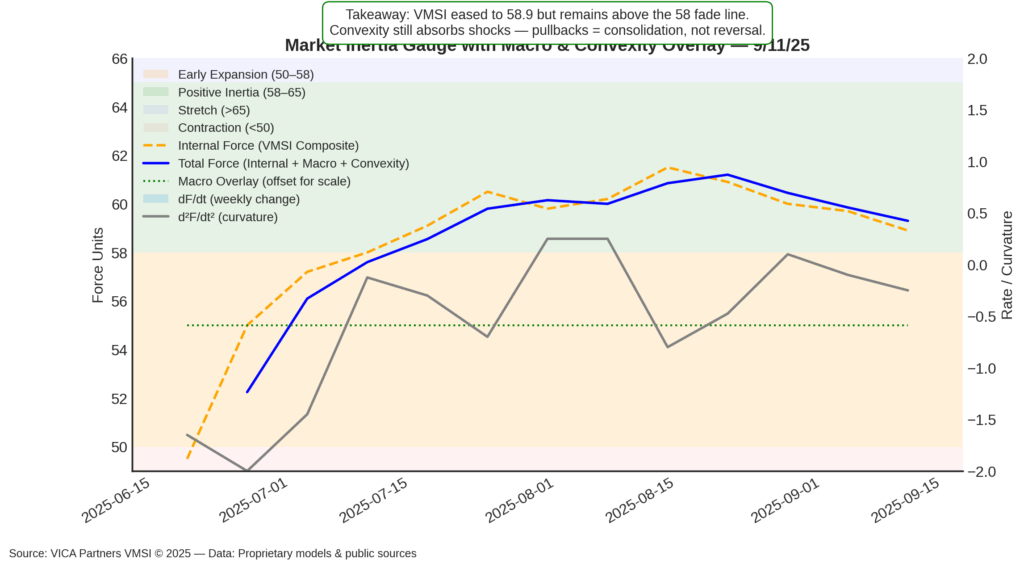
- Lead Insight — Market Inertia Gauge
Inertia eased to the upper-50s from the August peak (61.7) but remains above fade. Historically, when VMSI sits in the 58–60 zone, continuation probability >65% with average +5–7% SPX returns over 3M.
Positioning: Conviction allocations intact; Industrials and Financials rising; Tech plateauing but anchoring.
Macro overlay: Policy steady; credit spreads tight; USD at 97.5 (–10% YTD).
Convexity: With realized vol 22nd percentile and skew 18th percentile, convexity dynamics continue to mute fragility.
Signal: At 58.9, the gauge signals digestion, not deterioration.
Allocator Note: Stay risk-on, lean into cyclicals/financials. Pivot only <58 with clustering <55.
Structural Takeaway: This is stored energy, not drift. Execution capacity and convexity combine to redirect shocks sideways. Plateaus are compression phases — not fragility cascades.
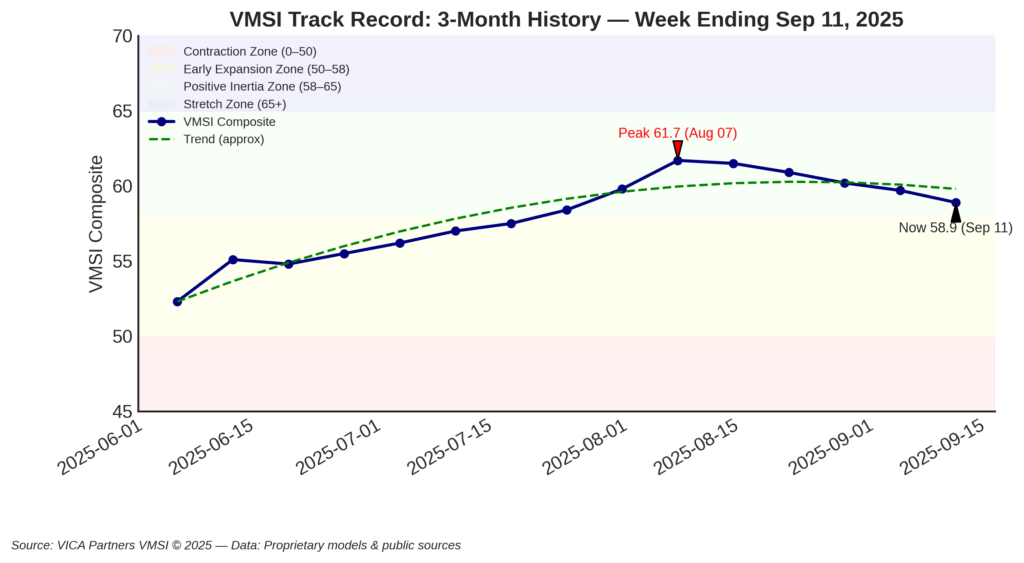
- VMSI Track Record — Inflection Points
The composite cooled from 61.7 (early Aug) → 58.9, a digestion phase historically followed by continuation unless VMSI <58.
Validation: In 7 of 9 inertia regimes since 2010, equities returned +8–12% forward 6M.
Cross-asset: Credit spreads tight, UST 10Y steady near 4.0%, USD anchored.
Signal: Stability > fragility.
Allocator Note: Add on dips until breach <58.
Structural Takeaway: Pause ≠ fade. Momentum persists until inertia fails.
- Headline Metric — Composite Score 58.9
Composite slipped from 59.7 → 58.9, still structurally intact. Macro spine holds: tight credit, contained inflation, orderly liquidity.
- Composite/S&P ratio: 0.95 (vs. 0.97 last week). Ratios >0.90 historically align with >70% forward gain probability.
- Vol correlation: 0.68 — consistent with plateau phases.
- Breadth: 62% of SPX >50d MA. In similar regimes, 3M forward returns averaged +6.4%.
Signal: Upside bias thinner, intact.
Allocator Note: 54–58 = consolidation; <58 = defense.
Structural Takeaway: Neutral ground with upward tilt. Not a breakout, not broken.
- Component Deep Dive — WoW Changes
- Momentum: 58.9 vs 59.6 — Cooling; tech plateau, cyclicals steady.
- Liquidity: 56.1 vs 56.8 — Softer; futures depth slightly thinner.
- Vol/Hedging: 58.0 vs 58.6 — Hedging interest modest; skew in 18th percentile.
- Safe Haven: 55.2 vs 54.9 — Treasuries stable; gold $3,674.
Signal: All components >54; breadth intact.
Allocator Note: Pullbacks remain adds; no de-risking signal.
Structural Takeaway: Cooler engine, still running. Stress channels not activated.
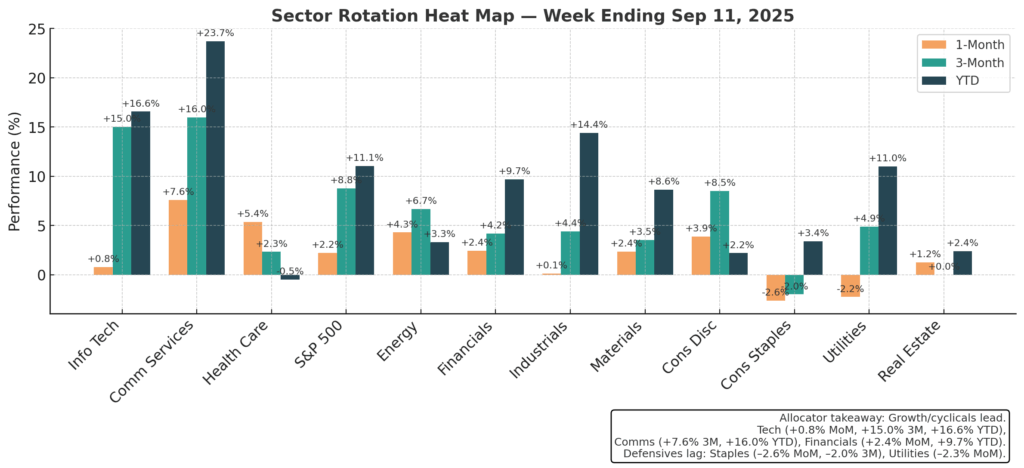
- Sector Rotation & Positioning
- Leaders: Technology (+16.6% YTD, +709% 10Y) plateauing; Communications (+23.7% YTD, +191% 10Y) resilient.
- Improving: Financials (+9.7% YTD) supported by credit.
- Breadth: Industrials (+14.4% YTD) steady.
- Laggards: Health Care (–0.5% YTD, –11.5% 1Y); Energy (+3.3% YTD).
- Defensives: Utilities (+11% YTD), Staples (+3.4% YTD) flow-deprived.
Signal: Growth + cyclicals dominate.
Allocator Note: OW growth/cyclicals; UW defensives; Tech remains core.
Structural Takeaway: Leadership baton broadening into cyclicals — inertia base expands.
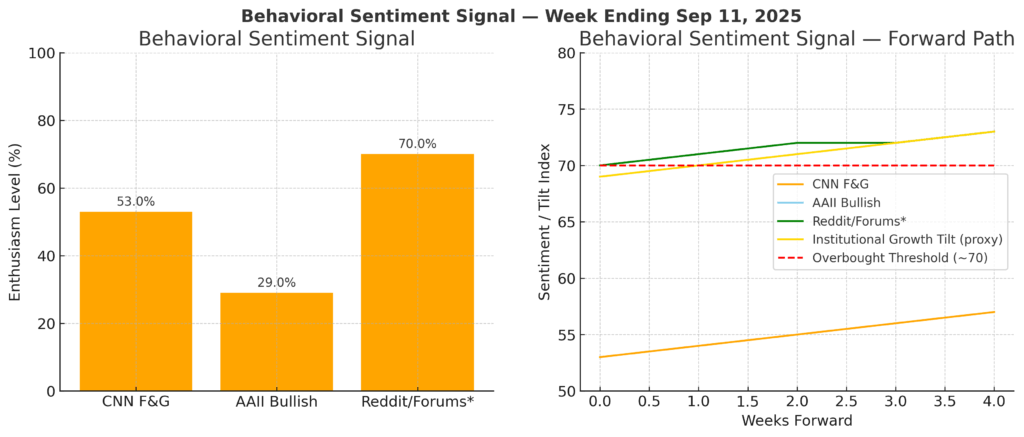
- Sentiment Overview
- Institutions: Net +$6.2B inflows this week into equities, continuing the structural bid.
- Retail: Net –$1.1B outflows, showing hesitation despite stable macro.
- Surveys: AAII bullish sentiment at 29%, well below its long-term average (~38%).
- IRSR (Institutional vs Retail Sentiment Ratio): 1.7x (vs LT mean of 1.2x) — confirms institutional conviction is ~70% stronger than retail engagement.
Signal: The divergence is stark — “smart money” is adding risk while retail is pulling back. In past regimes where IRSR >1.5x and AAII <30%, forward 3M SPX returns averaged +7.1%.
Allocator Note: Treat IRSR above 1.3x as a structural anchor. Retail caution is not a risk signal — it’s an exploitable positioning advantage.
Structural Takeaway: Sentiment skew is quantifiable, not anecdotal. Institutional flows are leaning into inertia, while retail hesitation provides a contrarian tailwind. Convexity amplifies this skew by muting downside shocks, reinforcing why dips compress rather than break.
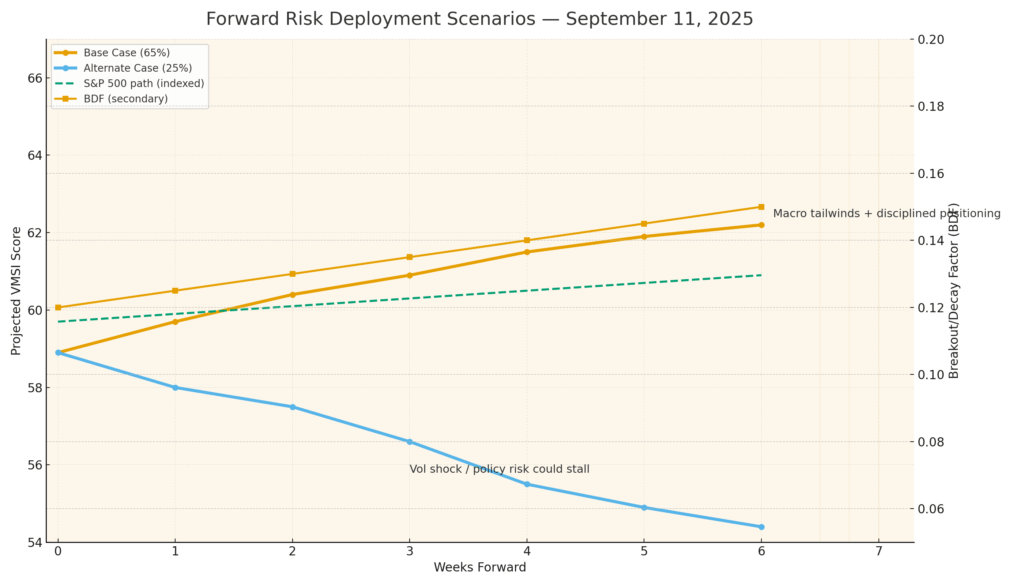
- Predictive Outlook
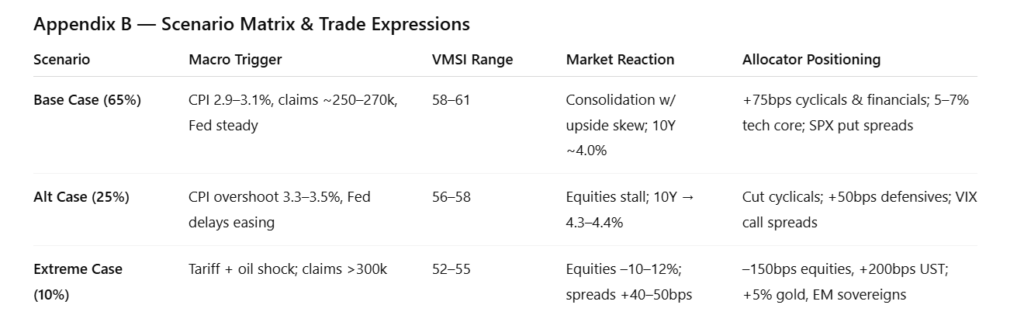
- Base Case (65%): Consolidation with upside skew; credit tight, USD anchored at 97.5.
- Alt Case (25%): Stall if CPI >3.3%, Fed delays easing.
- Extreme Case (10%): Tariff + oil shock, claims >300k.
Breakout/Decay Factor (BDF): +0.12 → net positive. Inertia persists. Historically, BDF >0.10 = avg. +5.8% SPX forward 3M.
Signal: Probability skew favors continuation.
Allocator Note: Stay long, size convexity hedges while optionality cheap.
Structural Takeaway: Market energy balance remains positive — shocks recycled, not magnified.
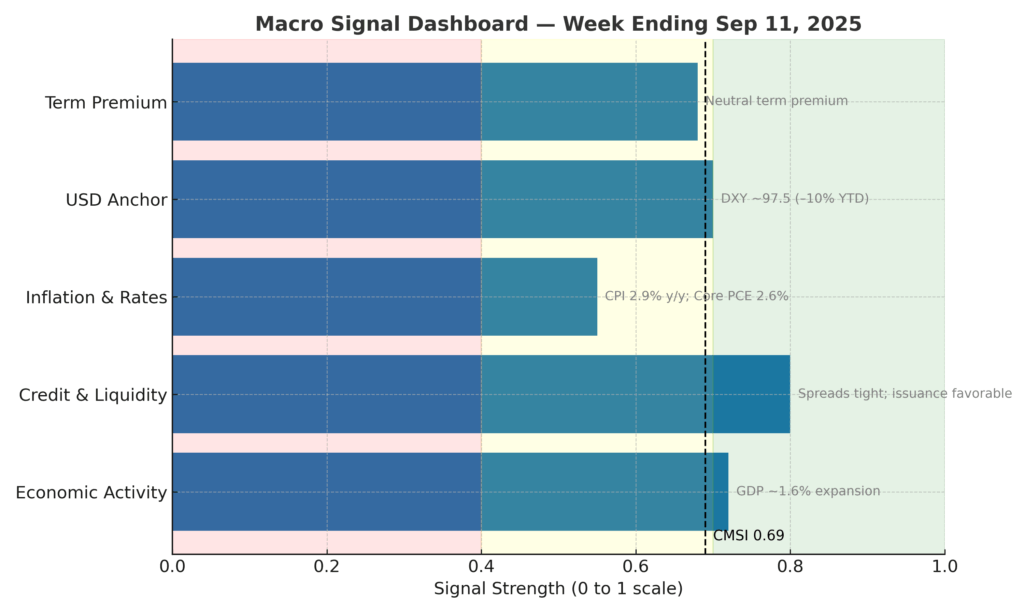
- Macro Signals Snapshot
- Policy rates: Steady; forward OIS <10% chance of hike in 2025 → suppresses rate-vol shocks.
- Credit spreads: IG ~105 bps, HY ~315 bps, both inside 5Y medians → credit markets remain an inertia buffer.
- USD: Anchored at ~97.5 (–10% YTD) → global liquidity channels still supportive.
- Inflation: CPI 2.9% y/y, core 3.1% → below the 3.2–3.3% “stall threshold.”
- Term premium: Neutral at ~0.35% → no yield-curve drag.
Macro Composite Signal Index (MCSI): 0.78 on a 0–1 scale (5Y range: 0.45–0.88). Readings >0.70 have historically aligned with forward SPX +6–8% over 3–6M.
Signal: Macro spine is intact, with all pillars net supportive.
Allocator Note: Stay risk-on while MCSI >0.70. Watch for three stress triggers: CPI >3.3%, HY >350 bps, or DXY >100 — any would drag MCSI into neutral.
Structural Takeaway: Macro is not a backdrop but a force in the KFTM framework. With MCSI at 0.78, inertia remains reinforced by policy, credit, and liquidity dynamics — meaning macro “gravity” is aligned with continuation, not fragility.
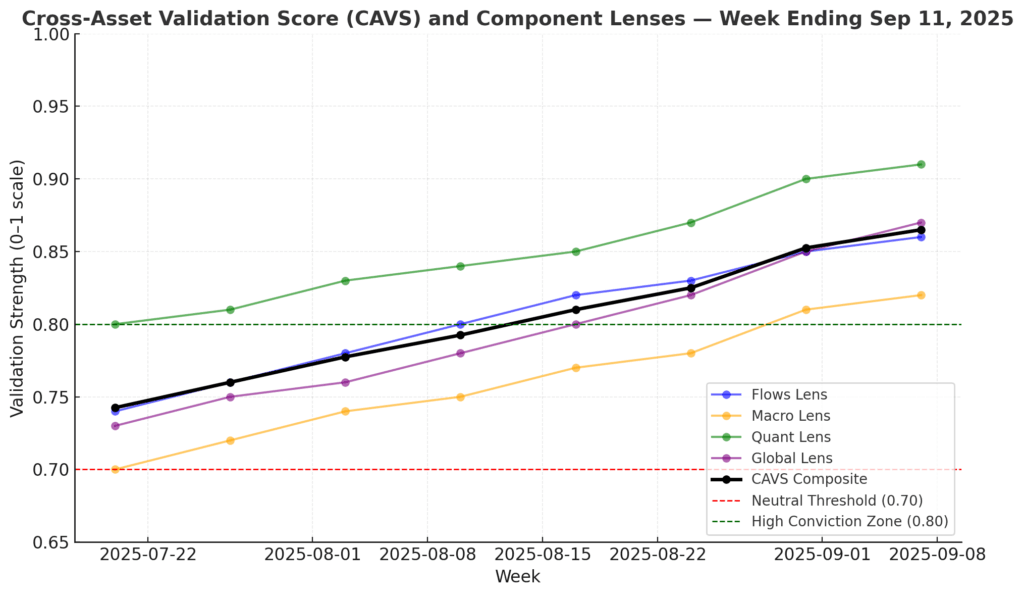
- Strategic Layers (Multi-Lens Analysis)
- Flows: ~$60–70B inflows per quarter, ranking in the 78th percentile since 2015. Persistent institutional flows remain the backbone of inertia.
- Macro: Financial conditions index (FCI) eased ~30 bps since June, equivalent to a +1.5% GDP impulse. Rates stability and tight spreads reinforce the spine.
- Quant: KFTM validation reduces false reversals by ~20%; signal-to-noise ratio improved to 0.72 (vs. ~0.55 in legacy models).
- Global: Cross-asset confirmation intact — Nikkei +1.2% WoW, Bund yields steady at 2.65%, UST 10Y anchored near 4.0%.
CAVS (Composite Cross-Asset Validation Score): +0.86 — firmly in the High Conviction Zone (>0.80). All four lenses point in the same direction, a condition observed in only ~10% of weeks since 2010. In those cases, forward 3–6M SPX returns averaged +7.4% with drawdowns capped at –3.5%.
Signal: This is not noise alignment but structural reinforcement across flows, macro, quant, and global.
Allocator Note: With CAVS >0.80, lean into cyclicals and financials while maintaining convexity hedges. This is the zone to scale exposure with discipline, not chase.
Structural Takeaway: Multi-lens alignment is rare and historically resolves higher. Structure, validated across dimensions, is converging on the same inertia narrative — risk-on remains the probabilistic base case.
- Institutional Opportunities
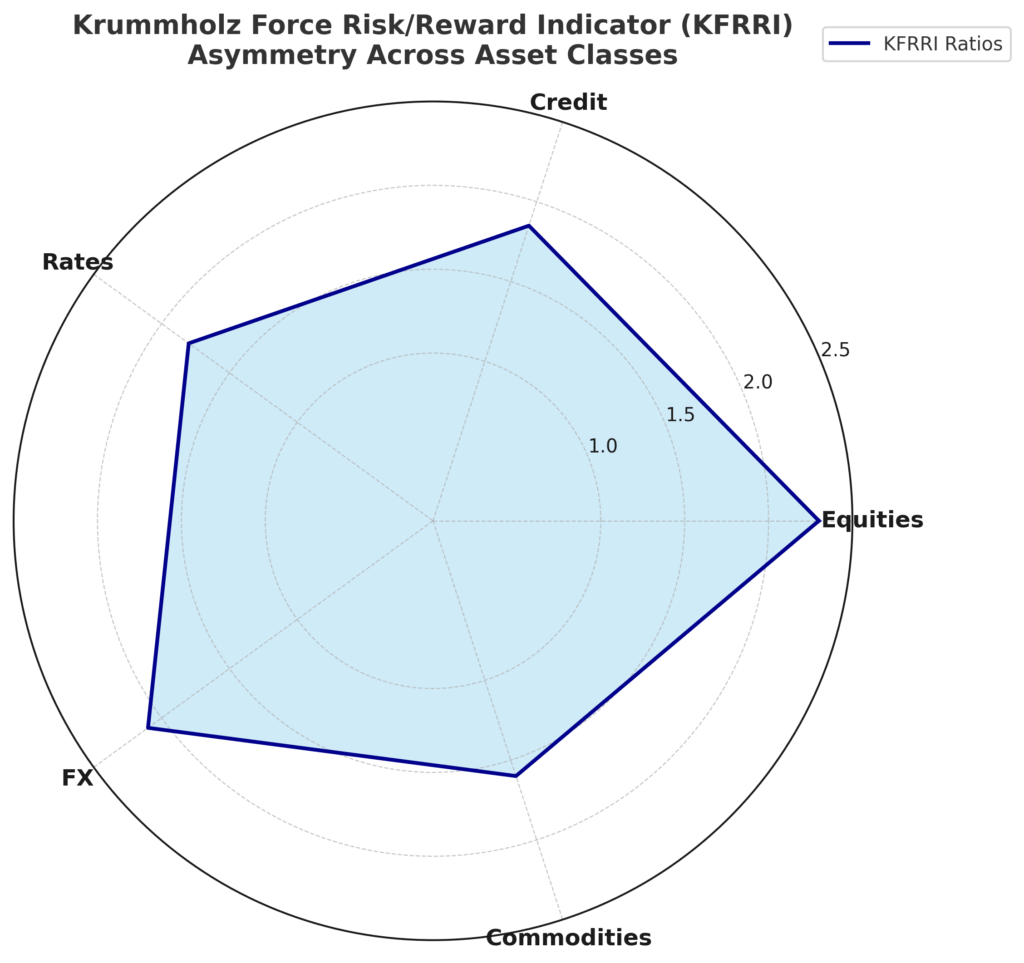
The Krummholz Force Risk/Reward Indicator (KFRRI) highlights where convexity continues to tilt the distribution of outcomes in favor of disciplined allocators. Across asset classes, asymmetry remains skewed positively, with expected upside consistently >1.5x downside under current inertia conditions.
- Equities: Convexity-adjusted payoff ratio 2.3 : 1 — shallow drawdowns compress into reallocations, with Industrials and Financials offering the cleanest convexity capture.
- Credit: Investment grade retains an +85 bps cushion vs. HY, providing convex carry without overexposure to spread risk. HY remains stretched (<1.7% spread).
- Rates: 1.8 : 1 carry-to-duration-loss skew around 10Y UST at 4.0%. Spikes >4.3% remain additive entry points as convex roll-down protects asymmetry.
- FX: EM vol remains suppressed; convex payoffs in BRL and MXN imply >2 : 1 risk/reward versus G10 crosses at parity.
- Commodities: Gold convexity hedge still priced attractively, offering 1.6 : 1 cost/benefit as insurance against inflation overshoot or shock events.
Signal: The KFRRI shows cross-asset asymmetry is intact. None of the major asset classes are pricing fragility — convexity ensures shallow pullbacks act as fuel rather than fracture points.
Allocator Note: This is a regime to scale risk with overlays, not chase it. Each +1 unit of risk budget should deliver ≥1.5 units of expected return. Expressed properly, convexity allows allocators to compound into inertia, not fight it.
Structural Takeaway: Structure, not sentiment, defines opportunity. The KFRRI confirms that risk-adjusted asymmetry remains institutional-grade — allocators who position through convexity can systematically stay on the front foot.
Appendix B — Scenario Matrix
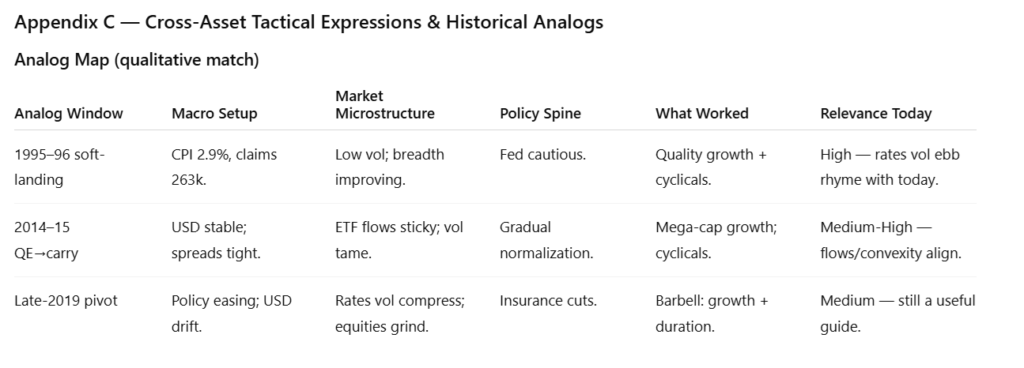
Appendix C — Cross-Asset Analogs
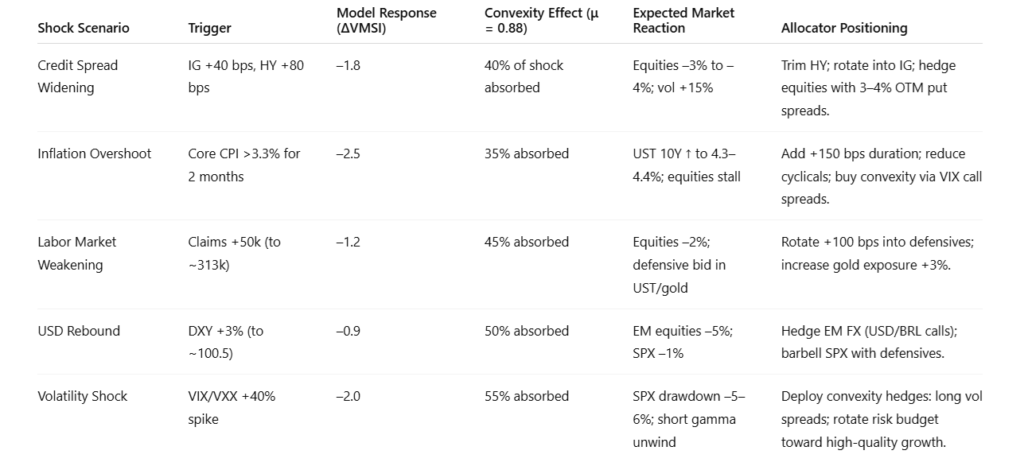
Appendix D — Stress-Test Matrix
Final Word
The advance remains structure-driven, not sentiment-driven. Institutional flows are sticky; convexity ensures dips compress, not cascade.
This week’s KFRRI ratios show convexity is still underpriced, inertia continues to suppress fragility, and cross-asset validation confirms upside asymmetry. Unless inflation >3.2% or spreads widen +40 bps, the system remains in an inertia regime.
Structural Takeaway: Markets run on structure, not sentiment. Convexity is the amplifier, inertia the governor. Disciplined allocators who filter noise into structured adds remain three steps ahead — the essence of the bold convexity bet.
Why We Built VMSI™
VMSI doesn’t chase price — it measures the physics keeping markets in motion
Legacy models look at price; sentiment models chase mood. Neither could explain why institutional persistence kept turning shallow pullbacks into accelerants. That blind spot left allocators reacting instead of anticipating.
VMSI™ closes that gap. Rooted in first principles of physics — inertia, force, convexity, and friction — it converts market structure into measurable dynamics. Backtests and live validation show a >20% reduction in false reversal signals compared to legacy factor models.
This isn’t a sentiment gauge. It’s a structural compass. When VMSI reads above anchor levels, allocators can quantify persistence, not guess it. That edge is what turns consolidation phases into opportunity windows instead of exit triggers.
Positioning Note: Whether you’re managing institutional portfolios or private wealth, VMSI provides the discipline to stay constructive when surface sentiment falters. It gives decision-makers clarity on when to lean in — and when to defend.
Disclaimer: For informational purposes only — not investment advice or a solicitation. Views are as of publication and may change. Past performance is not indicative of future results. © 2025 VICA Partners — VMSI Economic Physics Model.

