
U.S. Economic Reports Series: Personal Consumption Expenditures (PCE) Indexes
Key Highlights
Preferred Measure:
- The Federal Reserve’s preferred measure of inflation is the Personal Consumption Expenditures (PCE) Price Index, specifically the Core PCE Price Index.
Inflation Target:
- The Fed aims for a long-term inflation target of 2% as measured by the Core PCE Price Index.
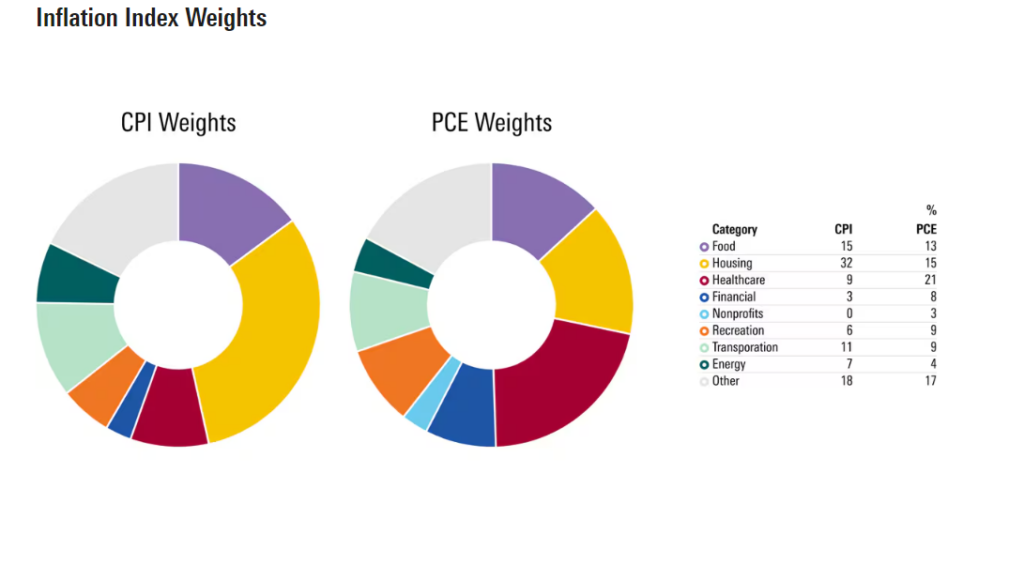
Comprehensive Coverage:
- The PCE Price Index encompasses a broader range of goods and services than the Consumer Price Index (CPI), providing a nuanced perspective on consumer spending patterns.
Adjustments for Substitution:
- It adjusts for consumer behavior changes, such as substitutions between goods and services in response to price fluctuations, which the CPI does not fully capture.
Incorporation of Healthcare Costs:
- Includes healthcare costs paid by employers and the government, offering a comprehensive view of price changes affecting households.
Methodological Differences:
- Utilizes varying weights for components to better align with the Fed’s economic assessments, enhancing its relevance for policy-making.
Personal Consumption Expenditures (PCE) Data Sets
Key Data Sets:
- PCE Price Index, Personal Consumption Expenditures, Real PCE, PCE Deflator, PCE Components.
Usage:
- Economic trend analyses, policy formulation, and economic forecasting.
Contemporary Criticisms of PCE Index for Inflation Forecasts
Complexity:
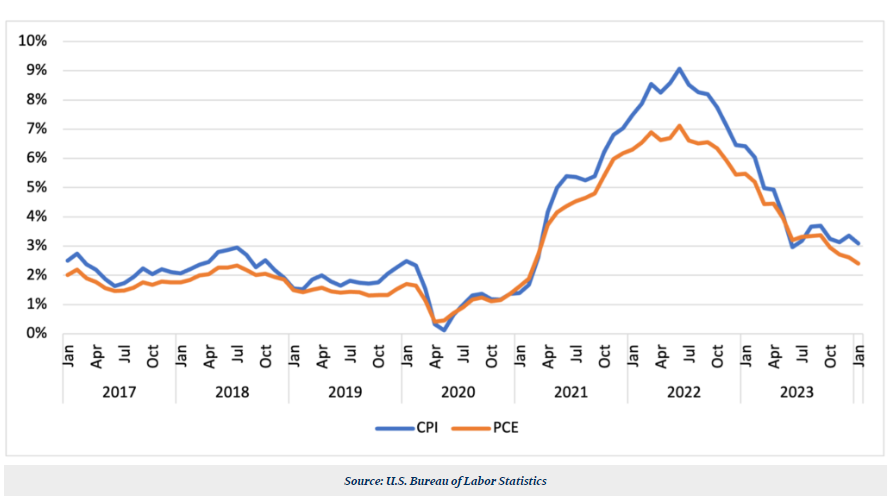
- The index’s breadth introduces complexity, reflecting diverse spending patterns across income levels and regions, which can complicate interpretation compared to the CPI’s narrower focus. Over seven years, CPI inflation averaged 54 bps higher than PCE.
Adjustments for Substitutions:
- Methodological adjustments account for real-world consumer behavior, leading to less predictable inflation readings compared to the CPI’s assumption of fixed consumption patterns.
Revisions:
- Subject to revisions based on updated data and improved estimation methodologies, introducing initial forecast uncertainties influenced by data source updates and seasonal adjustments.
The Long-Term Inflation Target of 2%
Historical Precedent:
- Central banks, including the Fed, historically target a 2% inflation rate to maintain price stability conducive to sustainable economic growth. The FOMC’s 2% inflation target, announced in 2012, guides monetary policy and anchors inflation expectations. Updated in 2020, it allows moderate inflation above 2% after low periods, reflecting a more flexible approach.
Economic Stability:
- Moderate inflation (around 2%) promotes consumer spending and guards against deflationary pressures, supporting overall economic vitality.
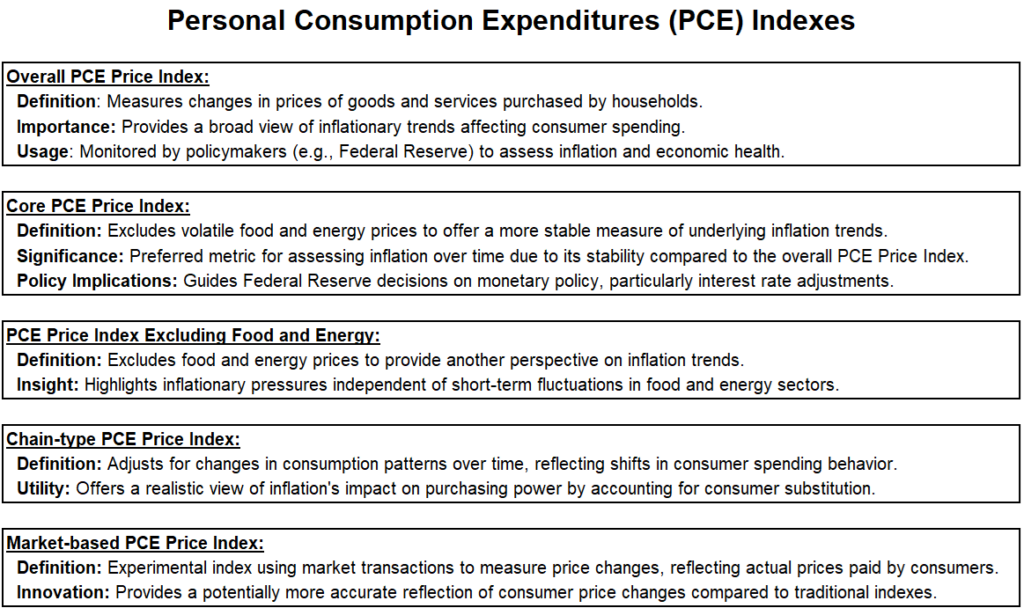
Core PCE Index
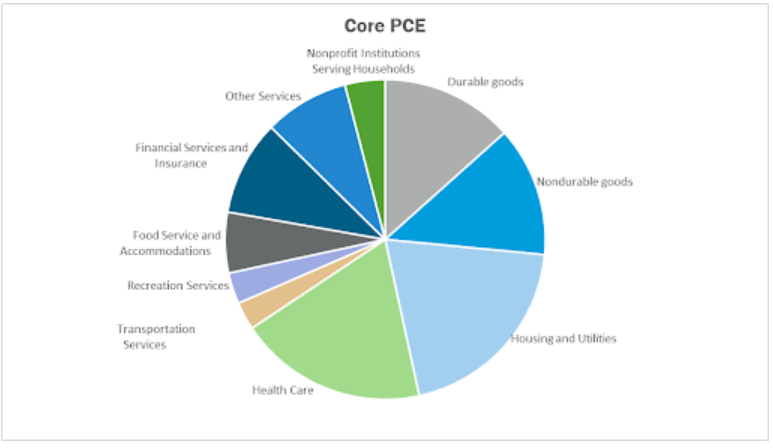
Definition:
- Excludes volatile food and energy prices to provide a stable measure of underlying inflation trends.
Realism of Achieving the Target
Factors Influencing Target:
- Economic conditions, productivity growth, and fiscal policy dynamics influence the attainment of a sustained 2% inflation rate.
Policy Adjustments
Monetary Tools:
- The Fed employs interest rates and quantitative easing to calibrate economic conditions towards achieving inflation targets.
Public Expectations
Influence on Behavior:
- Public and market expectations of inflation around the target rate shape economic decisions and financial market behaviors.
Press
Challenges in Understanding:
- Journalistic interpretations of economic concepts face challenges due to the complex nature of monetary policy.
Inflation Data Overview
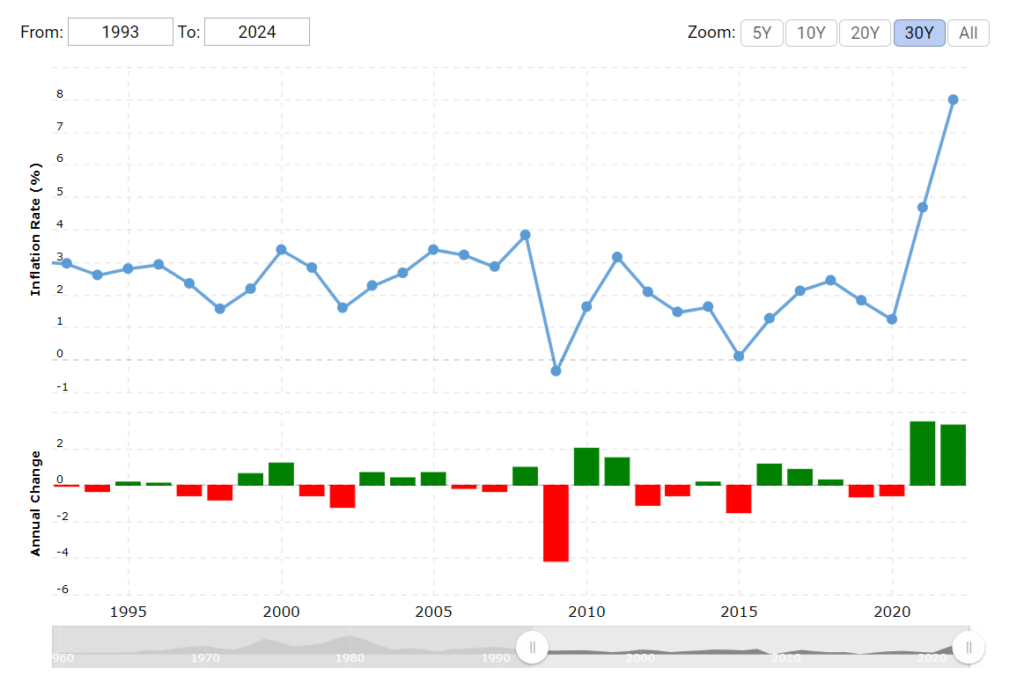
Recent Data:
- As of May 2024, the annual inflation rate measured by the Core PCE Price Index moderated to 3.3% from earlier peaks, influencing the Fed’s policy deliberations.
Market Implications
Fed Policy Decisions:
- Interest rate adjustments hinge on Core PCE trends, aiming for balanced economic growth.
Investor Insights:
- Market expectations regarding future Fed actions are significantly shaped by Core PCE dynamics.
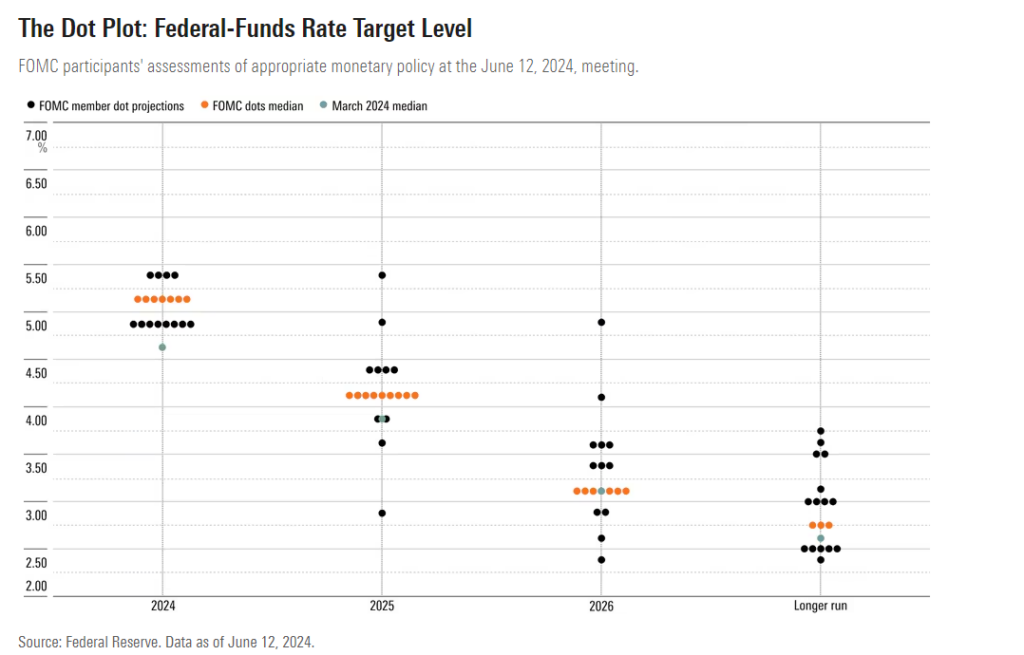
Current Market Odds of Rate Cuts in 2024
Rate Cut Expectations:
- Anticipation of rate cuts by September 2024 decreased to 56%, reflecting evolving economic data dynamics.
Conflicting Data:
- Strong job growth contrasts with inflation above target, presenting policy decision complexities.
Political Implications of Fed Decisions
Fed Strategy:
- Historical prudence in rate adjustments amidst economic indicators’ varied signals.
Value of the Core PCE Price Index
Timeliness:
- Monthly releases by the BEA offer timely insights into inflation trends.
Market Indicator:
- Significant influence on financial markets, predicting economic trajectories and impacting investment strategies.
Coverage:
- Comprehensive insights into goods and services pricing changes, supporting informed economic analyses.
Criticisms
Exclusion of Food and Energy:
- Critiques argue that excluding these essential items may distort inflationary perceptions.
Volatility and Stability Concerns:
- Sector-specific fluctuations, such as in healthcare, pose challenges to inflation assessment stability.
Complexity in Interpretation:
- Comprehensive coverage complexities may obscure straightforward economic forecasting and policy-making.
Exploring Market Insights with Options
Volatility Adjustments:
- Index releases prompt market volatility, influencing inflation-sensitive sectors.
Interest Rate Expectations:
- Core PCE trends inform investor expectations, shaping interest rate forecasts and investment strategies.
Market Sentiment:
- Index fluctuations impact investor confidence and economic outlook assessments.
Sector-Specific Impacts:
- Varied sector responses to inflationary changes affect investment allocation strategies.
Hedging Strategies:
- Options are utilized to mitigate inflation-driven market volatility risks.
Conclusion
Challenges and Utility:
- Balancing comprehensive coverage with methodological challenges is key for accurate economic forecasting using the PCE Index.


