VICA Research — Volatility & Market Sentiment Index (VMSI©)
“Directional force is building across the tape — but not indiscriminately. Capital isn’t chasing — it’s calibrating. Institutions are moving first, with velocity, precision, and a strict time-cost bias.”
— Matthew Krumholz, CEO, VICA Partners
Institutional Summary
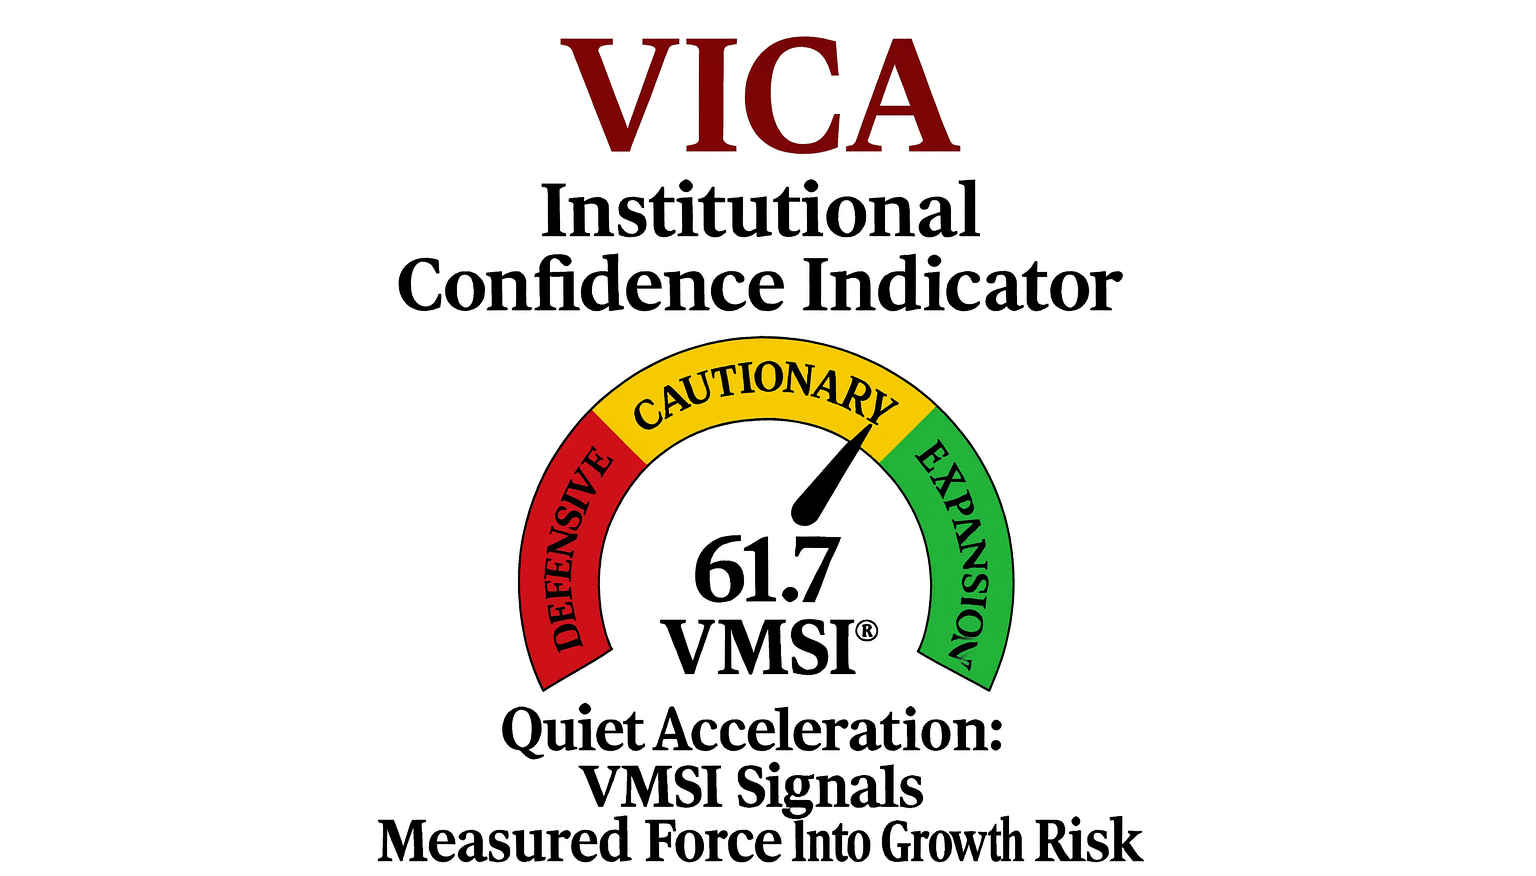
• Composite VMSI rises to 61.7 — highest this year
• Momentum confirms leadership handoff to mid-cap cyclicals
• Volatility and hedging overlays thinning further
• Retail sentiment tilting speculative
• Macro signals diverging — exposure remains selective
• All forward triggers remain active
Weekly Market Snapshot
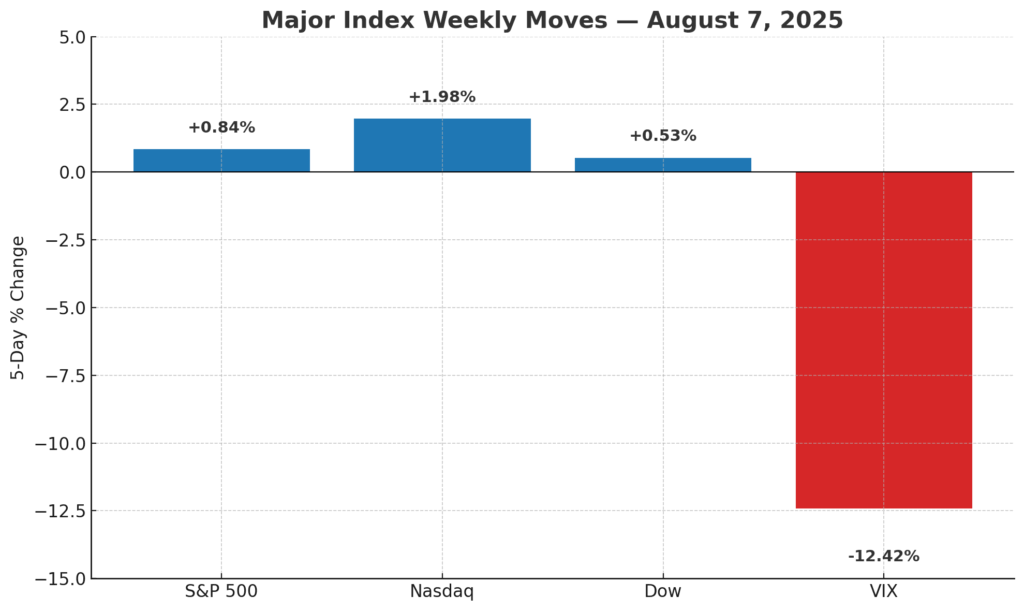
5 Day Index Performance (Week Ending August 7, 2025):
S&P 500 +0.84% | Nasdaq +1.98% | Dow +0.53% | VIX -12.42%
Interpretation:
Markets continue to rotate with deliberate precision, not exuberance. The VIX’s 12% decline reflects compressing volatility regimes — reinforcing a backdrop of engineered inertia, where capital moves with time-calibrated conviction. Equity benchmarks drift higher, not from passive lift, but from structured allocation into risk forward sectors, guided by institutional discipline and macro-stabilized conviction.
VMSI Composite Score
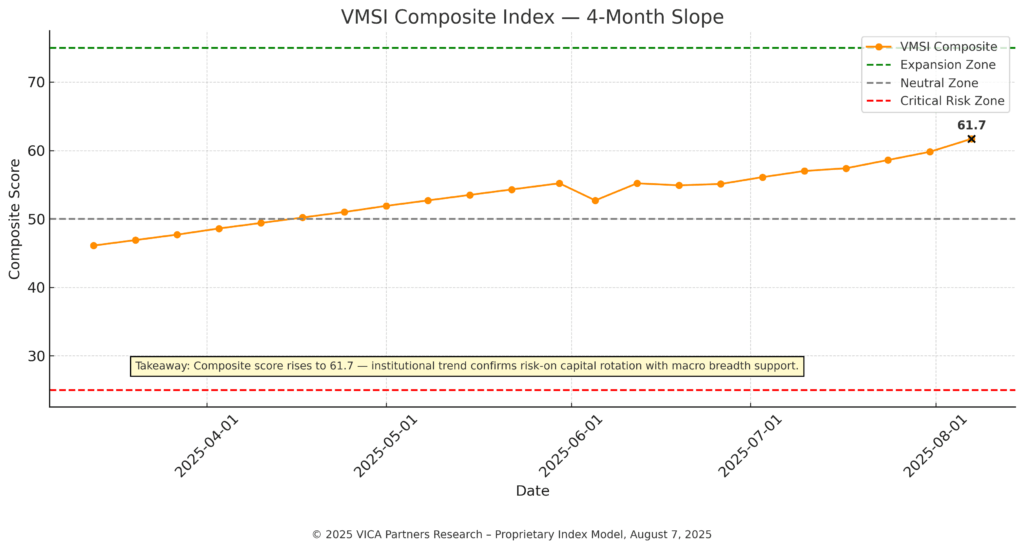
VMSI: 61.7 — Highest print since early 2022.
The index confirms conviction-weighted institutional participation across risk factors. Capital is not rotating indiscriminately — it is entering with structure, pace, and sensitivity to underlying volatility compression and credit stability.
Technical Note:
The current slope of the composite (+6.6 points over five weeks) matches prior inflection zones observed in Q1 2021 and late 2019 — historically precursors to medium-term upside extensions.
Takeaway:
Positioning strength is structural, not tactical. Institutions are pressing their advantage through deliberate risk-on exposure. No evidence of crowding or overextension — only sustained alignment across macro, credit, and positioning signals.
VMSI Sub-Component Breakdown
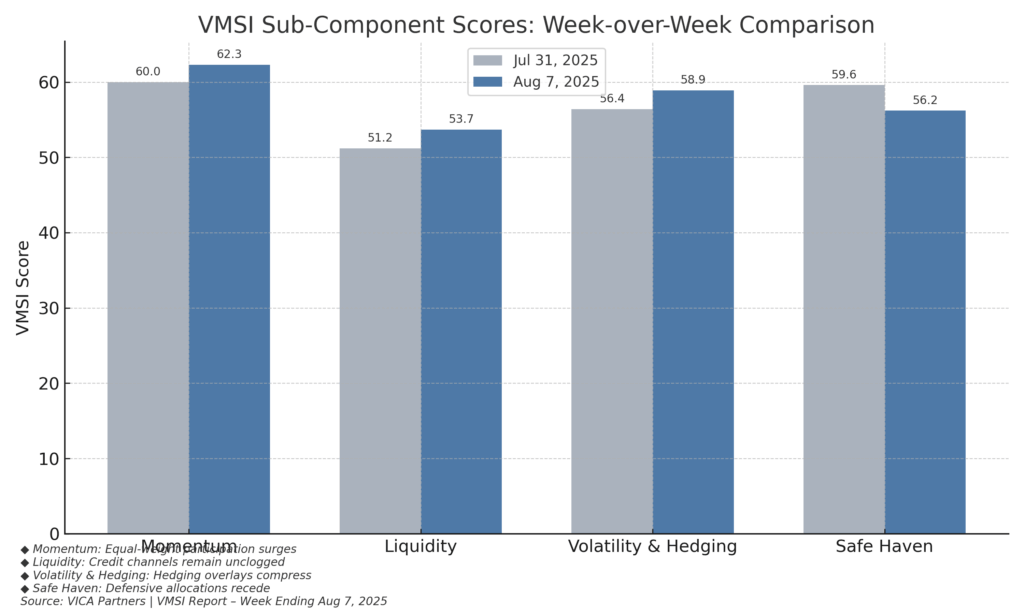
All four signals advanced again this week, led by gains in Momentum and Volatility & Hedging. Liquidity also improved modestly, while Safe Haven flows moderated as macro confidence firmed.
Takeaway:
The broad-based lift reflects deliberate institutional participation. Momentum and liquidity trends are deepening — but remain rotational, not reactive. Safe haven easing confirms risk appetite, though without chasing. Strategic accumulation persists, confirming an environment of steady capital engagement, not speculation.
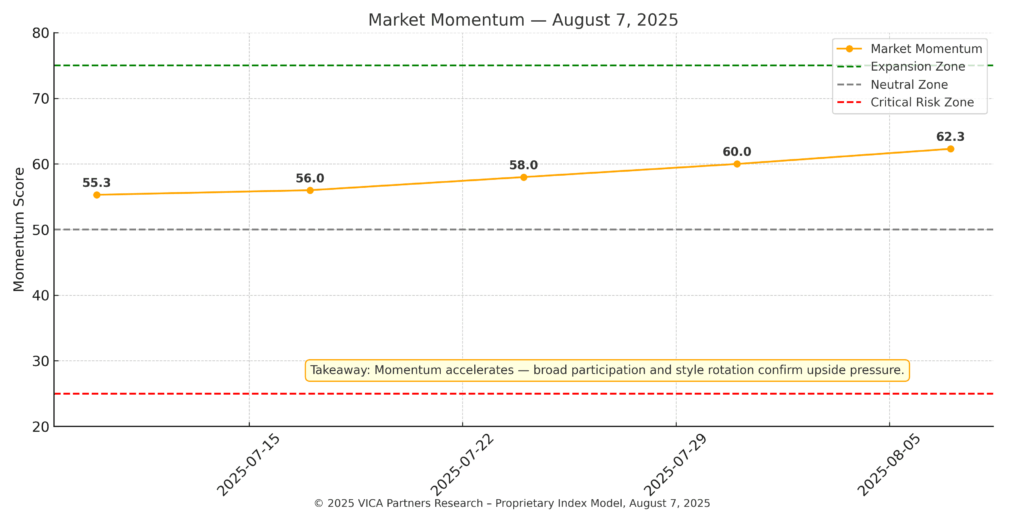
◆ Momentum
Score: 62.3 — up from 60.0 last week.
Flow Signal:
Leadership broadens meaningfully. Equal-weight indices continue to outperform megacaps, with sustained follow-through in industrials, mid-cap tech, and cyclicals. Style rotation into mid-cap growth accelerates. Relative strength confirms institutional appetite is increasing — steadily and with breadth.
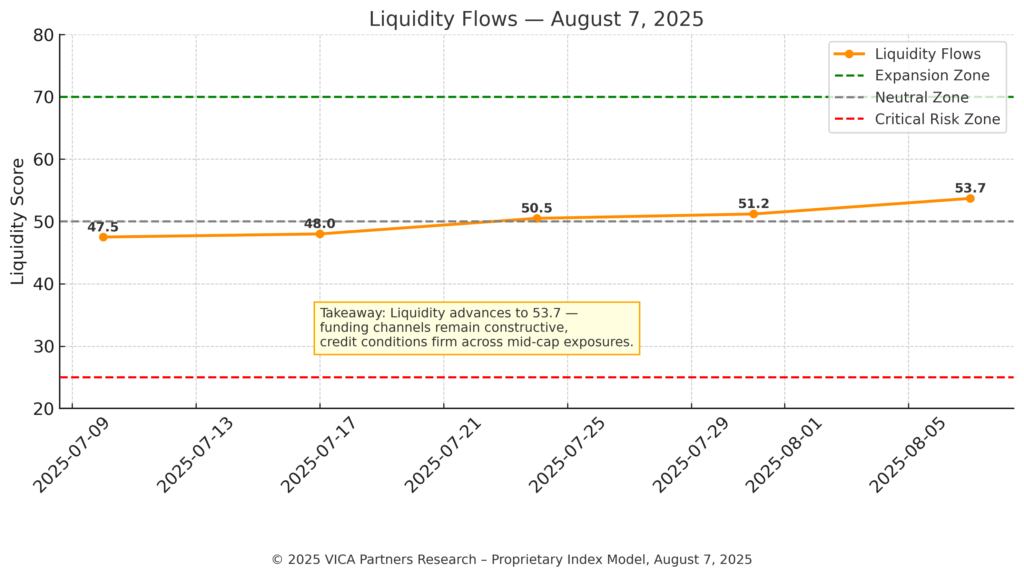
◆ Liquidity
Score: 53.7 — up from 51.2 last week.
Allocation Cue:
Risk absorption strengthens. Credit spreads remain compressed, particularly in high-yield and floating-rate credit. ETF flows into cyclical and duration-sensitive vehicles show macro confidence holding. Liquidity conditions reflect healthy depth — steady, not speculative.
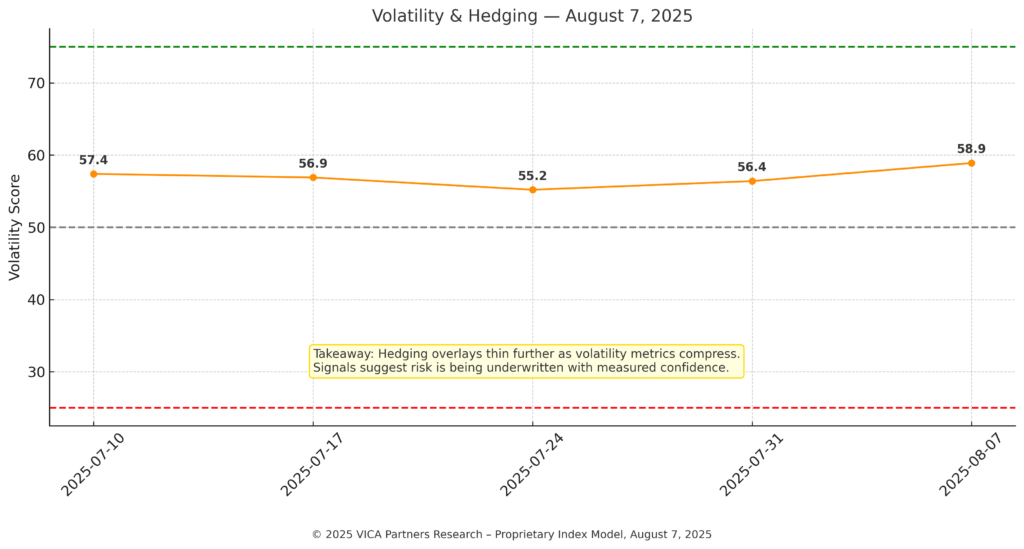
◆ Volatility & Hedging
Score: 58.9 — up from 56.4 last week.
Risk Pulse:
Hedging overlays continue to decline. VIX remains subdued, and VVIX compression signals low demand for tail-risk insurance. Skew flattens further, and realized vol remains rangebound. Positioning reflects increasing institutional confidence — controlled, not complacent.
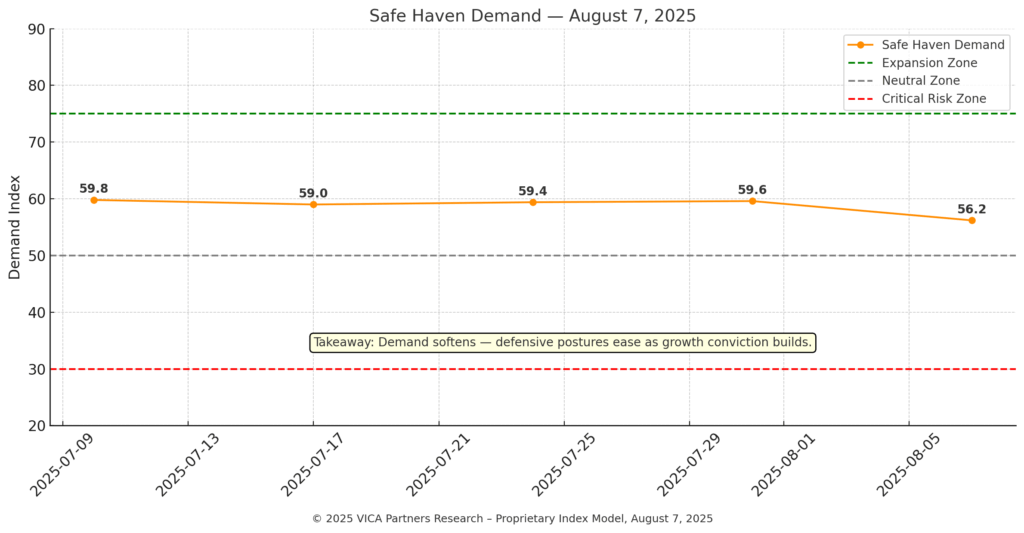
◆ Safe Haven
Score: 56.2 — easing from last week’s 59.6.
Capital Preference:
Allocations to Treasuries, gold, and TIPS moderated meaningfully. Defensive flows are receding as macro stabilization reduces urgency for hedging. The shift marks a rotation away from safety, suggesting institutional preference is tilting back toward risk-aligned exposures.
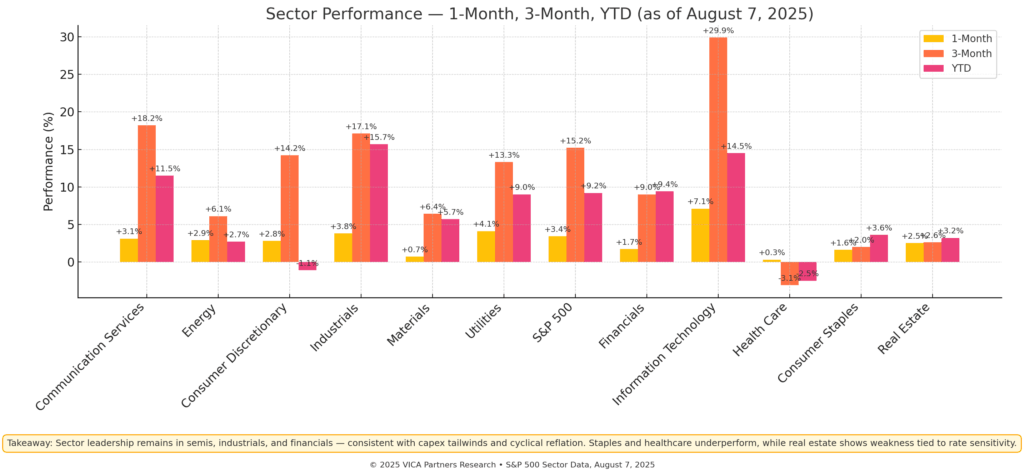
Sector Rotation Analysis
Rotation Signal:
Capital continues shifting into industrials, financials, and mid-cap tech — signaling conviction in cyclical reflation themes. Semiconductors maintain leadership. Utilities and REITs lag on rate sensitivity, while healthcare rotation stalls. Institutional posture favors growth-forward risk, anchored by disciplined value overlays.
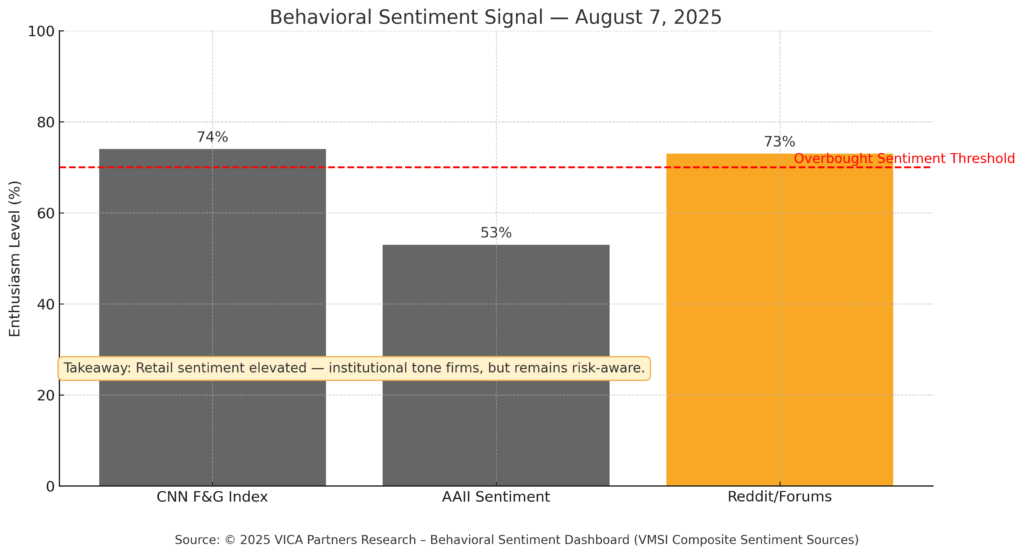
VMSI Sentiment Read
Retail sentiment is elevated but remains below euphoric thresholds. Institutional tone continues to firm — driven by macro stabilization, resilient credit spreads, and consistent equity bid behavior. Equity put/call ratios hold steady at constructive levels, suggesting healthy hedging discipline without speculative stretch.
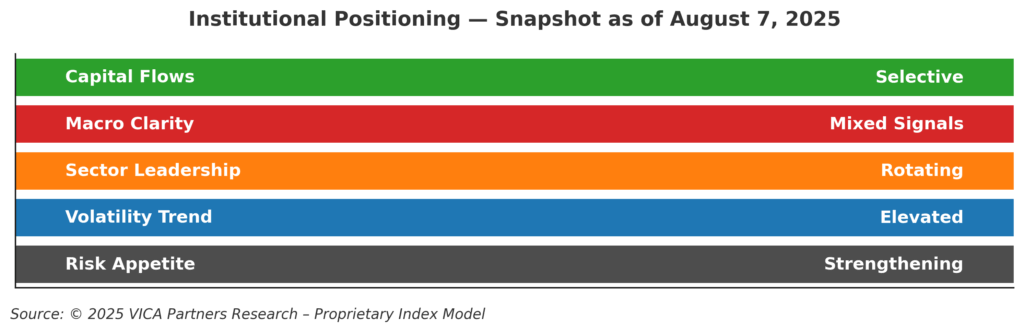
VMSI Institutional Positioning
Tactical Read:
Small- and mid-cap exposure continues gaining ground. Growth vs. value positioning remains balanced. The tone of allocation remains selective — supporting conviction without signaling overreach.
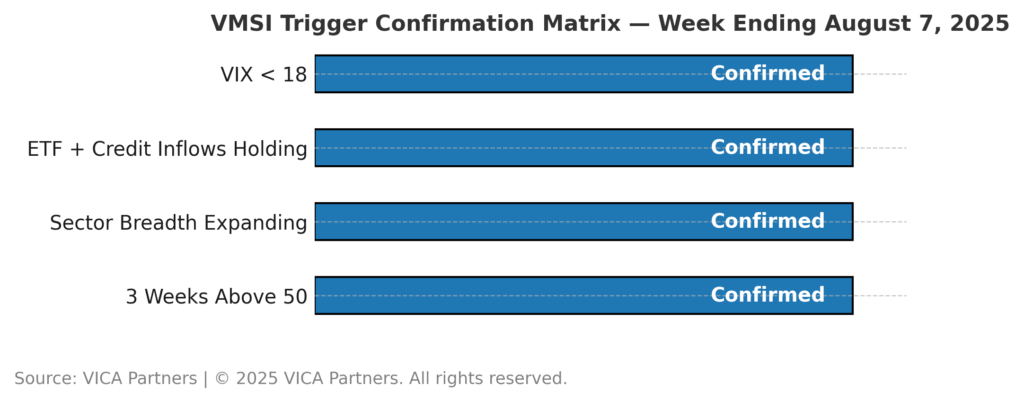
VMSI Predictive Outlook
All forward-looking technical triggers remain confirmed, supporting the continuation of disciplined institutional risk deployment. The trend profile reflects a methodical—not impulsive—risk-on shift, with strength visible across both equity and credit allocation channels.
Bias Outlook:
Base Case (70%): Continued rotation into growth and cyclical sectors, led by mid-cap leadership and low beta-adjusted correlation shifts.
Alternate Case (30%): Macro dislocation (e.g., credit stress or geopolitical tail) could briefly revive safe-haven positioning and hedging overlays.
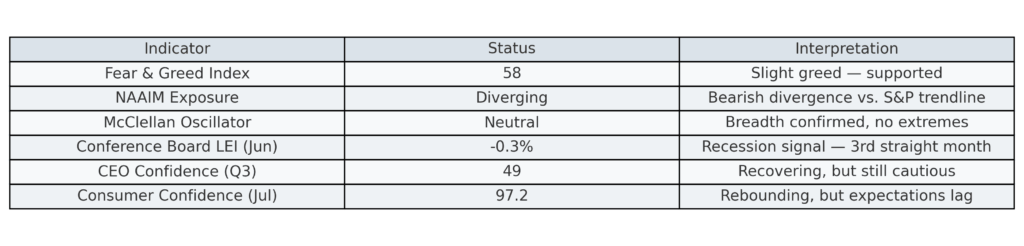
Macro Signals Snapshot
Macro conditions continue to set the tone for positioning. While hard data shows pockets of stress, forward-looking indicators remain mixed but stabilizing. Institutional allocators are watching key barometers closely — particularly signs of resilience in sentiment, leadership in credit, and earnings inflection potential. Below is a curated summary of the most relevant macro signals tracked this week:
Market Inertia Gauge — Economic Physics Lens
Decoding Capital Flow with First Principles
As volatility compresses and liquidity normalizes, institutional capital is no longer reacting — it’s executing. VICA’s Economic Physics framework reinterprets market movement through a structural lens: where capital behaves not as sentiment, but as force — derived from mass × acceleration / time friction.
This week’s reading highlights rising directional energy behind risk-on behavior — with notable precision.
- Mass: Institutional capital base remains deeply risk-engaged — steady across equity, credit, and ETF flows.
- Acceleration: Positioning velocity is increasing — especially in mid-cap growth, industrials, and high-beta cyclical themes.
- ƒₜ (Time Friction): CIOs are deploying capital with elevated urgency — prioritizing near-term convexity over long-term optionality.
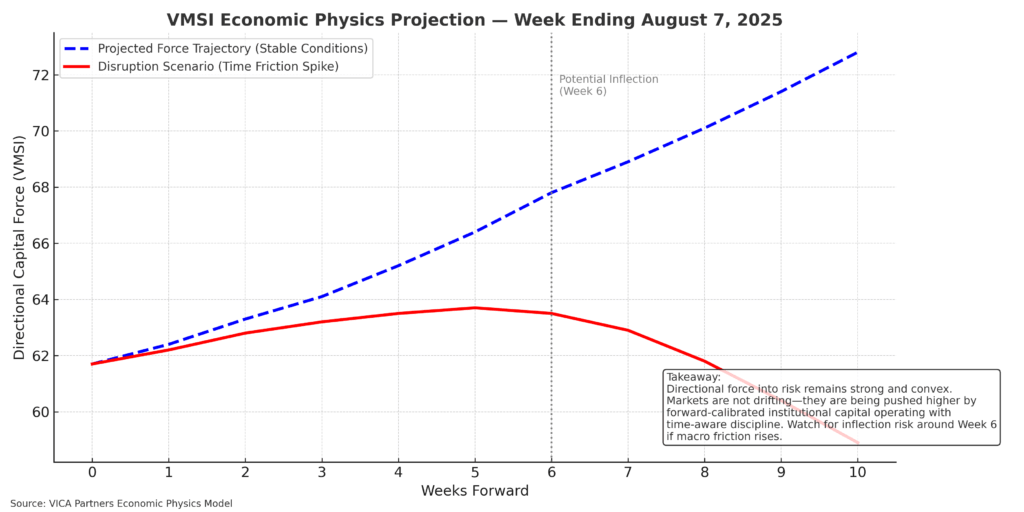
Convexity in Motion
The slope of deployment is not linear. We observe a convex curve, where capital accelerates into exposures offering amplified return efficiency as time-to-payoff shortens. This defines engineered inertia — forward-biased, mathematically rational, and structurally constrained.
Interpretation — Week Ending August 7, 2025
Capital is not floating markets — it’s pushing them, with precision and discipline.
Markets are not in passive drift. They’re grinding higher through force-calibrated allocation — shaped by the physics of risk and time. Unless disrupted by volatility shocks or macro dislocation, capital momentum is likely to persist along a disciplined upward slope, reinforcing incremental price appreciation in risk assets.
Volatility remains capped — but enforced, not collapsed. Time friction and convexity are enforcing signal integrity. This is not euphoria. It’s execution.
Final Word
Markets are not drifting — they are advancing under engineered force. VMSI reveals not euphoria, but precision: capital is structurally engaged, time-calibrated, and deploying with convex bias into growth risk. The signal isn’t loud — it’s exact.
About VMSI
The Volatility & Market Sentiment Index (VMSI©) is a proprietary multi-factor model engineered by VICA Partners to reflect real-time, conviction-weighted institutional positioning across volatility, momentum, liquidity, and sentiment vectors. VMSI is updated weekly to reflect rotational shifts, hedging structure, and directional confidence across capital markets.
Legal & Disclosure
This report is for informational purposes only and should not be construed as investment advice. All data and signals are derived from publicly available sources and proprietary modeling techniques. The VMSI is a non-tradable index, and VICA Partners makes no representation regarding the suitability of any strategy or positioning based on this publication. Past performance is not indicative of future results. Unauthorized redistribution is prohibited.
© 2025 VICA Partners. All rights reserved.


