VICA Partners | July 31, 2025, VICA Research — Volatility & Market Sentiment Index (VMSI©)
“Institutional positioning continued to build momentum this week as macro volatility faded and sector breadth advanced. With hedging overlays thinning and capital rotating into cyclicals, the VMSI reflects a quiet but growing bias toward risk-on participation.”
— Matthew Krumholz, CEO, VICA Partners
VMSI Overview
VICA Partners’ VMSI© (Volatility & Market Sentiment Index) isolates where conviction-weighted institutional capital is repositioning — helping investors cut through noise, quantify risk, and front-run structural shifts before they price into consensus. Institutional-grade signals — opened by design to those who think ahead.
#VMSI #InstitutionalFlow #MarketSignals #RiskEdge #VICAResearch #SmartCapital #ConvictionIndex #VolatilityRadar #PortfolioStrategy
Weekly Snapshot
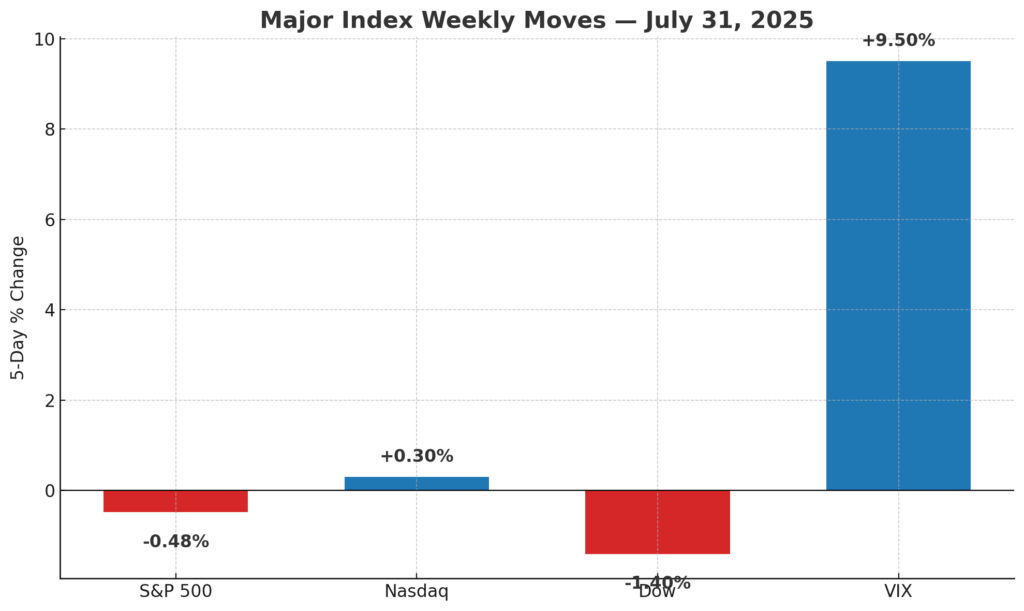
Major Index Closes — July 31, 2025
S&P 500: -0.37% | Nasdaq: -0.03% | Dow: -0.74% | VIX: +8.01%
Takeaway: Index performance diverged over the week — Dow lagged with a -1.40% decline, while Nasdaq gained +0.30%. S&P 500 drifted lower, and the VIX spiked +9.50%, reflecting a modest uptick in near-term volatility pricing. Institutions continue to rotate selectively amid rising macro sensitivity.
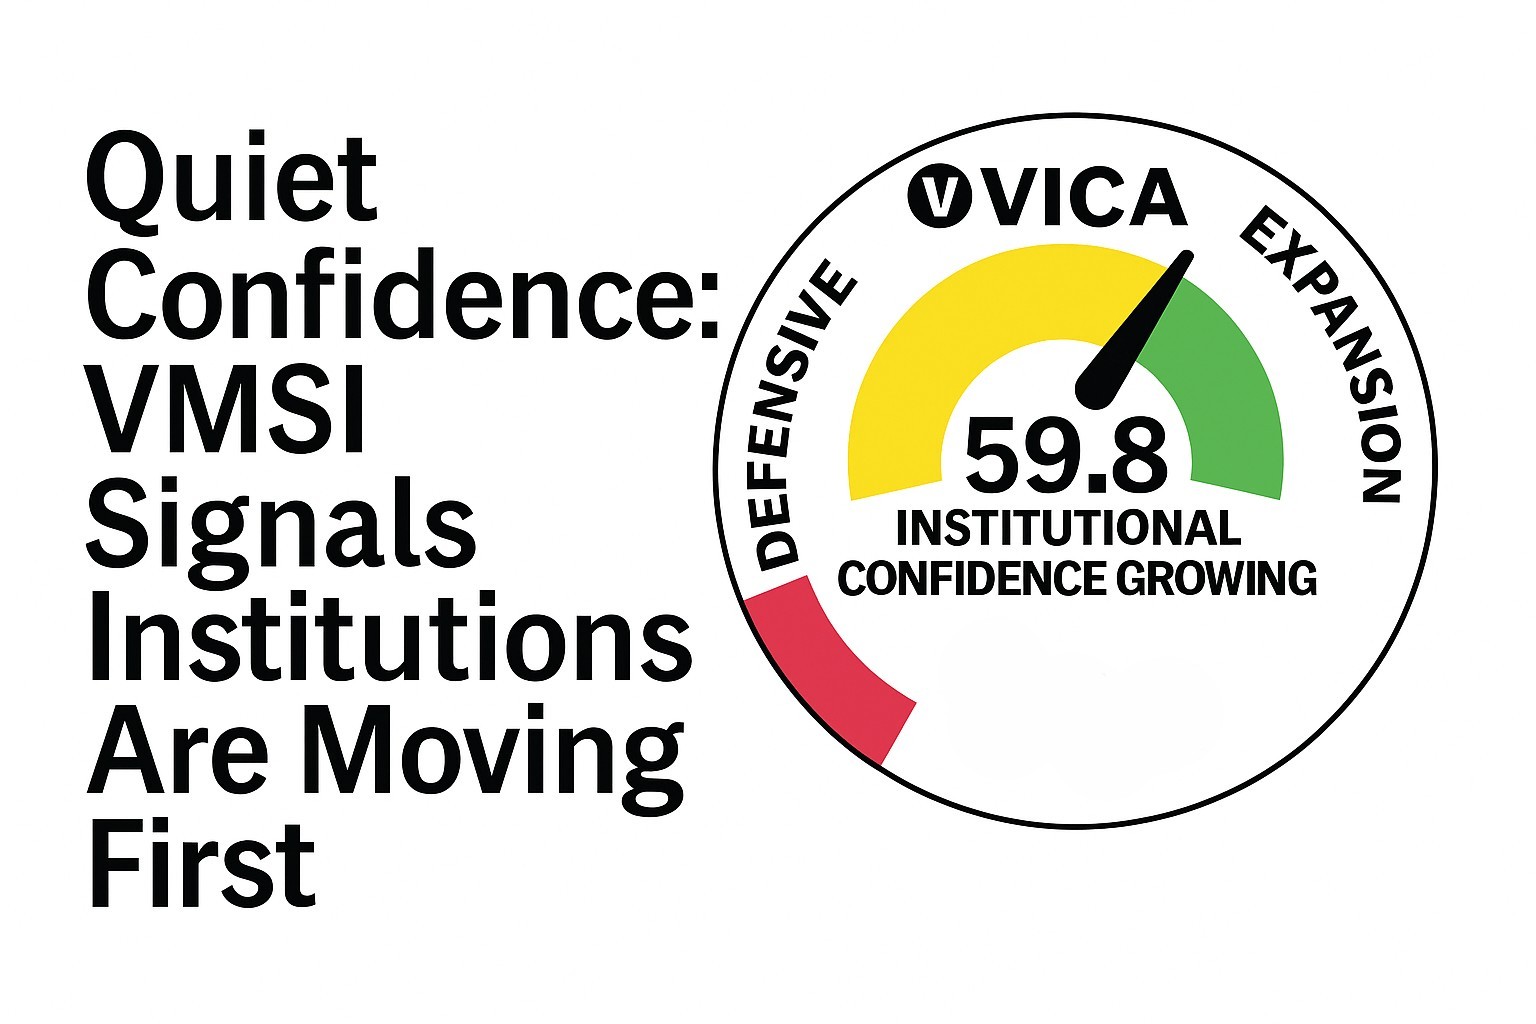
VMSI Composite Score
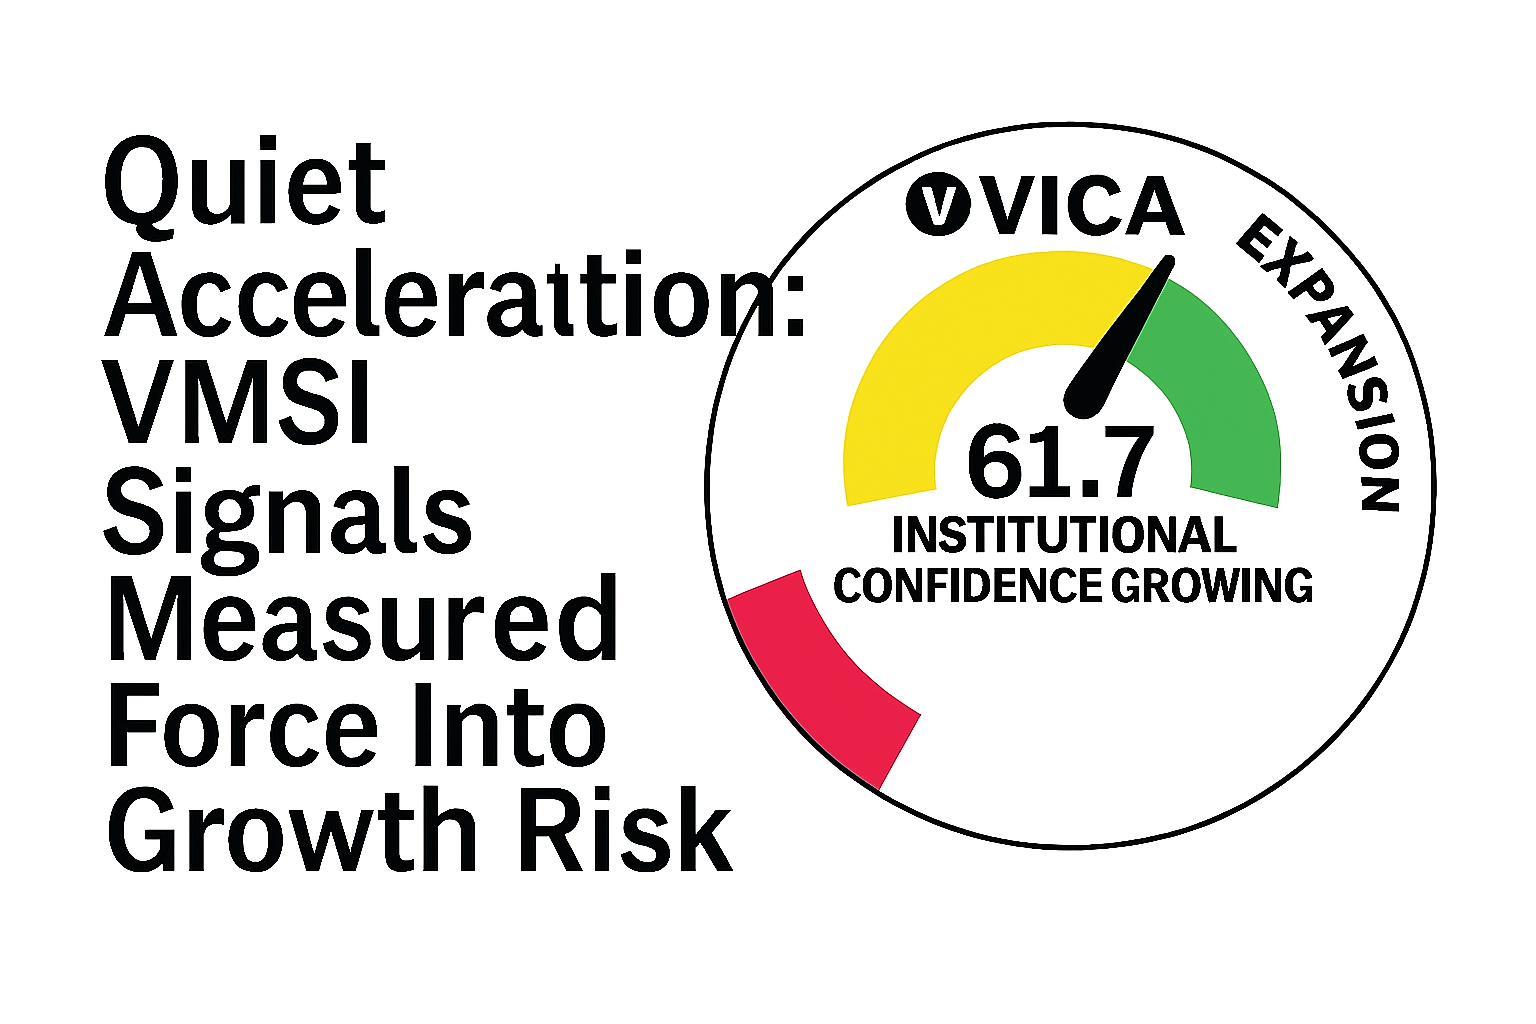
VMSI: 59.8 — firmly in the Cautionary Optimism zone. Volatility continues to compress while institutional positioning signals deliberate accumulation.
Takeaway: Institutions are not chasing risk — they’re building into it with steady, conviction-weighted flows. Momentum is broadening under control.
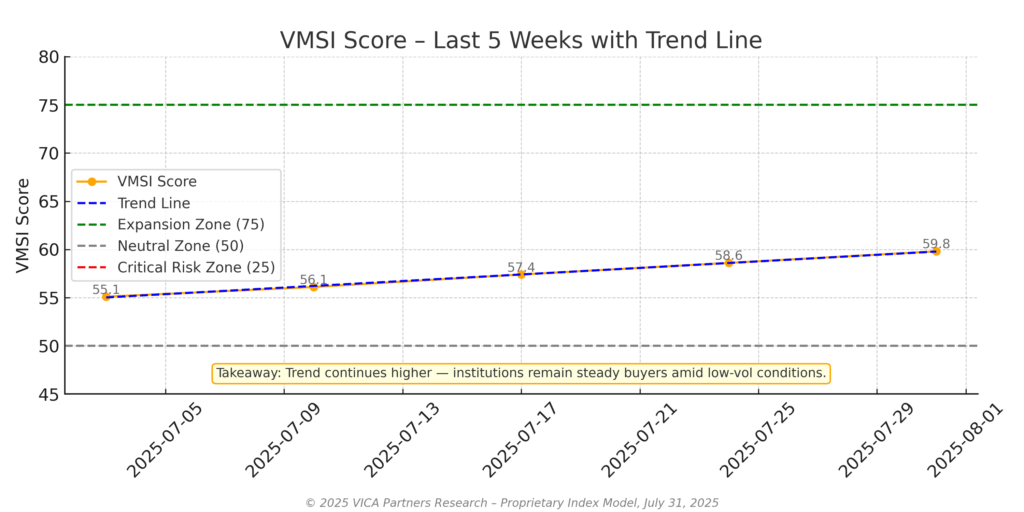
VMSI 4-Week Trend
55.1 → 56.1 → 57.4 → 58.6 → 59.8
Positioning Insight: Flows are expanding across sectors with continued emphasis on balanced cyclical exposure. Rotation remains methodical — suggesting institutions are layering into risk, not chasing it. The trendline’s smooth ascent reflects improving macro alignment and a tone of tempered conviction.
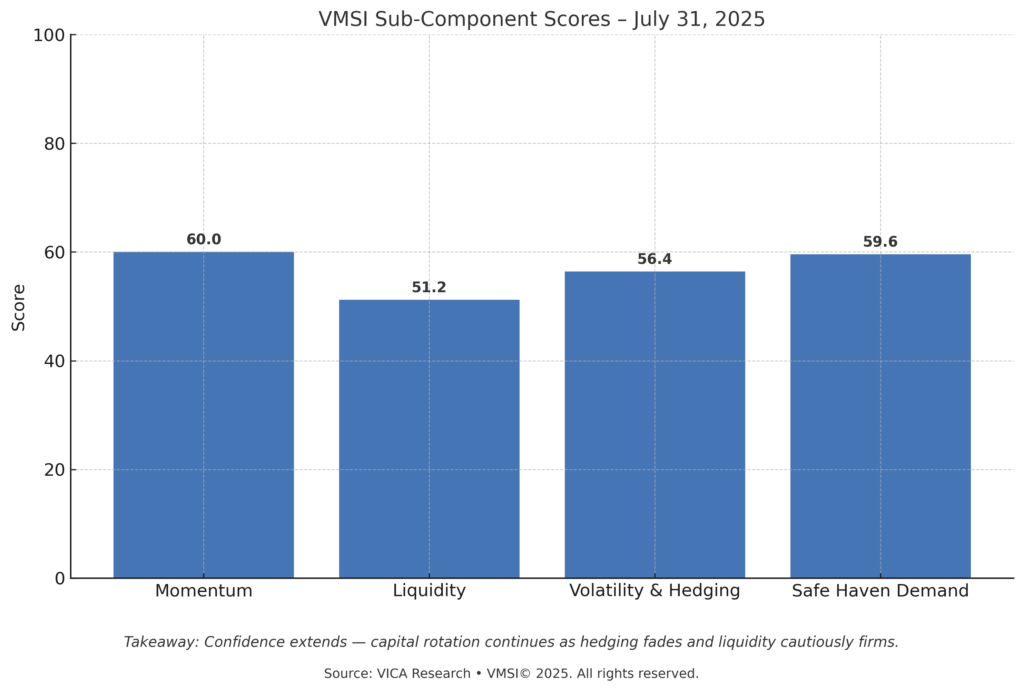
VMSI Sub-Components
Momentum Leads Broader Rotation
The sub-component breakdown confirms consistent institutional allocation across all major signals. Momentum extends, liquidity stabilizes, volatility hedging eases, and safe haven demand levels off — collectively reinforcing a disciplined risk-on tilt.
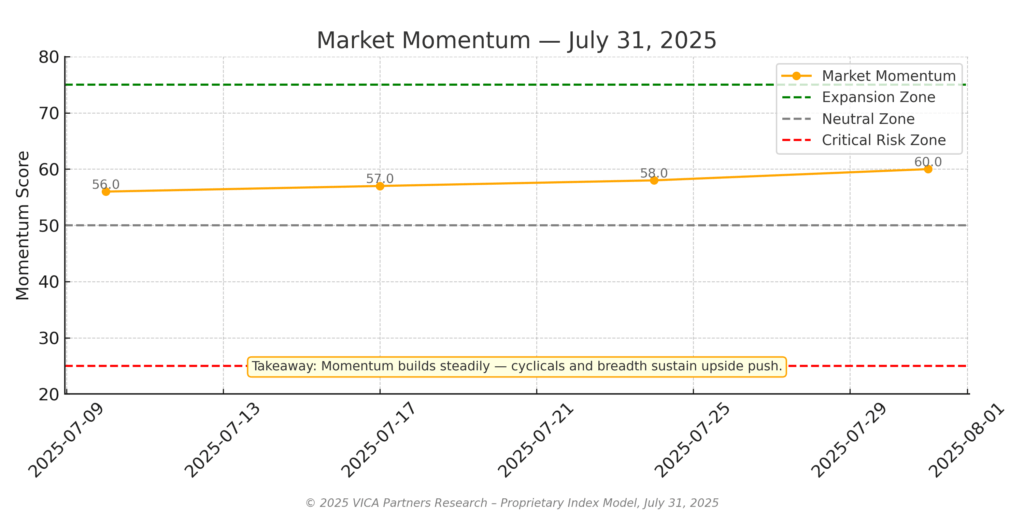
VMSI Momentum
Score: 60.0 — up from 58.0 last week.
Flow Signal: Equal-weight indices continue to outperform — confirming a broadening of leadership beyond megacaps. Industrial, discretionary, and tech sectors are driving follow-through. Style rotation favors mid-cap growth, while relative strength trends indicate growing institutional conviction.
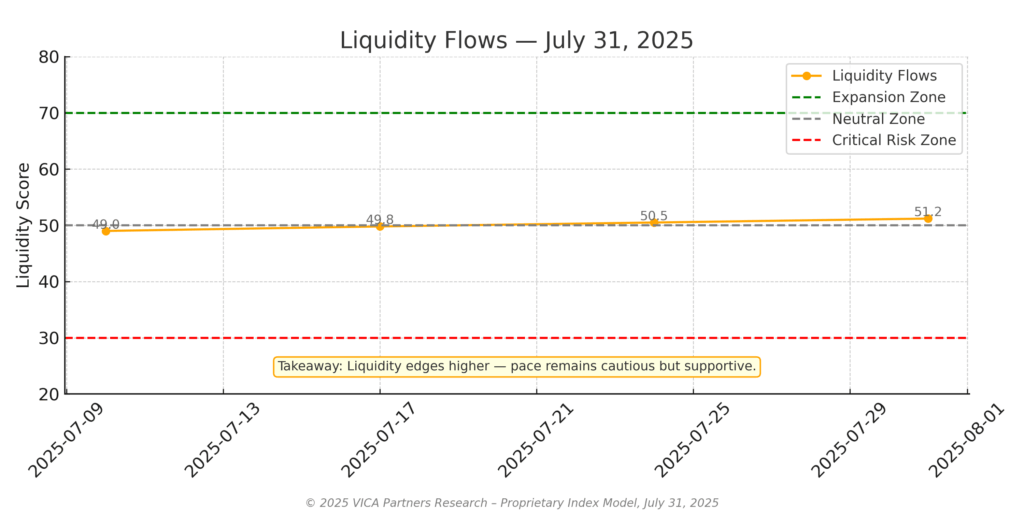
VMSI Liquidity
Score: 51.2 — modest rise from 50.5.
Allocation Cue: Credit conditions remain supportive. High-yield spreads are tight, and fund flows reflect stable risk absorption. There’s no evidence of euphoria — just steady inflows paced by macro confidence and rotational discipline.
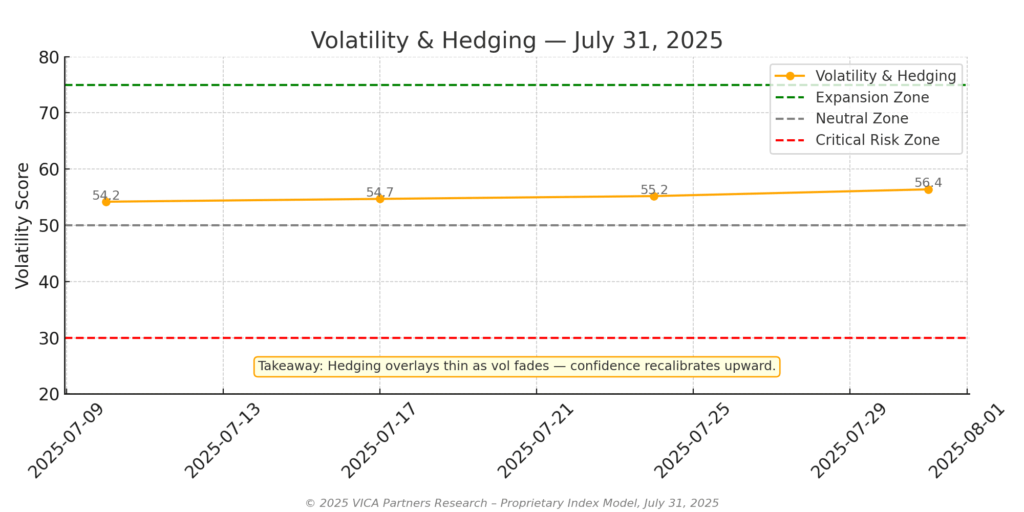
VMSI Volatility & Hedging
Score: 56.4 — rising from 55.2.
Risk Pulse: Hedging overlays continue to thin. The VIX and VVIX decline reflects subdued tail-risk pricing. Softening option skew and compressing realized volatility suggest measured confidence — optimism without complacency.
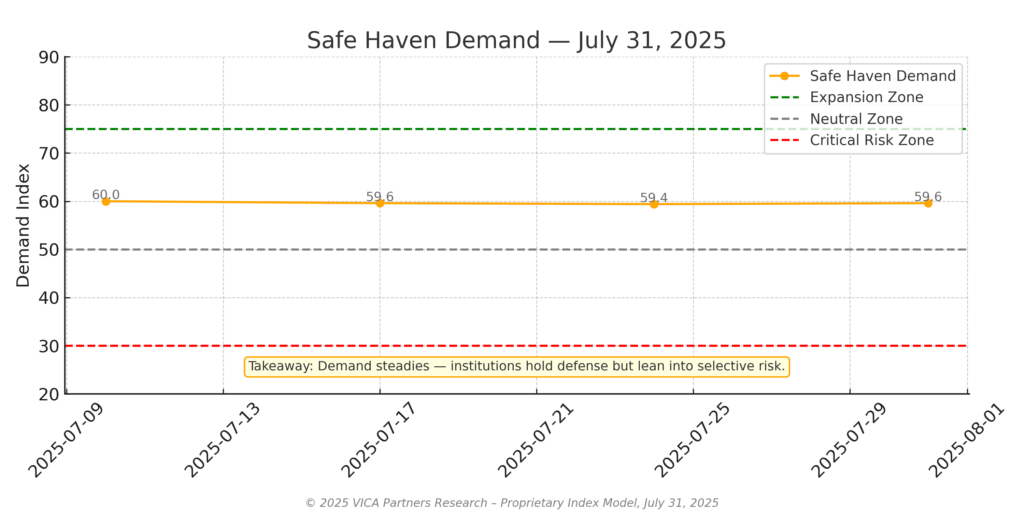
VMSI Safe Haven
Score: 59.6 — essentially flat from last week’s 59.4.
Capital Preference: Allocations to Treasuries, gold, and TIPs remain unchanged. The lack of increased defensive posture signals comfort with prevailing macro stability — a further signpost of quiet confidence.
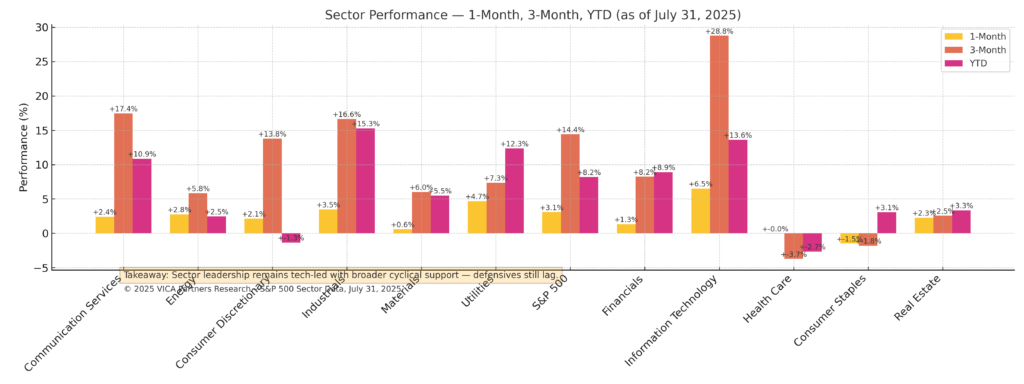
Sector Rotation
Rotation Signal: Leadership remains in semis, industrials, and financials — consistent with capex tailwinds and cyclical reflation. Staples and healthcare underperform, while real estate shows weakness tied to rate sensitivity. Institutional rotation favors growth exposure with selective value overlays.
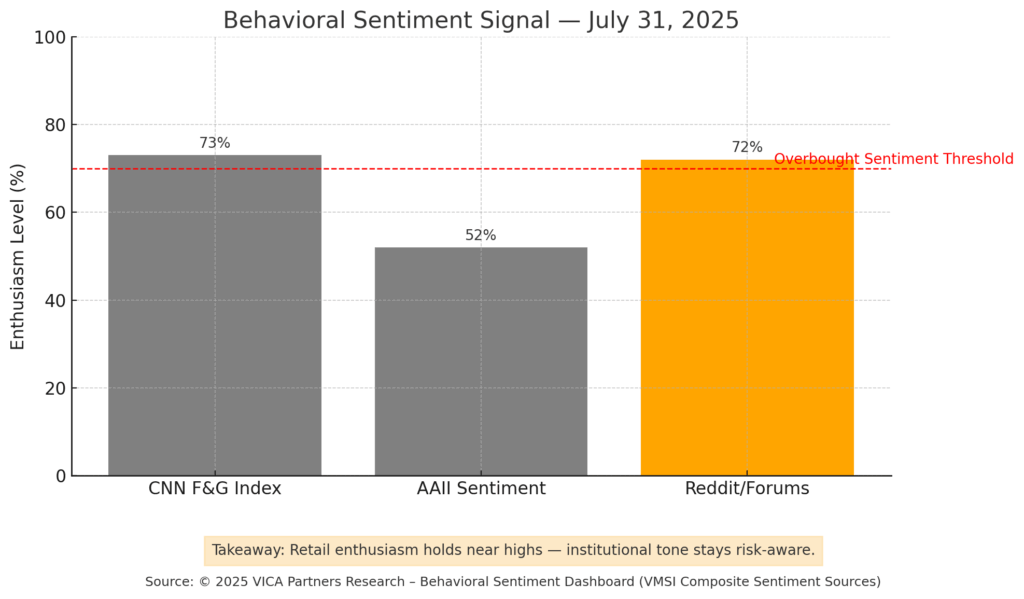
VMSI Sentiment Read
Behavioral Read: Retail sentiment is elevated but not euphoric. Institutional sentiment continues to firm, supported by macro stabilization and resilient risk markets. Equity put/call ratios stabilize — constructive, not stretched.
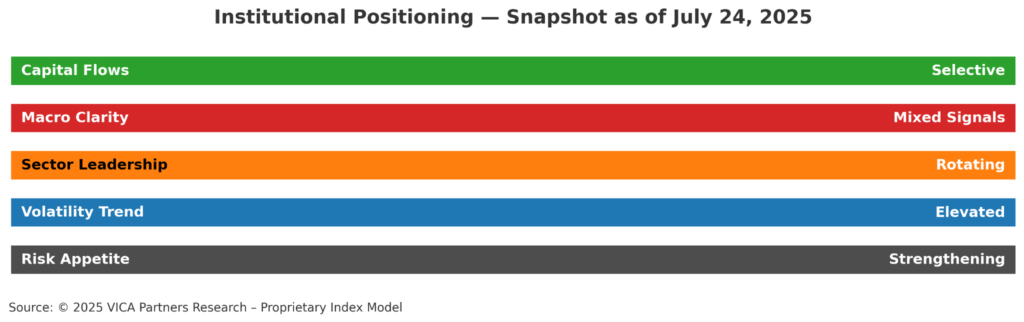
VMSI Institutional Positioning
Tactical Read: Small- and mid-cap exposure continues gaining ground. Growth vs. value positioning remains balanced. The tone of allocation remains selective — supporting conviction without signaling overreach.
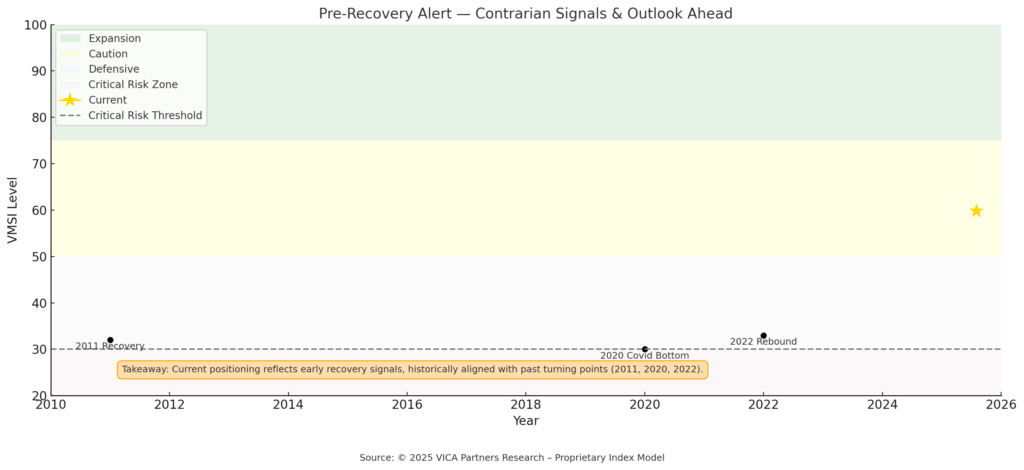
VMSI Historical Zones
Historical Echo: Current VMSI trajectory closely resembles inflection phases seen in 2012 and 2020. The index’s upward slope — while measured — reflects early-cycle conviction. This historically correlates with periods of durable expansion.
VMSI Predictive Outlook
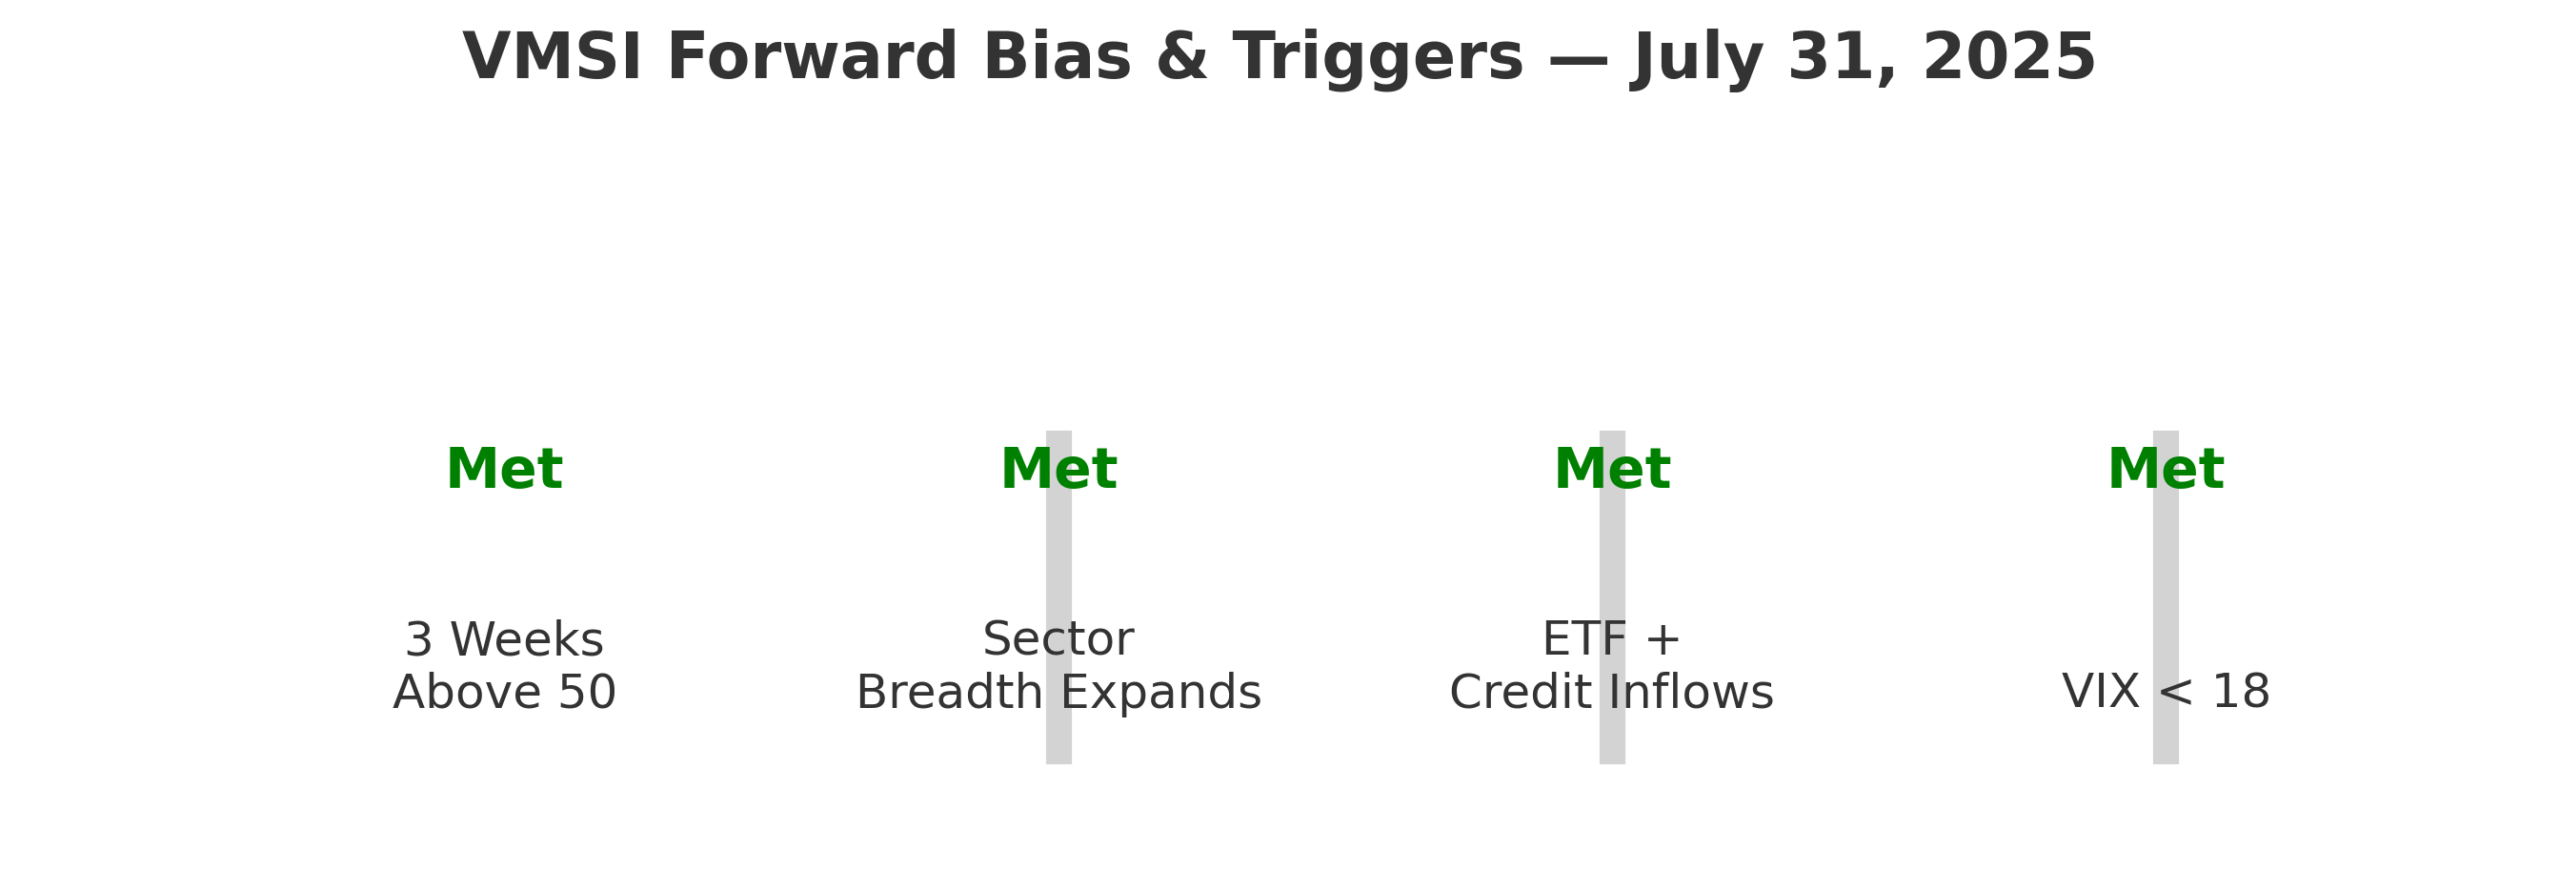
Forward Triggers Remain Firmly Met:
- 3 Weeks Above 50 ✓
- Sector Breadth Expanding ✓
- ETF + Credit Inflows Holding ✓
- VIX < 18 ✓
Outlook Bias: Institutional flows favor continuation. Risk indicators remain supportive across credit, equities, and volatility signals.
Base Case (70%): Positioning expands into cyclical and growth sectors. Hedging overlays remain light.
Alternate Case (30%): Inflation or credit stress could briefly restore defensive allocation bias.
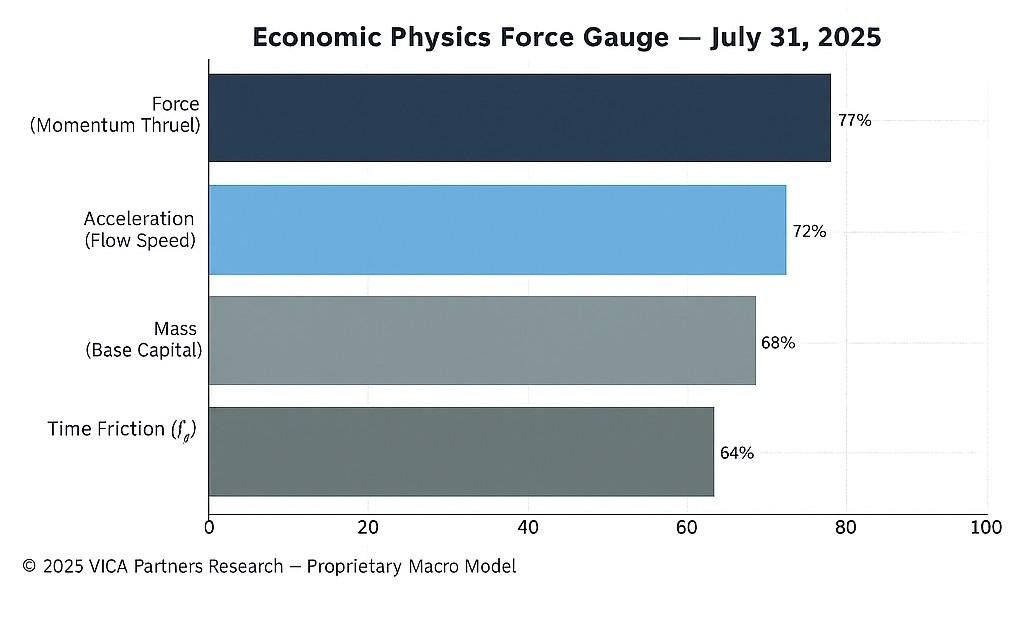
Market Inertia Gauge — Economic Physics Lens (Updated August 1, 2025)
Framework Overview: VICA’s proprietary Economic Physics framework distills directional capital force through a Newtonian construct:
Mass: Base capital density
Acceleration: Rate of positioning change
Force: Composite momentum into risk assets
New Consideration — Time Friction (ƒₜ): As capital decisions increasingly reflect opportunity cost over time, institutional flows now price in a temporal premium. That means velocity of deployment is influenced by how near-term the expected payoff must be to justify risk.
Interpretation (as of July 31, 2025): Capital momentum remains elevated, supported by rising acceleration and a durable mass base. However, investors are deploying with time-aware precision — filtering opportunities through a value-of-time lens. The result: forward inertia is methodical, driven by return thresholds that account for both momentum and duration.
About VMSI
VMSI© is a proprietary composite index designed to reflect conviction-weighted institutional positioning across volatility, momentum, liquidity, and sentiment dimensions. It is not derived from any single signal (including VIX), but rather engineered as a holistic indicator for macro-informed portfolio strategy.
© 2025 VICA Partners. All rights reserved. This report is for informational purposes only and does not constitute investment advice. Unauthorized reproduction prohibited.