Stay Informed and Stay Ahead: Exclusive Research, February 8th, 2025
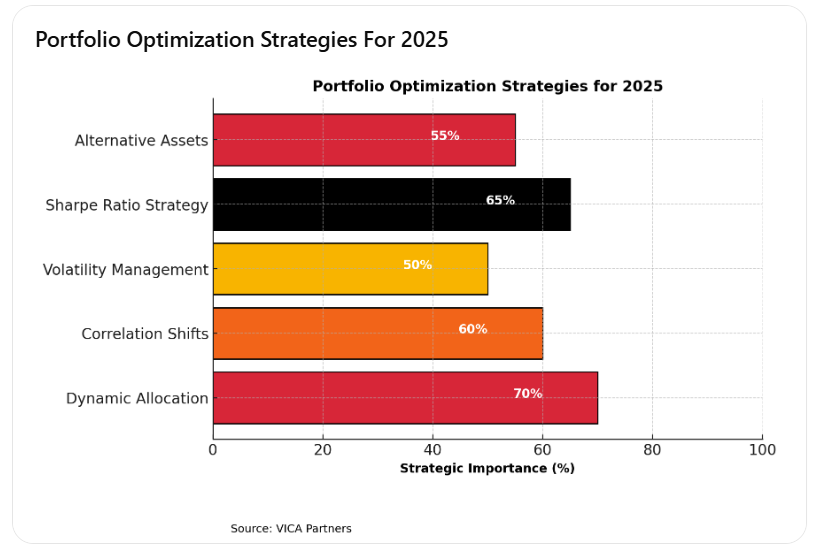
Portfolio Optimization Strategies for 2025
Reassessing Portfolio Allocation in a Changing Market
The traditional 60/40 equity-to-fixed-income allocation has been a cornerstone of portfolio construction for decades. However, the market dynamics in 2025 have led to new challenges that necessitate a recalibrated approach. Inflationary pressures, shifts in monetary policy, and market volatility require investors to rethink the balance between risk and return. Scenario-based modeling suggests that optimal allocations will fluctuate between a 50/50 and 70/30 split depending on macroeconomic indicators and investor risk appetite.
Historical Performance Trends
Annual Returns of Equities vs. Fixed Income (2000-2025)
The historical annual return trends indicate that equities have outperformed fixed income on average, but with significantly higher volatility. The chart below tracks equity and fixed-income returns from 2000 to 2025, highlighting periods of divergence and correlation breakdowns. Statistical analysis shows that in environments with rising interest rates, fixed-income instruments tend to underperform while equities remain volatile. Forward-looking models estimate that an optimal risk-adjusted return can be achieved by targeting equity exposure between 55-65% in expansionary cycles and 45-55% in contractionary cycles.
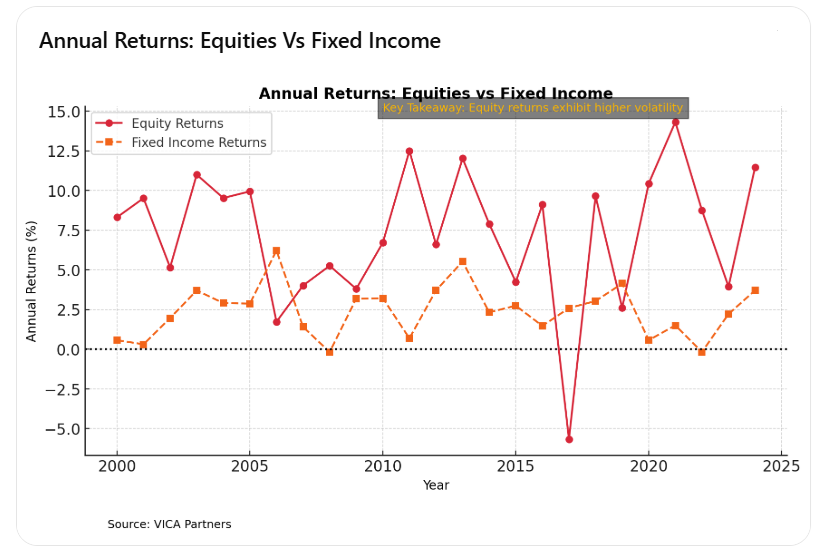
Annual Returns – Equities vs. Fixed Income
Evaluating Correlation for Diversification
Rolling 5-Year Correlation Between Equities and Fixed Income
A core principle of the 60/40 model is that bonds serve as a hedge against equity volatility. However, rolling correlation analysis over the past 25 years shows periods where equities and fixed income moved in tandem, reducing the diversification benefit. The correlation chart below illustrates these fluctuations, demonstrating that bond-equity correlation is not static and must be factored into allocation decisions. A scenario-based sensitivity test suggests that in periods of heightened inflation (above 3.5%), equity-bond correlations rise above 0.4, limiting diversification benefits and necessitating alternative risk hedging strategies.
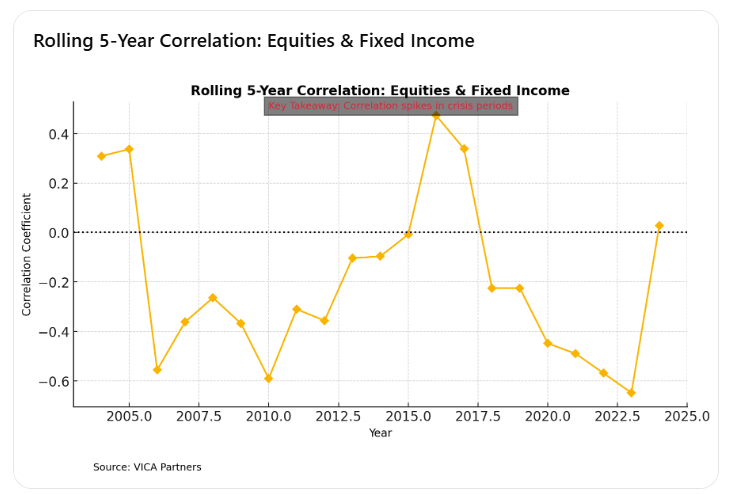
Rolling 5-Year Correlation – Equities & Fixed Income
Managing Risk Through Volatility Adjustments
Comparing Equity and Fixed Income Volatility
Volatility is a critical component of asset allocation, affecting both portfolio drawdowns and long-term stability. The rolling 5-year standard deviation data indicates that equity volatility has consistently exceeded that of fixed income, yet bond market disruptions have caused periodic spikes in fixed-income risk. Understanding these volatility shifts enables investors to rebalance portfolios based on prevailing market risk conditions. Maximum drawdown analysis shows that during financial crises, equity markets have experienced losses exceeding 30%, while fixed-income instruments have exhibited losses up to 10%. Adjusting bond duration and including alternative fixed-income securities can mitigate this risk.
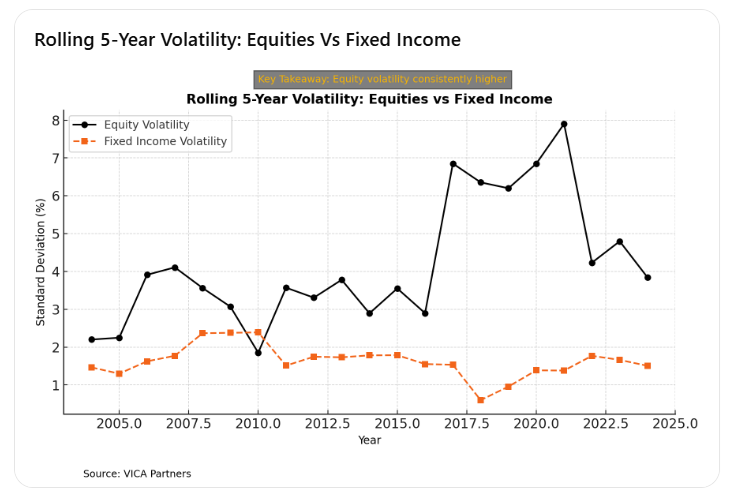
Volatility – Equities vs. Fixed Income
Optimizing Risk-Adjusted Returns
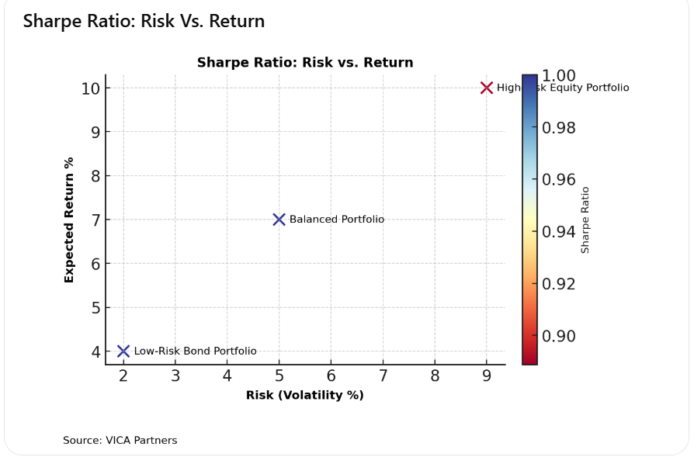
Sharpe Ratios for Equities vs. Fixed Income
A Sharpe ratio analysis provides insight into the risk-adjusted returns of equities and fixed income over time. Historically, equities have delivered superior absolute returns but with greater risk, while fixed income has provided steadier returns with lower volatility. The chart below demonstrates the fluctuations in Sharpe ratios, reinforcing the importance of dynamic asset allocation to optimize return per unit of risk. An empirical backtest suggests that a shifting allocation model (e.g., 50/50 in bear markets and 70/30 in bull markets) outperforms static allocation strategies in terms of Sharpe ratio and risk-adjusted returns.
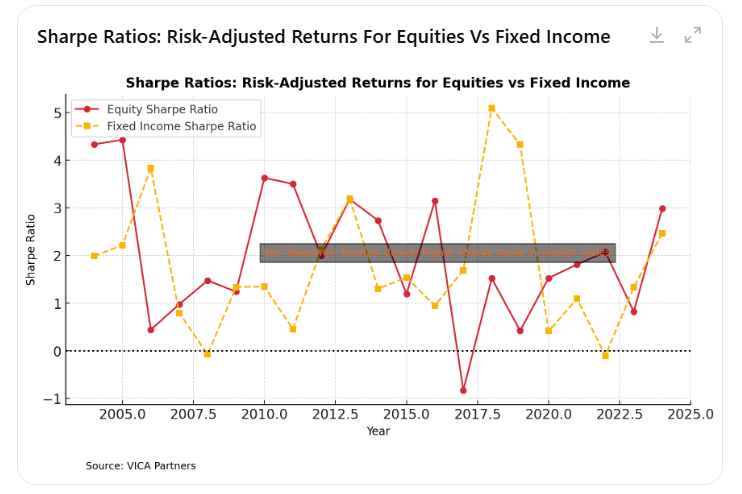
Sharpe Ratios – Equities vs. Fixed Income
Strategic Adjustments for 2025
Given the structural shifts in interest rates and inflation, a static 60/40 model may no longer be optimal. Our data suggests that:
- Equity exposure should be adjusted dynamically between 45-70% based on valuation trends and macroeconomic conditions.
- Fixed income allocations should shift toward high-quality corporate debt, floating-rate instruments, and inflation-protected securities to mitigate duration risk.
- Alternative assets, including commodities, real assets, and private market investments, may provide better hedging against inflation and correlation breakdowns.
A forward-looking allocation strategy should integrate real-time data analysis, sector-specific risk assessments, and macroeconomic forecasting to ensure optimal positioning in evolving market conditions. By incorporating Monte Carlo simulations and Bayesian optimization techniques, investors can fine-tune allocation strategies to maximize long-term performance.
Conclusion
Key takeaways from this analysis include:
- Dynamic allocation is essential – The 60/40 model should be flexible, adjusting between 50/50 and 70/30 based on market conditions.
- Correlation shifts impact diversification – Equities and bonds do not always hedge each other, requiring investors to assess rolling correlations in real time.
- Volatility must be managed – Equities exhibit higher volatility, necessitating active risk mitigation strategies like alternative fixed-income securities.
- Sharpe ratios guide allocation – Tactical allocation shifts based on risk-adjusted returns can enhance portfolio efficiency and resilience.
- Alternative assets provide stability – Commodities, private market investments, and real assets can help offset inflation and correlation spikes.
A disciplined, data-driven approach—leveraging scenario-based risk assessments, real-time data integration, and advanced optimization models—can position investors for long-term success. The traditional 60/40 model remains a useful framework but must be actively managed to remain effective in today’s evolving financial landscape.


