
Stay Informed and Stay Ahead: Exclusive Research, January 18th, 2025
Resilient Strategies for Investors Based on IMF Growth Forecast
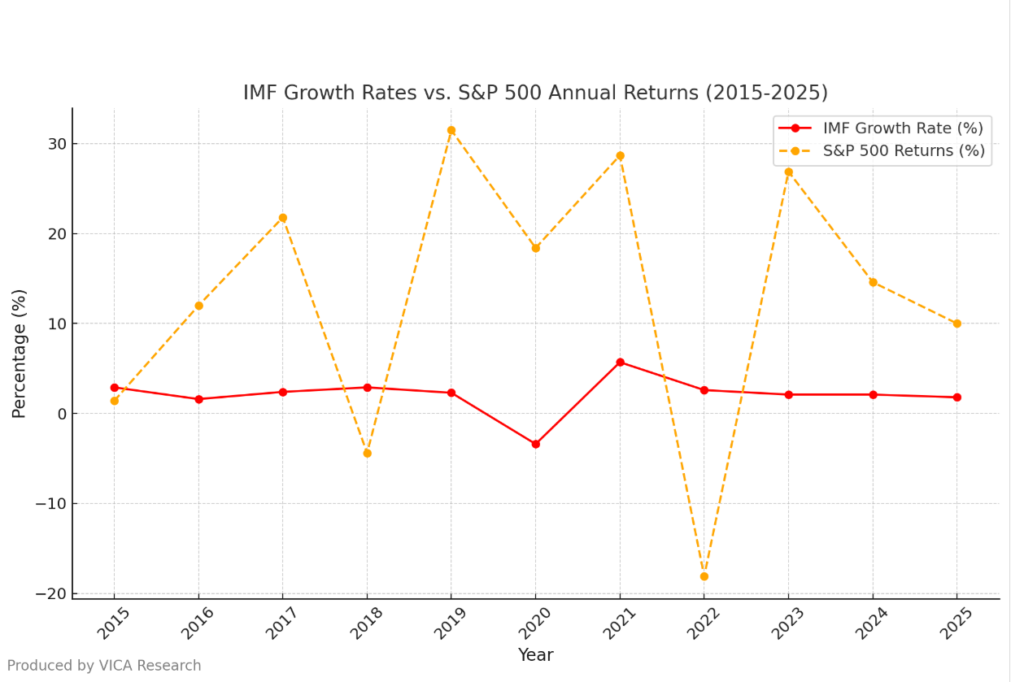
IMF Growth Rates Compared to S&P 500
Overview
A clear understanding of the IMF’s projected U.S. growth rate relative to historical S&P 500 returns provides valuable context for investment decisions. For instance, while the IMF anticipates 1.8% GDP growth in 2025, the long-term average annual return of the S&P 500 is approximately 10%. This stark contrast underscores the importance of differentiating economic growth trends from stock market performance, ensuring that portfolios are adjusted accordingly.
Key Takeaways
Why Risk-Adjusted Strategies Matter
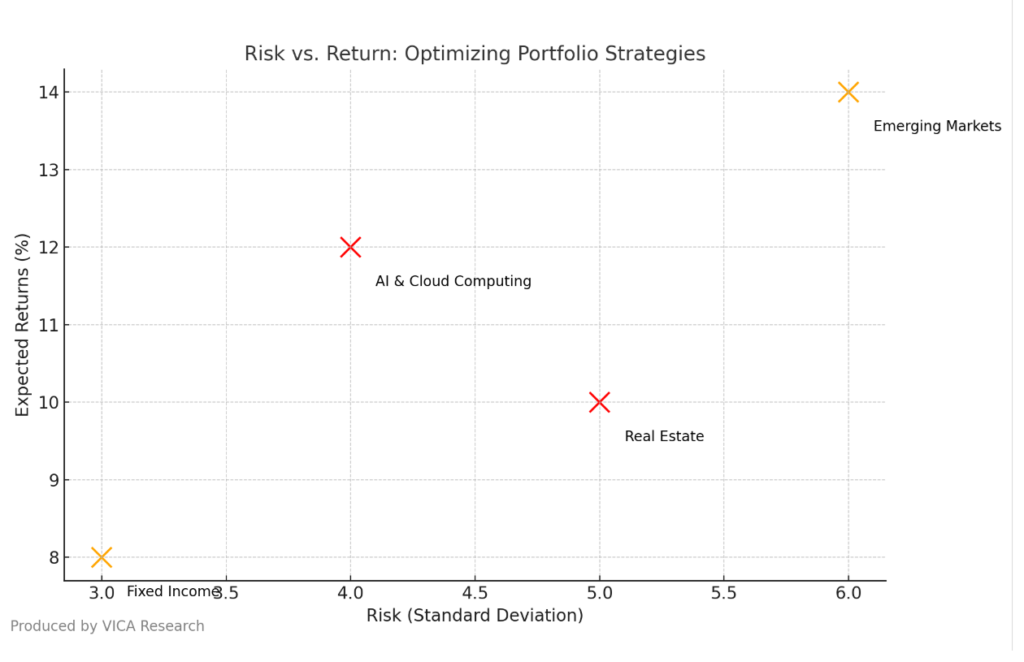
The chart below illustrates the importance of balancing returns with risk in a slowing economy. It directly ties into actionable strategies by highlighting how investors can optimize portfolios through sectors like AI and cloud computing, fixed income, and emerging markets, which offer compelling returns relative to their risk.
Exclusive Insights for High-Stakes Decisions
The following section of analysis provides exclusive insights typically reserved for institutional discussions, equipping investors with actionable strategies to navigate complex economic dynamics.is analysis provides exclusive insights typically reserved for institutional discussions, equipping investors with actionable strategies to navigate complex economic dynamics.
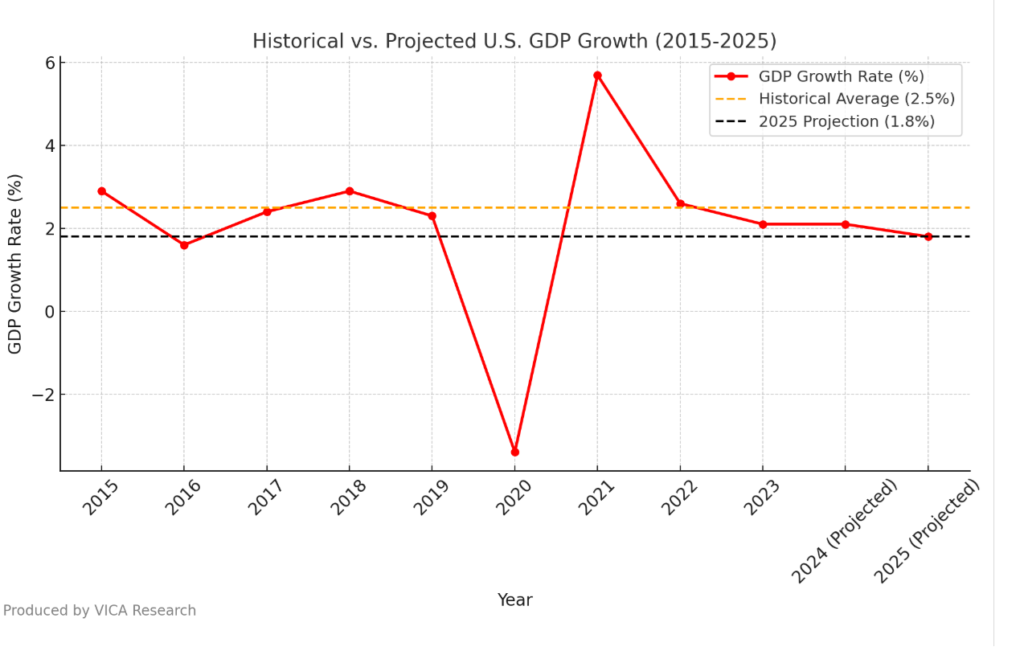
Historical vs. Projected U.S. GDP Growth
This chart illustrates the deceleration from historical averages (2.5%) to the IMF’s projected 1.8% for 2025, highlighting the need for strategic adjustments to maintain returns in a cooling economic environment.
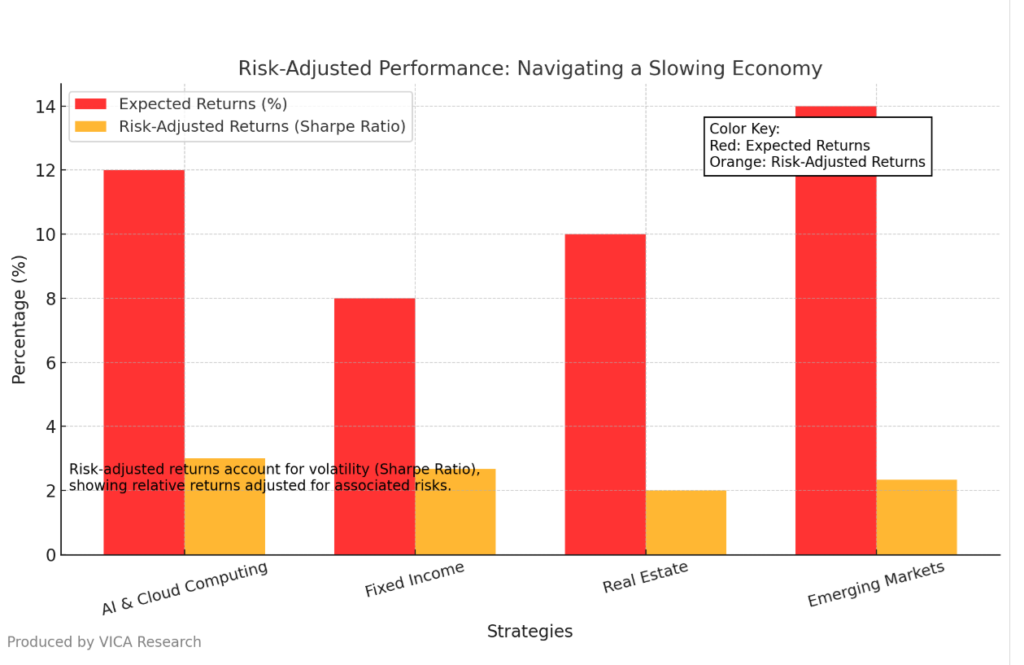
Risk-Adjusted Performance: Navigating a Slowing Economy
This chart illustrates the trade-off between risk (volatility) and expected returns, showing how strategies like Emerging Markets offer higher returns at greater risk, while Fixed Income provides lower risk with steady returns.
Actionable Strategies for Investors
Equities: Focus on Resilient Sectors
-
Key Insight: Technology sectors, especially AI (+15% annual growth) and cloud computing (double-digit revenue gains), remain robust despite rising rates.
-
Recommendation: Prioritize value stocks and sectors with stable cash flows (utilities, healthcare, staples). For example, healthcare companies like Johnson & Johnson have consistently delivered reliable dividends, while utility firms such as Duke Energy provide steady income streams even in volatile markets.
Fixed Income: Leverage Yield Opportunities
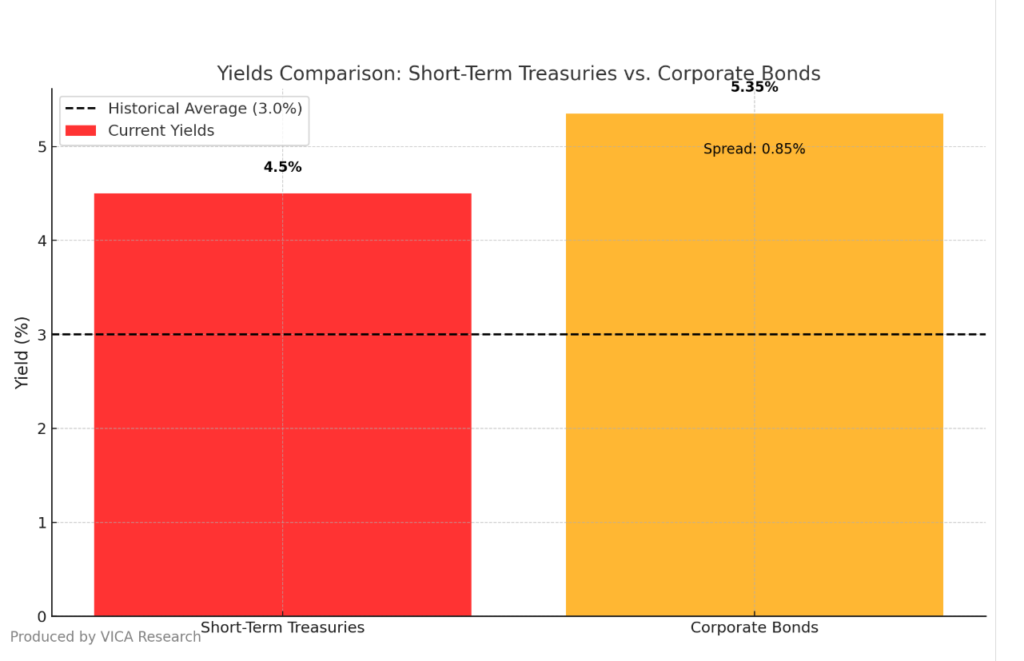
Yields Comparison: Short-Term Treasuries vs. Corporate Bonds
This chart illustrates the current yields of short-term Treasuries (4.5%) and corporate bonds (5.35%) compared to the historical average (3.0%), highlighting the 0.85% yield spread and the relative attractiveness of corporate bonds in a high-rate environment.
-
Key Insight: Short-term Treasuries yield ~4.5%; corporate bonds yield ~5.2%-5.5%.
-
Recommendation: Ladder maturities to lock in stable returns.
Alternative Investments: Diversify for Stability
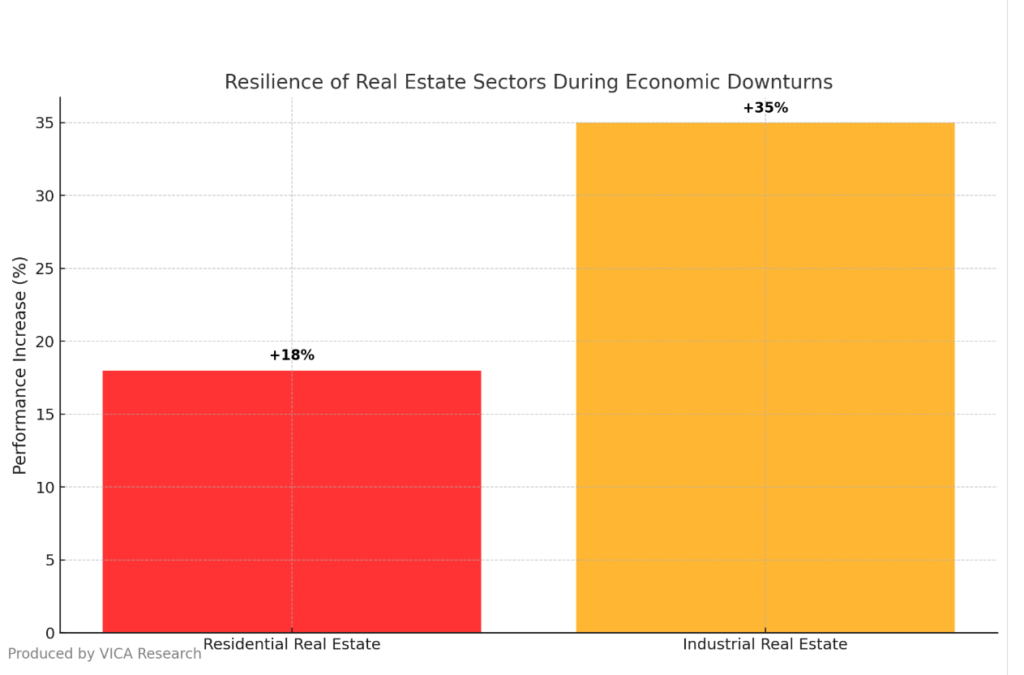
Resilience of Real Estate Sectors During Economic Downturns
The chart data points illustrate how residential real estate performance increased by 18% and industrial real estate by 35% during economic downturns, underscoring their role as stable, inflation-resistant investments.
-
Key Insight: Real estate and infrastructure showed resilience in past crises (e.g., +25% industrial rental rates during COVID-19).
-
Recommendation: Allocate to inflation-hedging assets like private equity and residential real estate.
Emerging Markets: Target Growth Regions
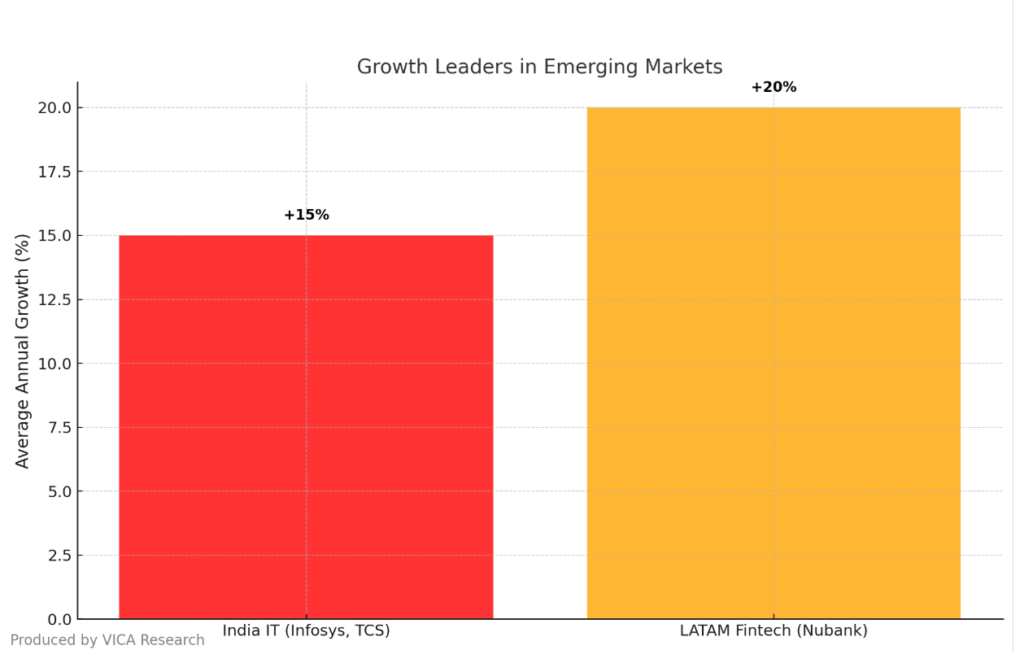
Growth Leaders in Emerging Markets
This chart illustrates how India’s IT sector and LATAM fintech have achieved average annual growth rates of 15% and 20%, respectively, highlighting their leadership in emerging market innovation.
-
Key Insight: India (IT giants Infosys, TCS) and LATAM fintech (Nubank) offer structural growth.
-
Recommendation: Focus on markets with robust demand and fiscal discipline.
Risk Management Priorities
-
Diversify: Spread investments across regions, asset classes, and sectors.
-
Monitor: Watch geopolitical risks, inflation surprises, and central bank moves.
Conclusion: Strategic Positioning for Growth
This article combines unique data and thoughtful interpretation to provide insights that go beyond conventional analyses. By leveraging these unique perspectives, investors are empowered to make informed decisions that anticipate and capitalize on evolving market trends.
Investors must adapt to a slower growth environment with precision and flexibility. By leveraging data-driven strategies and targeting resilient sectors, portfolios can thrive despite economic moderation. Prioritize diversification, explore innovative sectors, and remain agile to capitalize on emerging opportunities.


