Stay Informed and Stay Ahead: Market Watch, July 22nd, 2024
Commodities
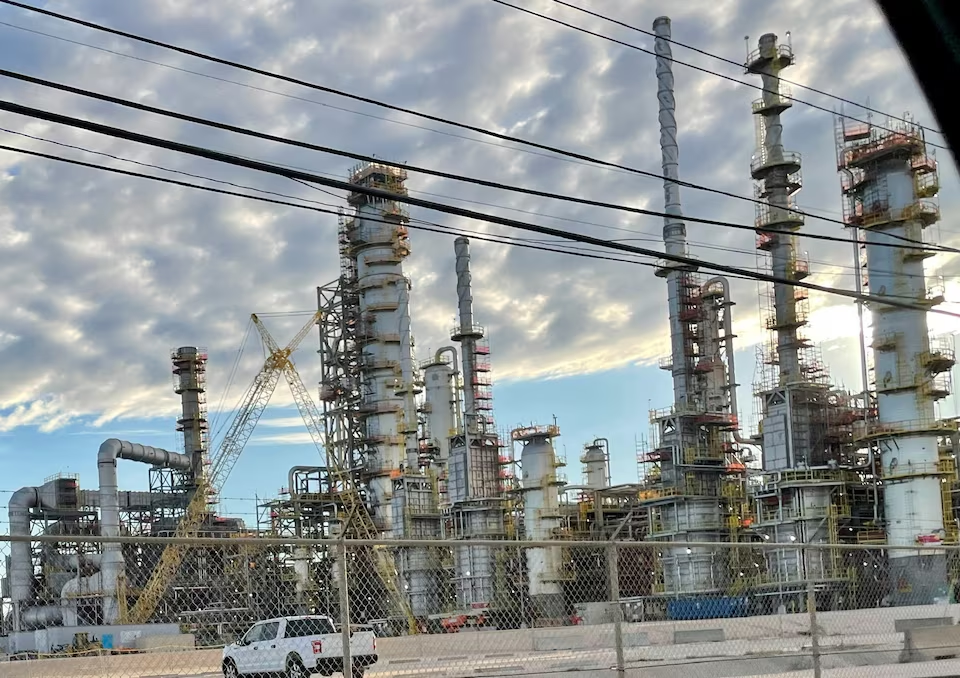
Summary of Weekly Petroleum Data for the Week Ending July 12, 2024
- The weekly petroleum data offers insights into the U.S. energy market dynamics, essential for understanding broader economic trends.
Key Takeaways:
- Refinery Capacity Utilization: Operating at 93.7% indicates strong demand for refined products, reflecting economic activity and energy consumption patterns.
- Crude Oil Imports and Inventories: Inventory levels below the five-year average may indicate tighter supply conditions.
- Products Supplied: Increased total products supplied, particularly gasoline and distillate fuels, signals robust demand linked to economic growth, consumer behavior, and industrial activities.
Summary: For the week ending July 12, 2024:
- Refinery inputs and gasoline production decreased slightly, while distillate production increased.
- Crude oil imports rose, leading to a slight decrease in commercial crude oil inventories.
- Gasoline and distillate inventories saw significant increases, with propane/propylene inventories well above the five-year average.
- Total products supplied indicate a slight uptick in demand compared to last year, reflecting ongoing economic activity and consumer behavior.
Refinery Inputs and Production:
- Crude Oil Refinery Inputs: Averaged 16.9 million barrels per day (down by 181,000 barrels per day from the previous week).
- Operable Capacity: Refineries operated at 93.7% of their capacity.
- Gasoline Production: Decreased to an average of 9.5 million barrels per day.
- Distillate Fuel Production: Increased to an average of 5.2 million barrels per day.
Imports:
- Crude Oil Imports: Averaged 7.0 million barrels per day (up by 277,000 barrels per day from the previous week). Over the past four weeks, averaged 6.7 million barrels per day (1.1% higher than the same period last year).
- Motor Gasoline Imports: Averaged 728,000 barrels per day.
- Distillate Fuel Imports: Averaged 108,000 barrels per day.
Inventories:
- Commercial Crude Oil: Decreased by 4.9 million barrels to 440.2 million barrels (5% below the five-year average).
- Motor Gasoline: Increased by 3.3 million barrels (slightly above the five-year average).
- Distillate Fuel: Increased by 3.5 million barrels (7% below the five-year average).
- Propane/Propylene: Increased by 4.6 million barrels (16% above the five-year average).
- Total Commercial Petroleum: Increased by 10.4 million barrels.
Products Supplied:
- Total Products Supplied: Averaged 20.5 million barrels per day (up by 1.2% from the same period last year).
- Motor Gasoline Supplied: Averaged 9.1 million barrels per day (up by 0.2%).
- Distillate Fuel Supplied: Averaged 3.6 million barrels per day (up by 3.9%).
- Jet Fuel Supplied: Increased by 0.7%.
Historical Context and Economic Implications
This week’s data highlights several significant trends and their potential impacts on the broader economy:
- Refinery Capacity Utilization: The high utilization rate of 93.7% underscores strong demand for refined products, indicative of a healthy economy and energy consumption.
- Crude Oil Imports and Inventories: The rise in imports and the decline in inventories suggest a balancing act between domestic production, import reliance, and consumption. Below-average inventory levels point to tighter supply conditions.
- Production Adjustments: The reduction in gasoline production and increase in distillate fuel production align with seasonal demand patterns and shifts in transportation and industrial activities.
- Increased Product Supply: The overall rise in products supplied, especially gasoline and distillate fuels, indicates robust consumer and industrial demand, suggesting continued economic growth and increased mobility.


