
TECHNICAL ANALYSIS
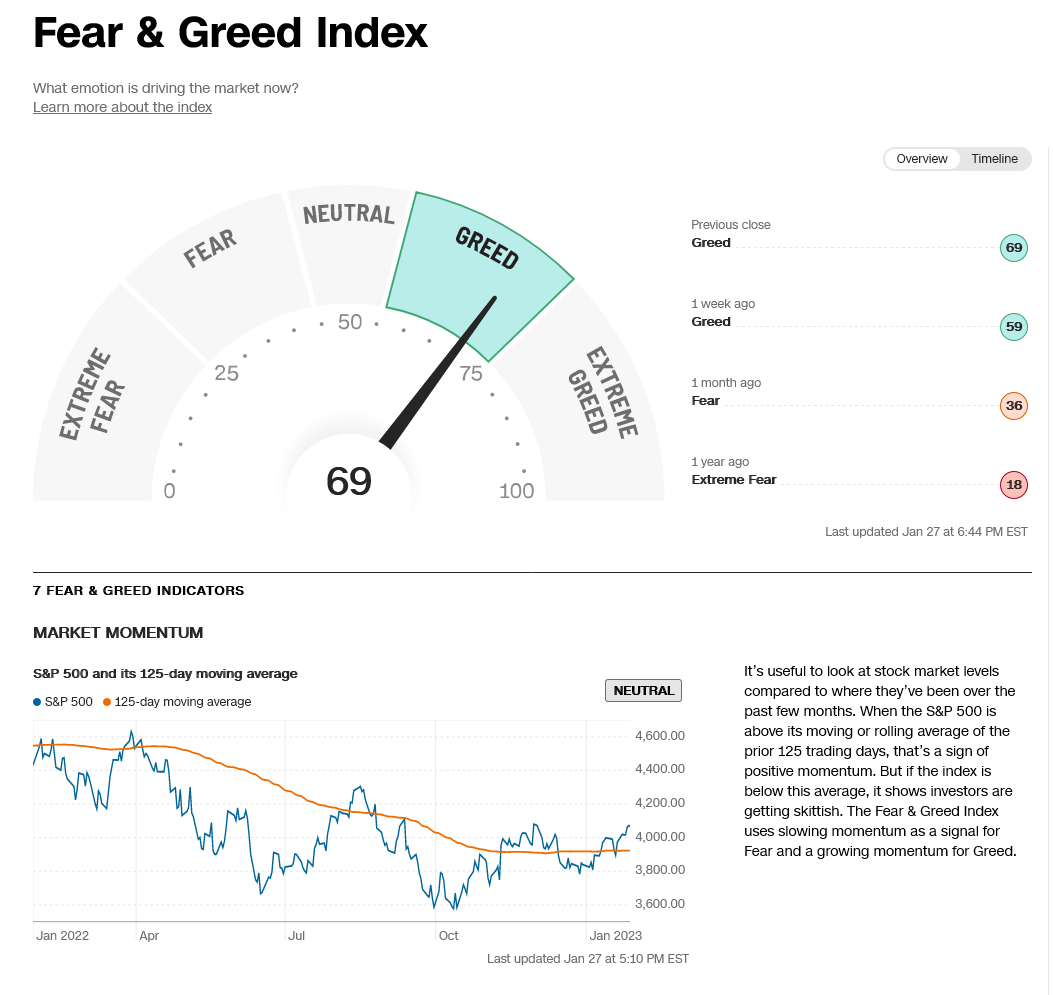
The DJIA traded an inside week and settled in the upper end of the weekly range, closing out the week with an advance of +1.8%. The Dow continued to lag the S&P, Nasdaq and Russell which had stronger intraweek performances. Sentiment is leaning toward greed again and the 52-week new highs/lows closed at a very frothy level of +1.86. Global markets continue in strong upside trends with rallies in the KLSE, Straits, Hang Seng, ASX, FTSE and others all showing strong uptrends while also showing extremely frothy A/D lines. The only global market to suffer recently has been the NIFTY. Prices dropped sharply heading into Friday’s close as they reacted to both trendline resistance and very overbought conditions on the hourly charts. The S&P rallied above trendline resistance on the daily, showing a bona fide breakout of the large triangle pattern that has developed over the past few months. The daily is overbought with the slow stochastics hooking up with the rally last week.
Dow Jones Industrial Average Daily HLC
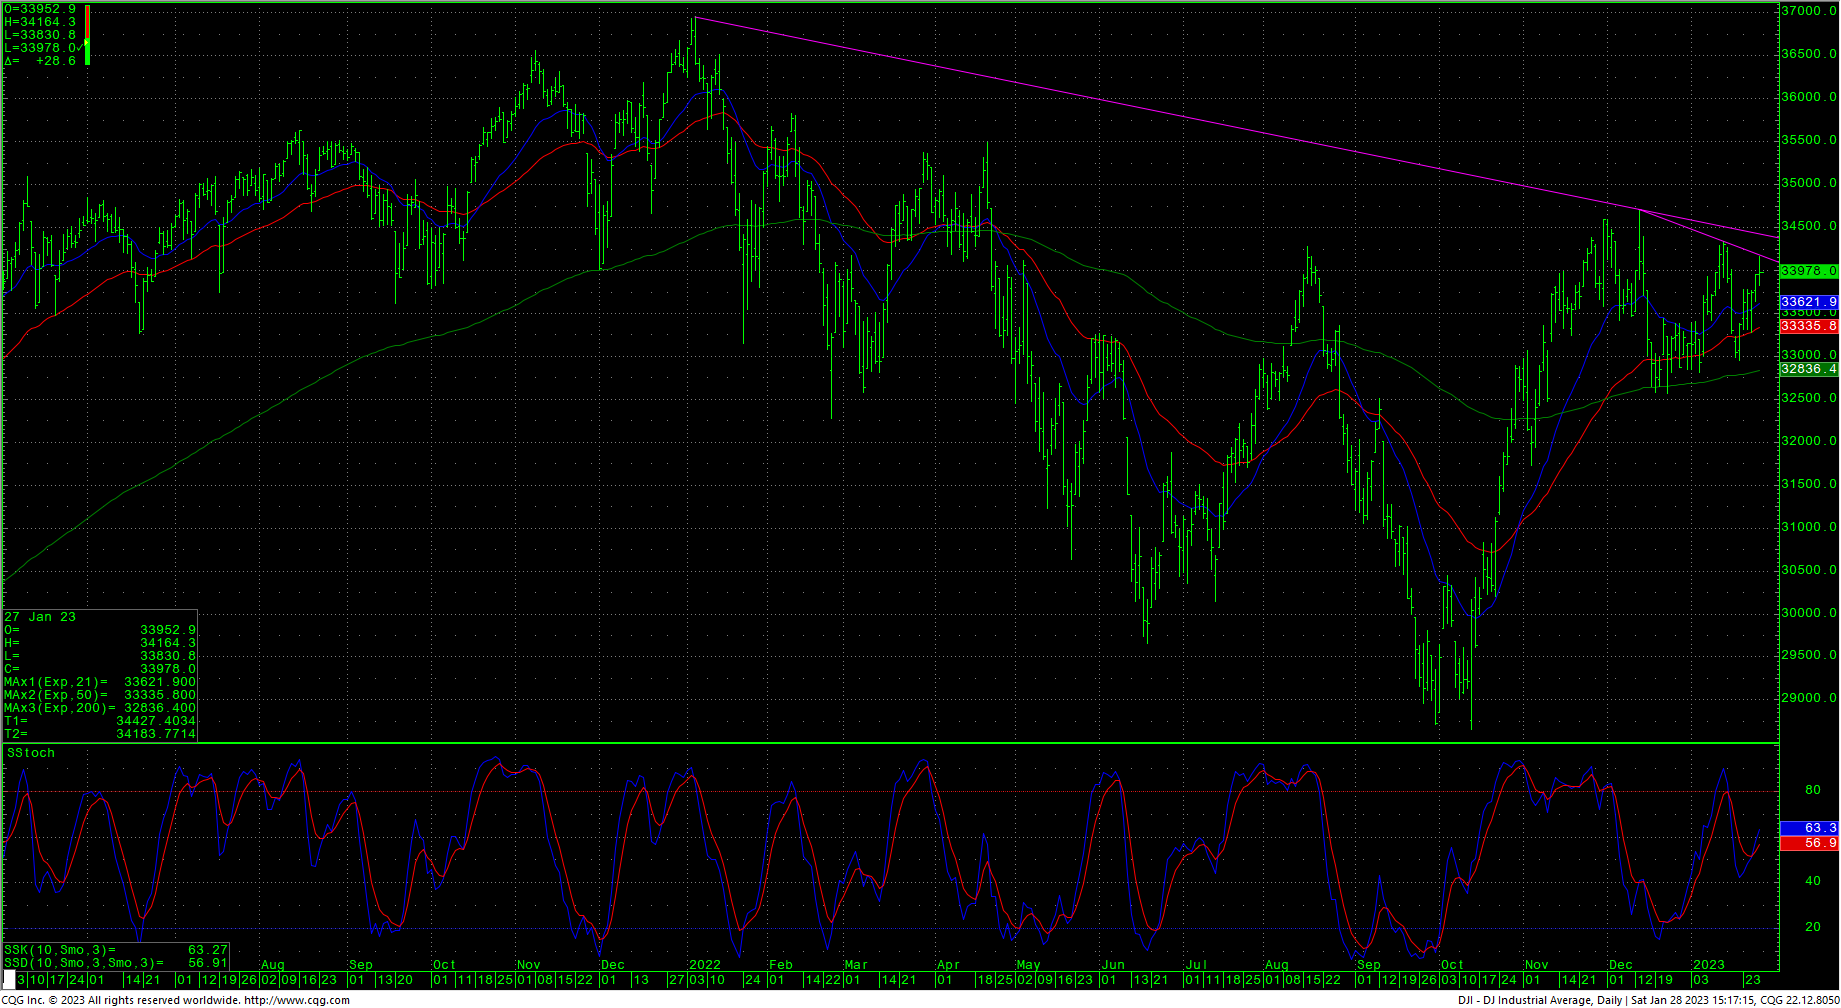
Resistance is at 34164 and continued rallies through this level should test 34342 with potential to pivotal resistance at 34395/34400. A drive above 34400 opens counts to 34589 and the December swing highs at 34712 and will open potential to a band of long-term resistance at 34879 through 34995/35000. This band at 35000 is not just a psychological benchmark but is pretty much the final area of weekly resistance before setting the DJIA up to probe the Spring 2022 tops at 35492 and the February 2022 tops at 35824. Closes over 35800/35824 would signal a test of the record highs at 36799 and 36952.
CNN Fear & Greed Index
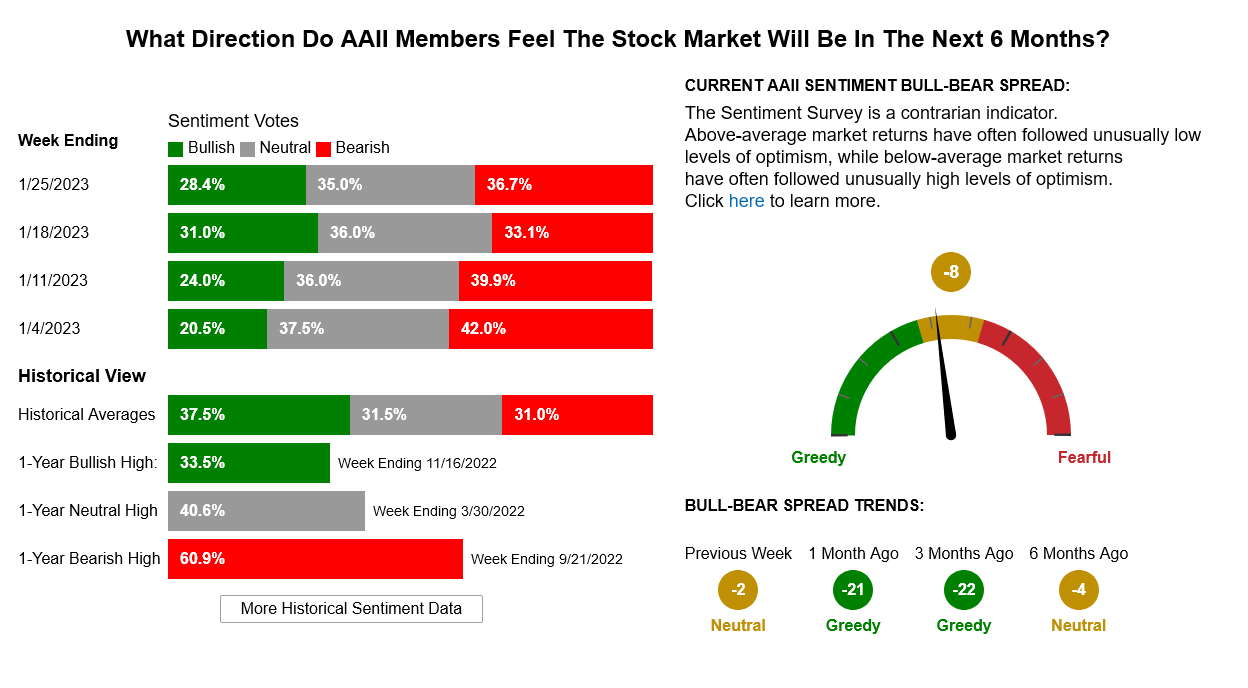
AAII Investor Sentiment Survey
Support is 33955 and near-term pivotal against 33823/33820, A breakdown under 33820 sets up 33718/33700 with potential to critical short-term support of 33613/33600. Closes under 33600 suggest 33556 with potential to 33413/33400. Closes under 33400 will count to critical support at 33249/33240. Trade back under 33240 is a bearish signal and should test 32948 with full potential to that last major swing lows at 32600/32573. Below that is support at 32400 and 32343. A breakdown under 32343 opens counts to key short-term support of 32170. A breakdown with closes under 32170 sets up 32099 with longer-term potential toward 31727/31686. Closes under 31686 will open counts into the 30972/30960 level with support of 31423 and 31160.
Resistance
- 34164 ***↑
- 34207 **
- 34342 *** ↑
- 34395/34400 ** ↑
- 34589 *** ↑
- 34700/34712 *** ↑
- 34879 **
- 34995/35000 *** ↑
- 35190 **
- 35360 **
- 35492 *** ↑
- 35800/35824 *** ↑
- 36799/36952 *** ↑
Support
- 33955 **
- 33823/33820 *** ↓
- 33718/33700 *** ↓
- 33613/33600 *** ↓
- 33556 ***
- 33413/33400 *** ↓
- 33240 ***
- 33146 ***
- 33013/33000 **
- 32948 ** ↓
- 32867/32850 *** ↓
- 32800 *** ↓
- 32654 **
- 32600/32573 *** ↓
S&P 500 Cash Index
As mentioned above, the S&P index rallied above the trendline on the daily chart, showing a breakout of the large triangle pattern on that chart. Resistance is key now at 4100 and rallies through 4100 should minimally test 4155. A breakout over the 4155 level gives counts to a gap area at 4203 to 4218 and longer-term counts to critical resistance of 4311/4315. Daily closes over 4315 open counts to 4385 with full potential to long-term critical resistance of 4486/4505.
S&P 500 Index Daily HLC
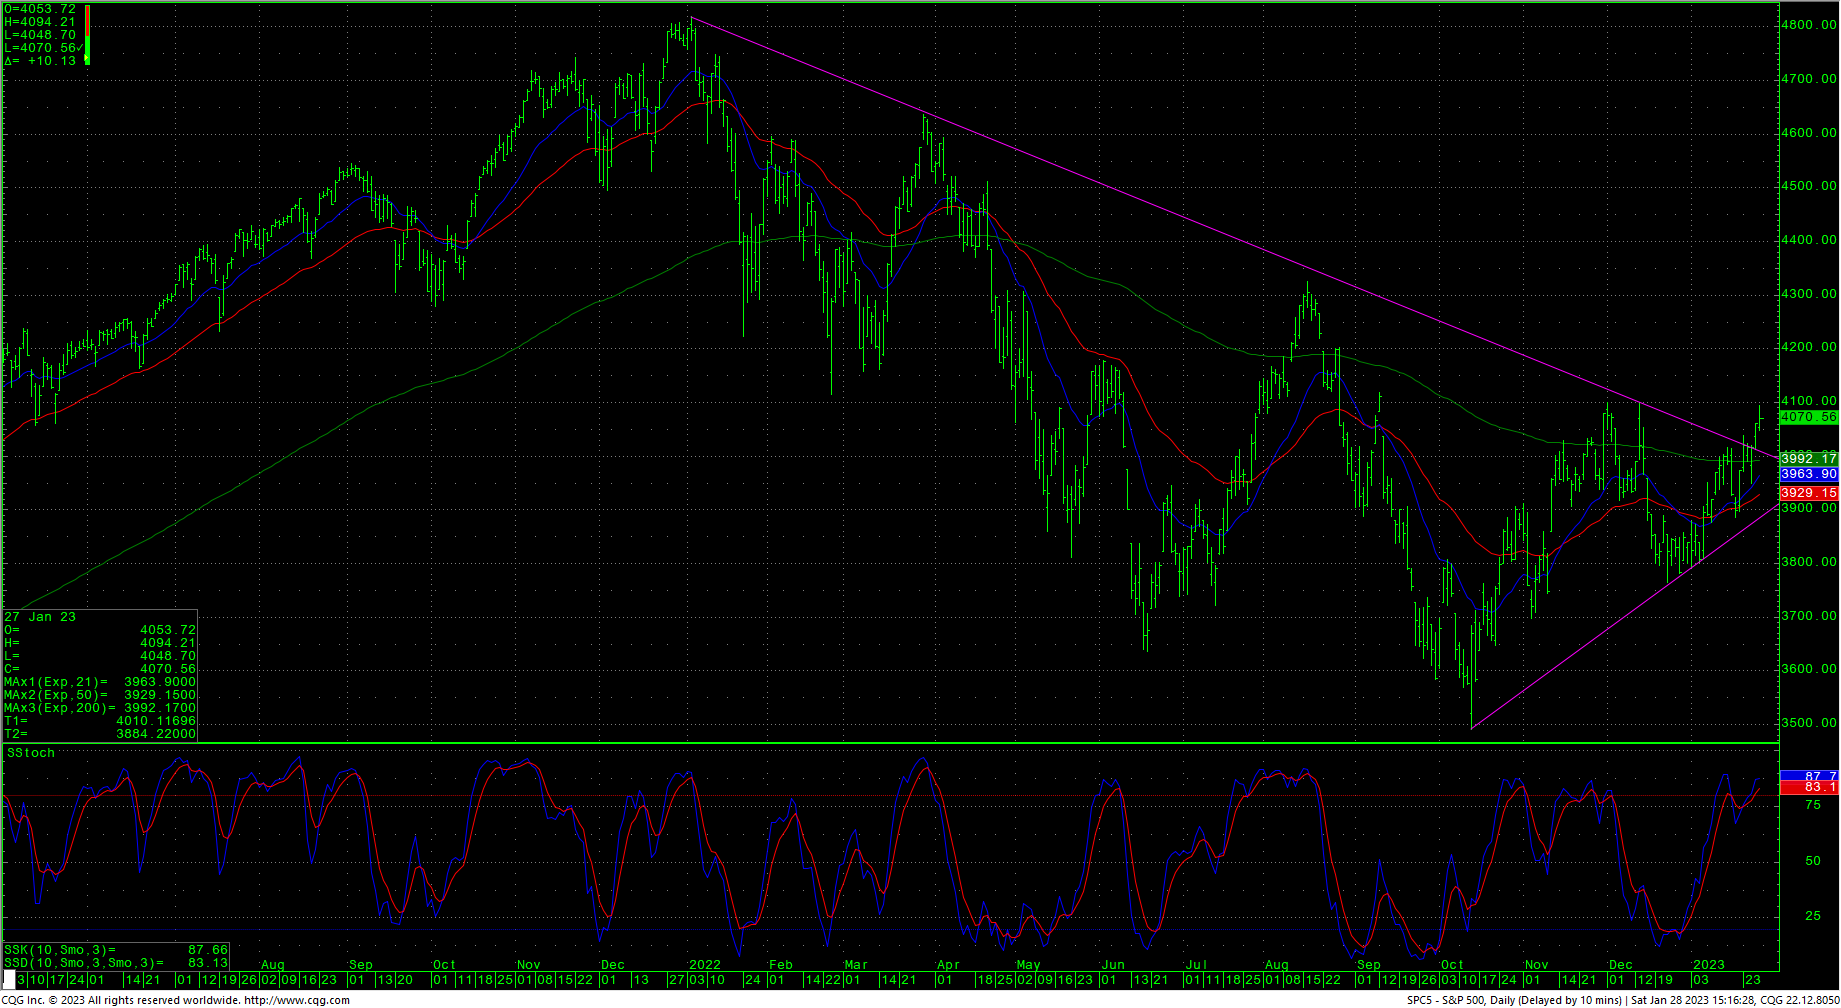 Support is at 4016 and near-term pivotal at 4016/4014. A breakdown under 4014 suggests 3989 with counts to critical short-term support of 3889/3885 and trading support of 3969. Daily closes under 3885 opens counts to 3764 with support at 3799/3797. Under 3764 sets up a retest of intermediate-term support against the 3724/3720 area. Closes under 3720 open counts to 3643/3635. Under 3635 is bearish and signals a test of the lows at 3491.
Resistance
- 4100 ***
- 4155 *** ↑
- 4203/4218 ***
- 4311/4315 *** ↑
- 4350 **
- 4385 *** ↑
- 4430 **
- 4486 *** ↑
- 4505 *** ↑
Support
- 4016/4014 *** ↓
- 3989 *** ↓
- 3969 *** ↓
- 3935 **
- 3889/3885 *** ↓
- 3855/3850 **
- 3815 **
- 3799/3797 *** ↓
- 3764 *** ↓
- 3724/3720 *** ↓
- 3643/3635 *** ↓