
TECHNICAL ANALYSIS
The DJIA traded a narrow, inside week and settled slightly lower…closing down -0.17% toward the middle of the week’s range. The action does little to the charts as the Dow has basically been stuck in a trading range since the wide range of December 22, 2022. Sentiment remains neutral with a slight bias to greed while the AAII Sentiment Survey hit the highest bullish reading since December of 2021. The S&P fared worse, settling the week down -1.11%, in the lower end of the weeks range. Prices traded back under the breakout level of 4100 on the daily chart and ended the week just below that key point. The action started to relieve some of the overbought conditions on the daily while leaving the hourly in a deeply oversold condition on the stochastics. The Nasdaq Composite ended the week down -2.40% in the lower end of its weekly range.
Dow Jones Industrial Average Weekly HLC
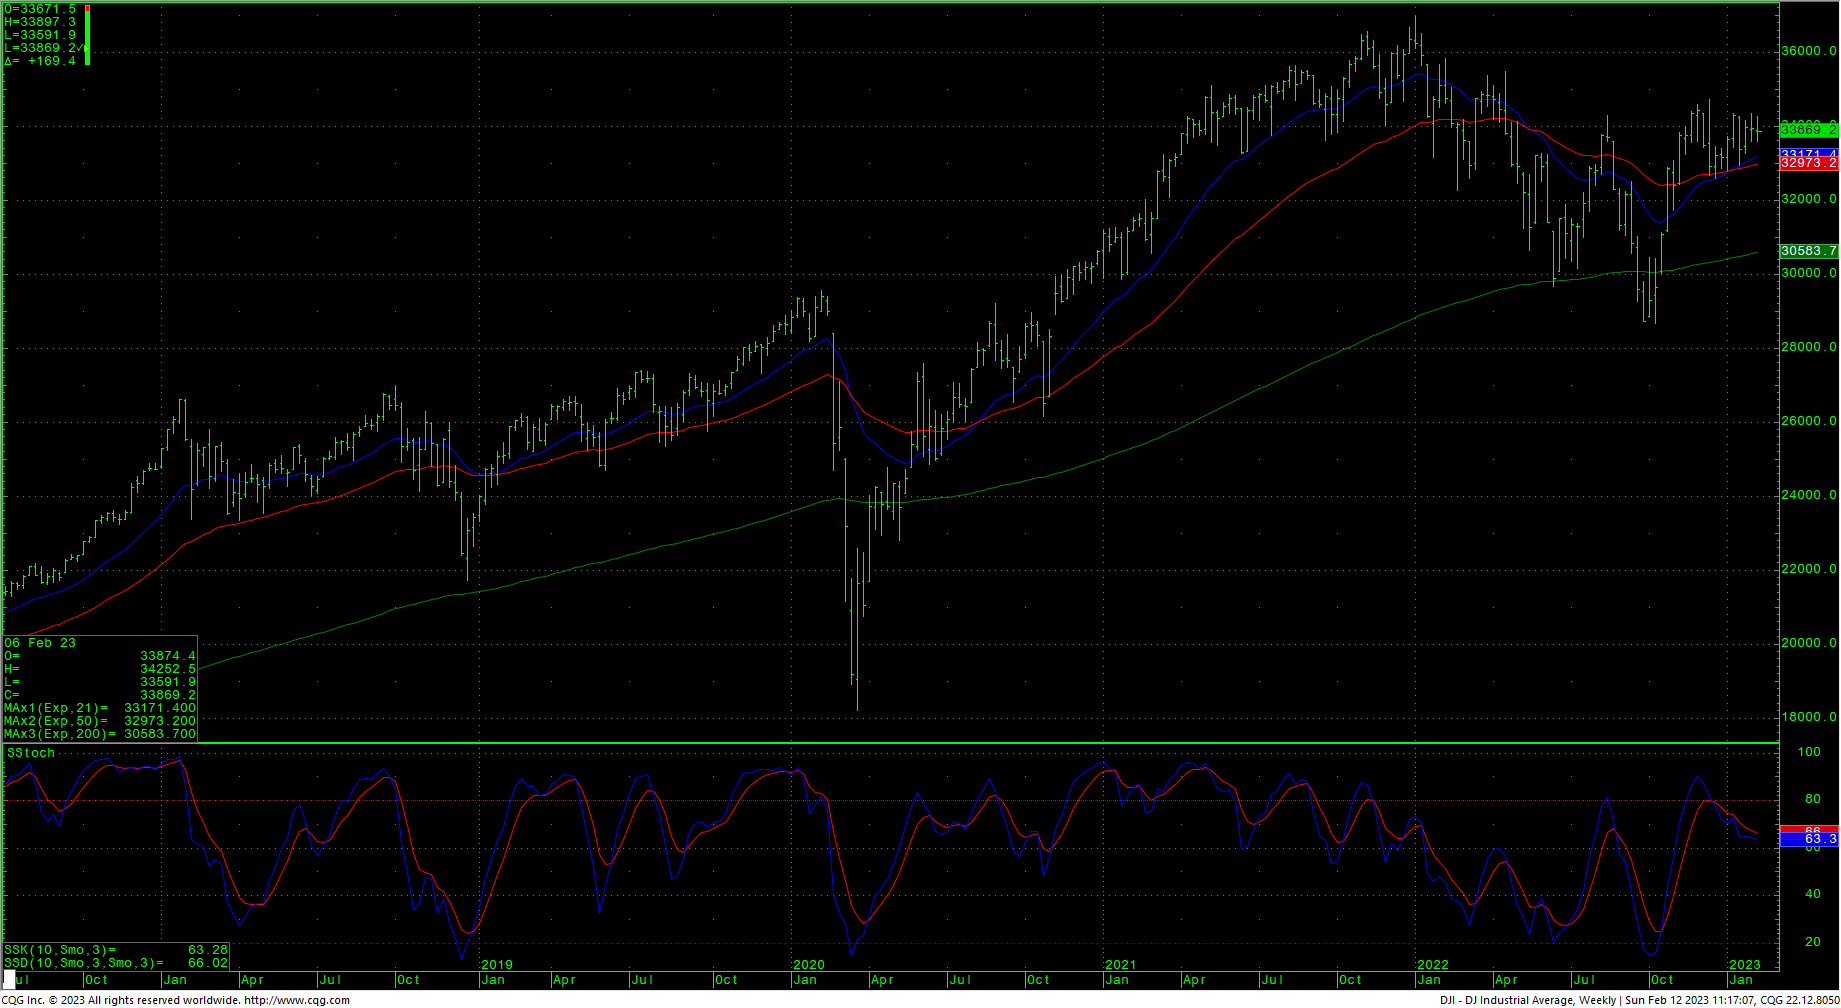
Resistance for the DJIA is 33963 and 34050/34060. A drive above 34060 should test 34150/34160. Rallies through the 34160 level should retest 34334/34342 with potential to pivotal resistance at 34395/34400. A drive above 34400 opens counts to 34589 and the December swing highs at 34712 and will open potential to a band of long-term resistance at 34879 through 34995/35000. This band at 35000 is not just a psychological benchmark but is pretty much the final area of weekly resistance before setting the DJIA up to probe the Spring 2022 tops at 35492 and the February 2022 tops at 35824. Closes over 35800/35824 would signal a test of the record highs at 36799 and 36952.
CNN Fear & Greed Index

AAII Investor Sentiment Survey

Support remains at 33813 and near-term pivotal against 33666/33660, A further breakdown under 33660 sets up 33571 and 33457 with potential to pivotal short-term support of 33220. Closes under 33220 will count to 33015/32990 with potential to critical support at 32867/32860. Unser 32860 setup a decline to support at 32473 and 32431. A breakdown under 32431 opens counts to key short-term support of 32170. A breakdown with closes under 32170 sets up 32099 with longer-term potential toward 31727/31686. Closes under 31686 will open counts into the 30972/30960 level with support of 31423 and 31160.
Resistance
- 33963 **
- 34050/34060 *** ↑
- 34150/34160 ***↑
- 34207 **
- 34334/34342 *** ↑
- 34395/34400 ** ↑
- 34589 *** ↑
- 34700/34712 *** ↑
- 34879 **
- 34995/35000 *** ↑
- 35190 **
- 35360 **
- 35492 *** ↑
- 35800/35824 *** ↑
- 36799/36952 *** ↑
Support
- 33813 **
- 33720 **
- 33666/33660 *** ↓
- 33571 *** ↓
- 33457 **
- 33400 **
- 33225/33220 *** ↓
- 33146 **
- 33013/33000 **
- 32948 ** ↓
- 32867/32860 *** ↓
- 32800 *** ↓
- 32654 **
- 32600/32573 *** ↓
S&P 500 Cash Index
As mentioned above, the S&P index closed down over 1% on the week in the lower end of the weeks range and under the previous breakout point of 4100 on the daily. The action does little to the technicals with the short-term charts oversold as of Friday’s close. Resistance is 4112, 4128 and 4144/4147. A breakout over the 4147 level gives counts to a gap area at 4203 to 4218 and longer-term counts to critical resistance of 4311/4315. Daily closes over 4315 open counts to 4385 with full potential to long-term critical resistance of 4486/4505. Closes over 4505 can carry to 4593 with full potential toward 4637.
S&P 500 Index Weekly HLC
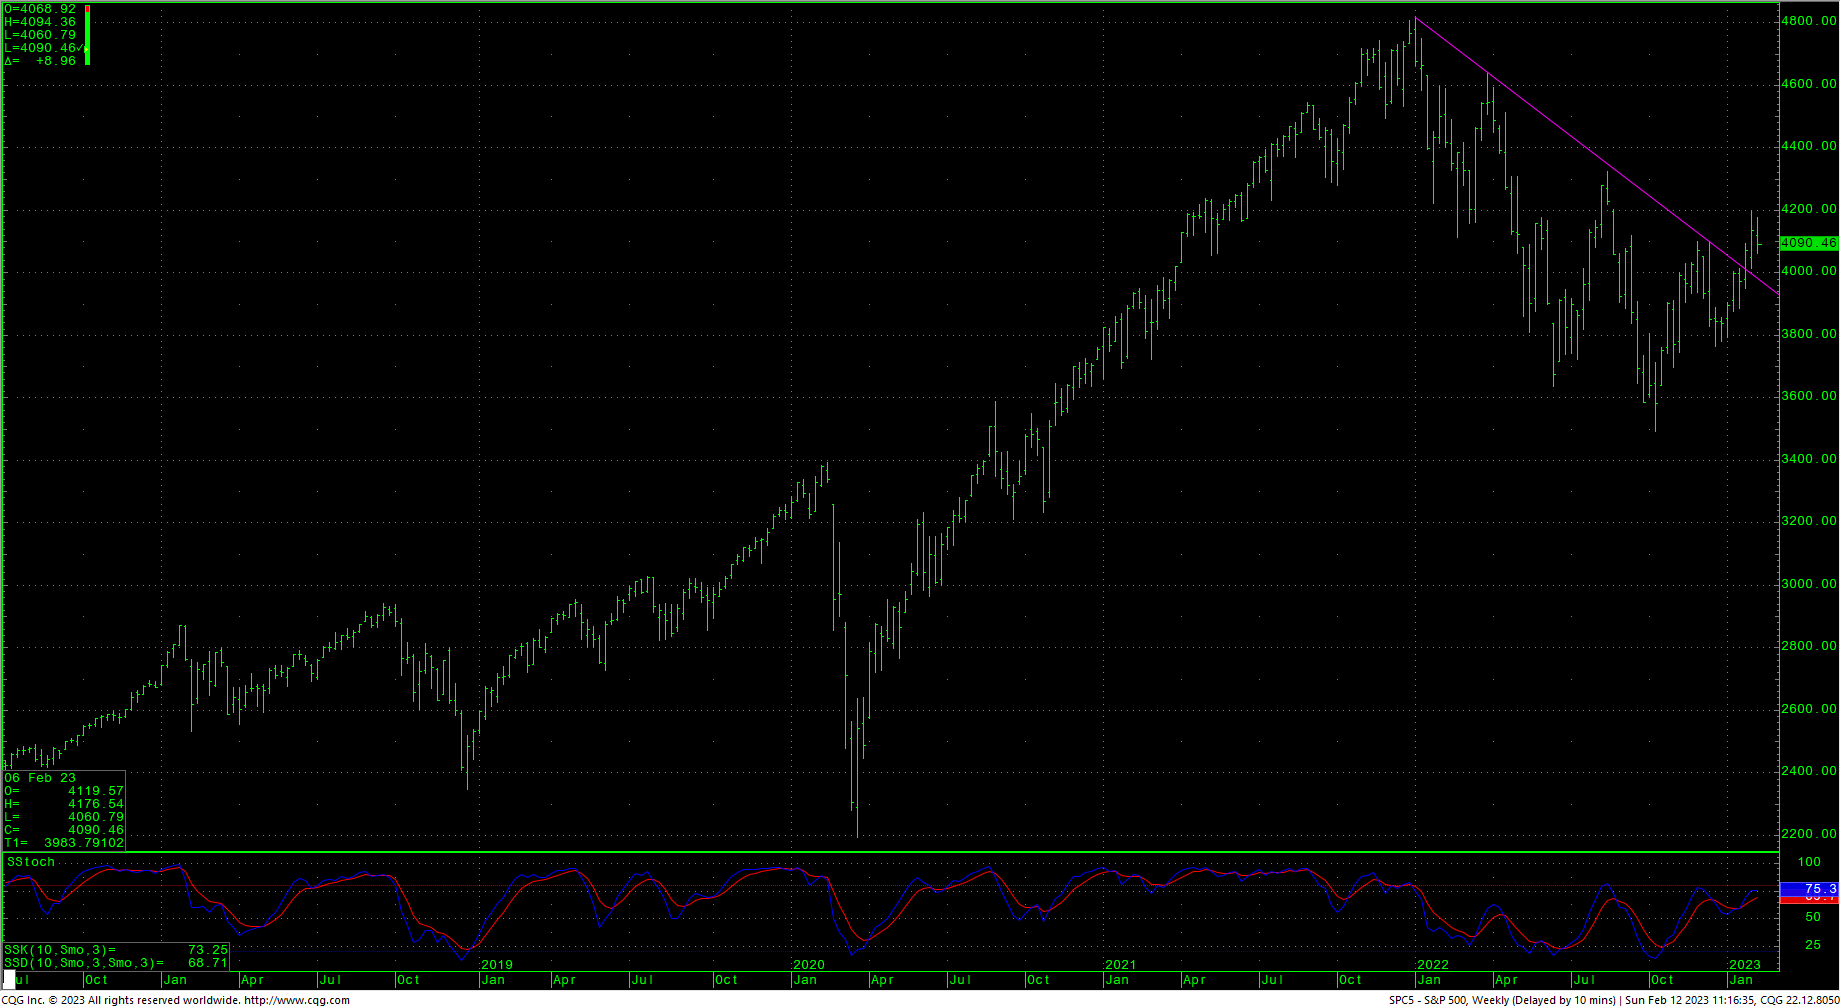
Support is at 4062/4060 and pivotal against the 4031/4028 area. Closes under 4028 suggest 3979 with counts to critical short-term support of 3929/3920 and trading support of 3949. Daily closes under 3920 open counts to 3764 with support at 3799/3797. Under 3764 sets up a retest of intermediate-term support against the 3724/3720 area. Closes under 3720 open counts to 3643/3635. Under 3635 is bearish and signals a test of the lows at 3491.
Resistance
- 4112 **
- 4128 ***
- 4144/4147 *** ↑
- 4195 ** ↑
- 4203/4218 ***
- 4311/4315 *** ↑
- 4350 **
- 4385 *** ↑
- 4430 **
- 4486 *** ↑
- 4505 *** ↑
- 4593 **
- 4637 *** ↑
Support
- 4062/4060 ***
- 4031/4028 *** ↓
- 3979 ***
- 3949 **
- 3929/3920 *** ↓
- 3855/3850 **
- 3815 **
- 3799/3797 *** ↓
- 3764 *** ↓
- 3724/3720 *** ↓
- 3643/3635 *** ↓

