
TECHNICAL ANALYSIS
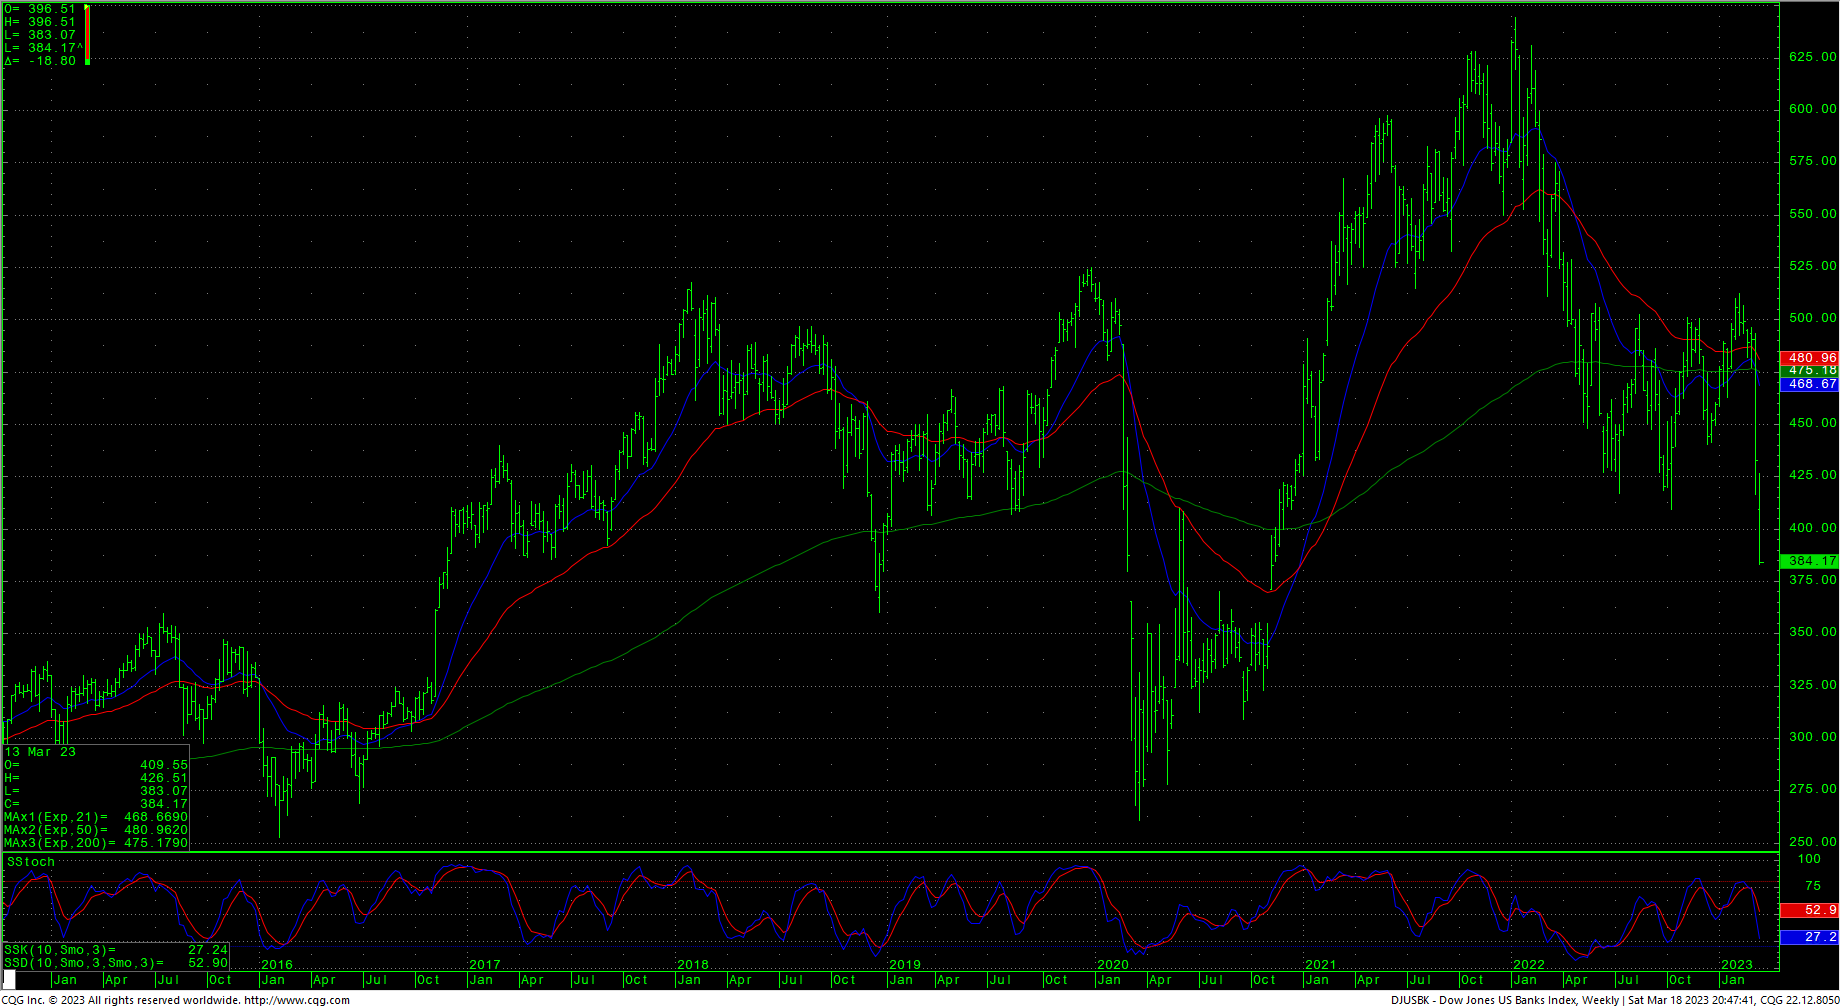
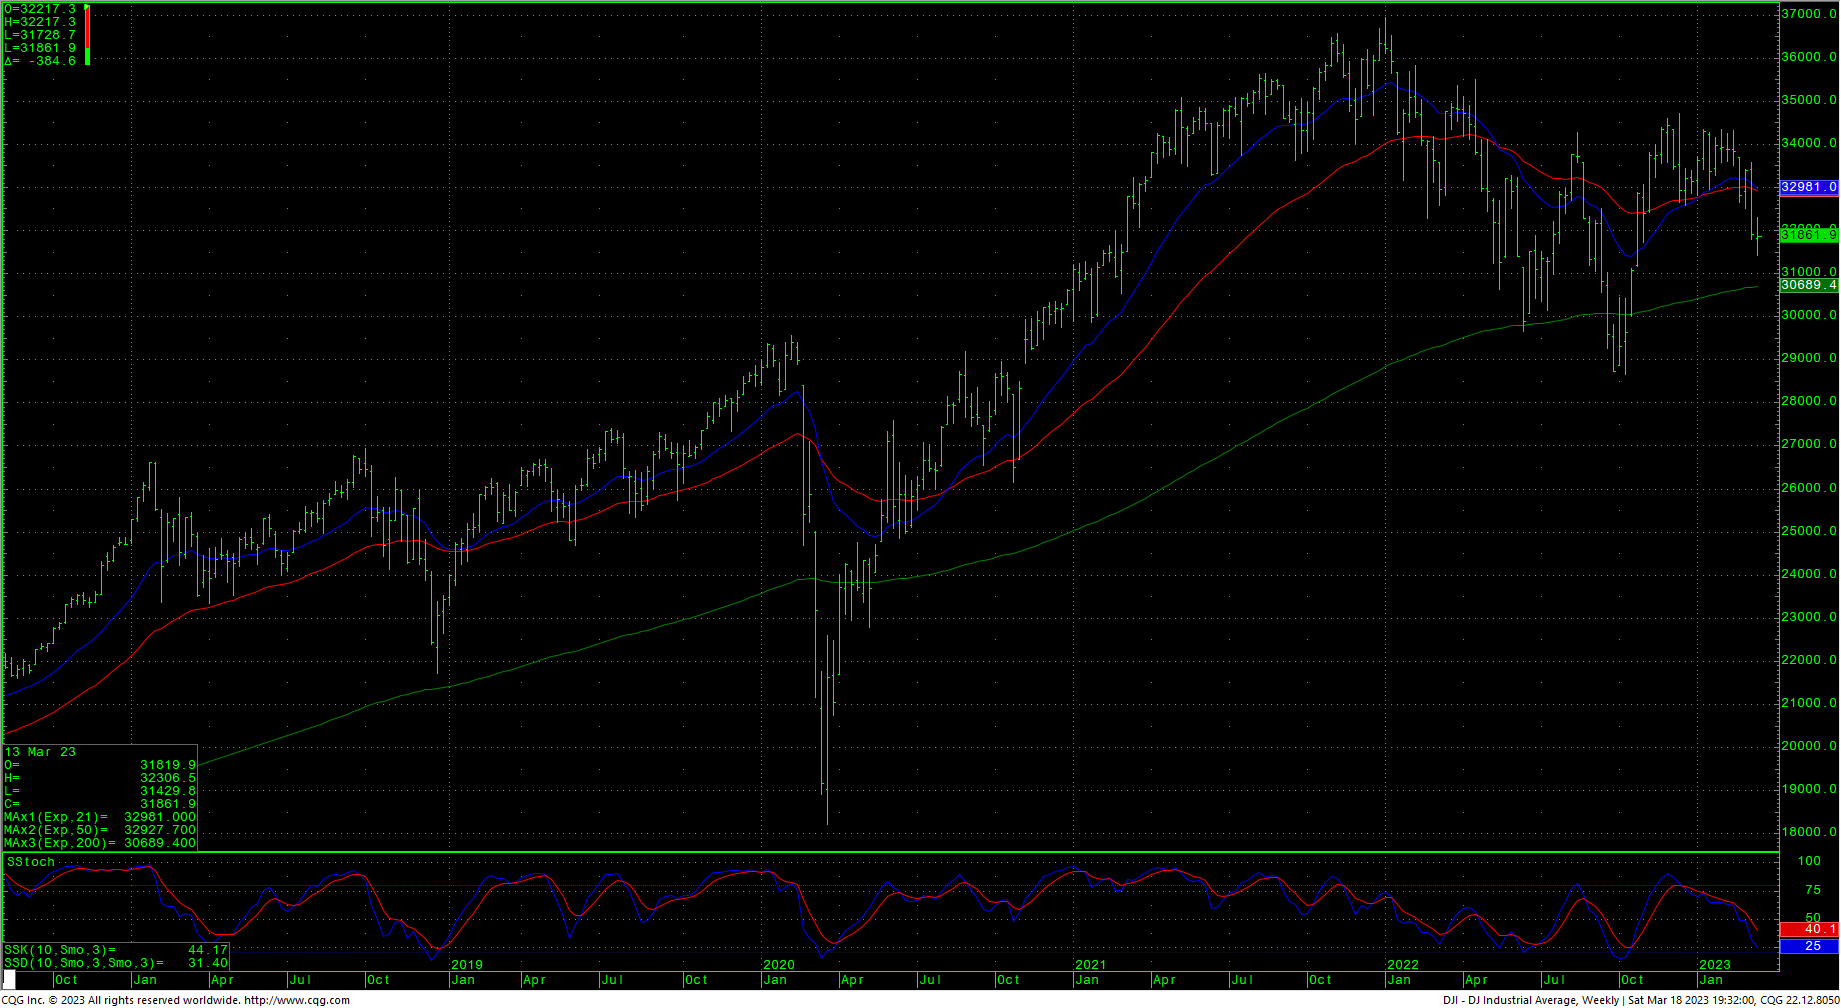
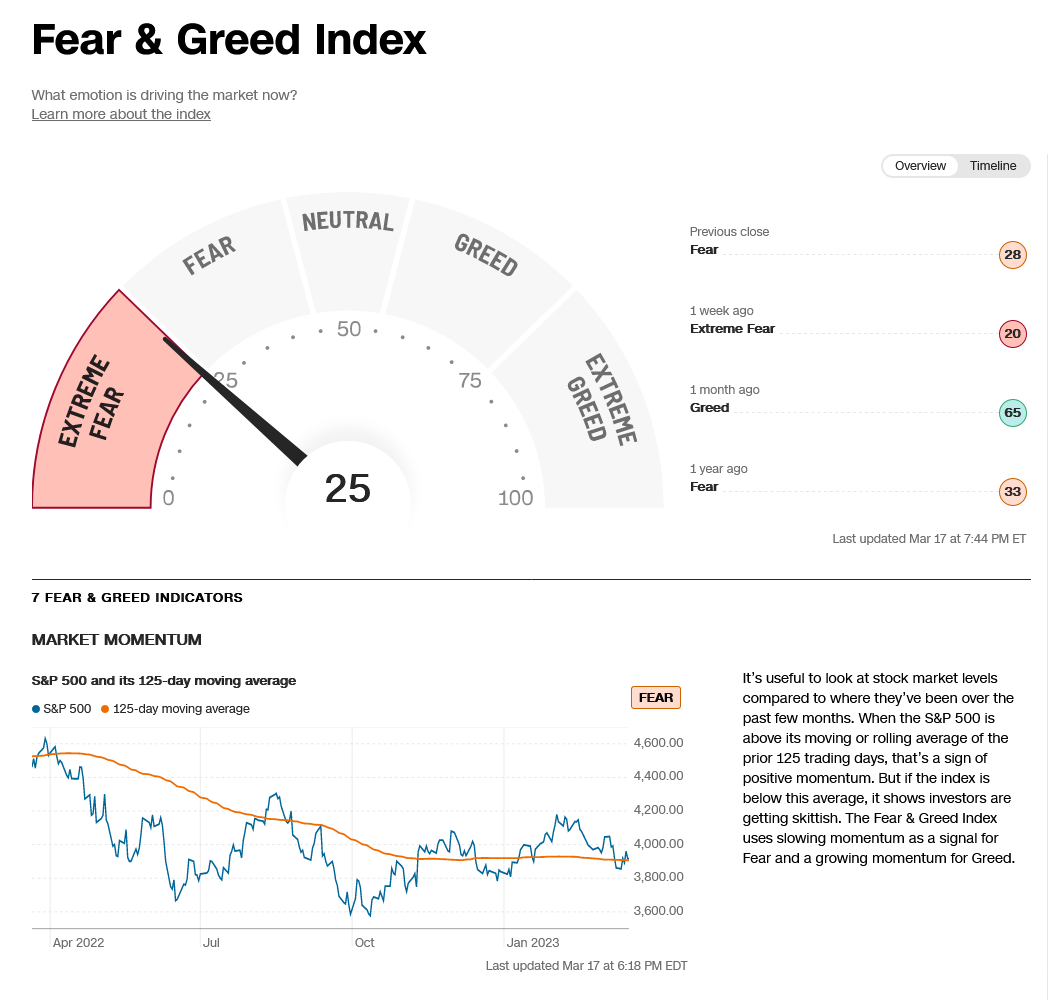
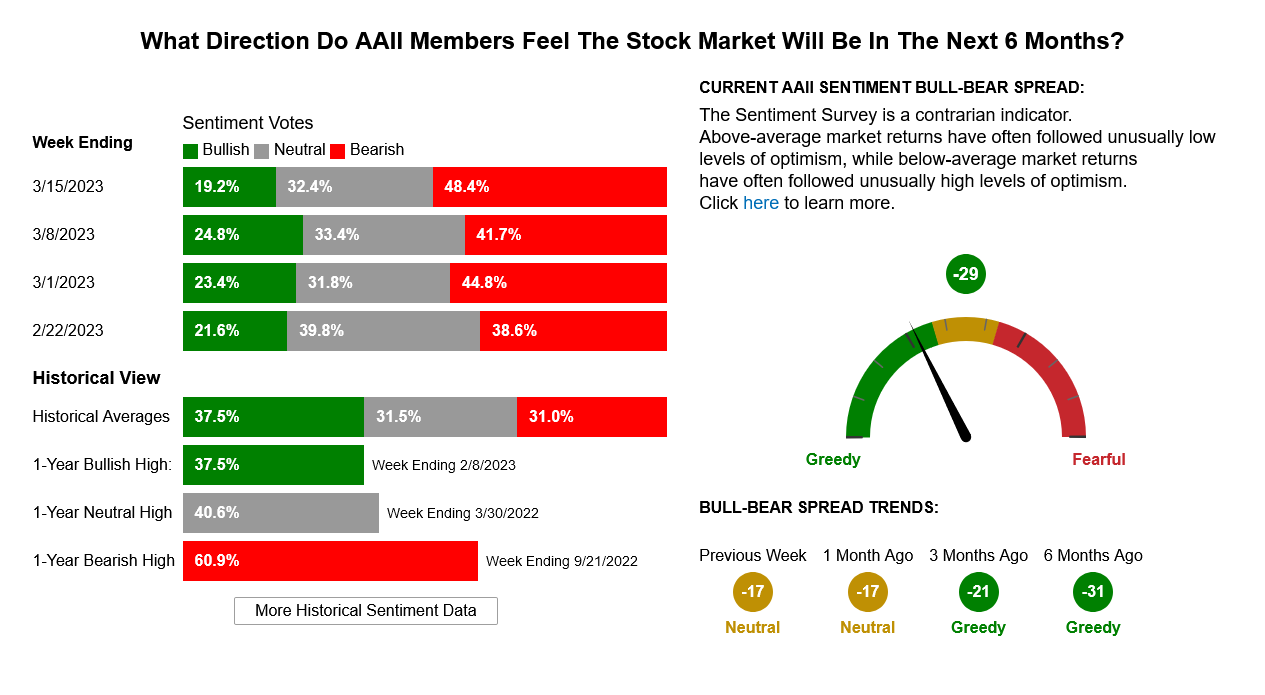
Stocks traded a volatile week amidst continuing bank crisis talk coupled with Fed worries about overly aggressive rate hikes leading to the liquidity crunch. The news has created a flight to quality with some large rallies in both the bond and gold markets last week. The DJIA settled down -0.14% in the middle of the weekly range as prices dipped to their lowest levels since late October 2022. The short-term charts are trying to relieve oversold conditions and market action has turned real-time sentiment bearish as the Fear index has risen. The 52-week High/low dipped finally to end at -1.62% last week. The short-term charts might be trying to mark out an inverted head and shoulders, but the steep decline under the 32000 level is making a C Wave scenario much more doubtful. The Dow Jones Bank Index took another massive hit last week, closing down -11.27% on the bottom of the week’s range. The S&P500 staged an upside reversal and closed the week up +1.43%. The Nasdaq closed up +4.42% in the upper end of the week’s range and is once again challenging the 50-week moving average..
Dow Jones Banking Average Weekly HLC
Support for the Dow remains pivotal now against 31727/31686. A continued breakdown with closes under 31686 will open counts into the 30972/30960 level with support of 31429/31423 and 31160. There is a gap on the daily chart that runs from 31160 to 31119. Critical weekly support runs from 30972/30950 and closes under that level would minimally open counts into the 30206/30173/30089 area.
Dow Jones Industrial Average Hourly HLC
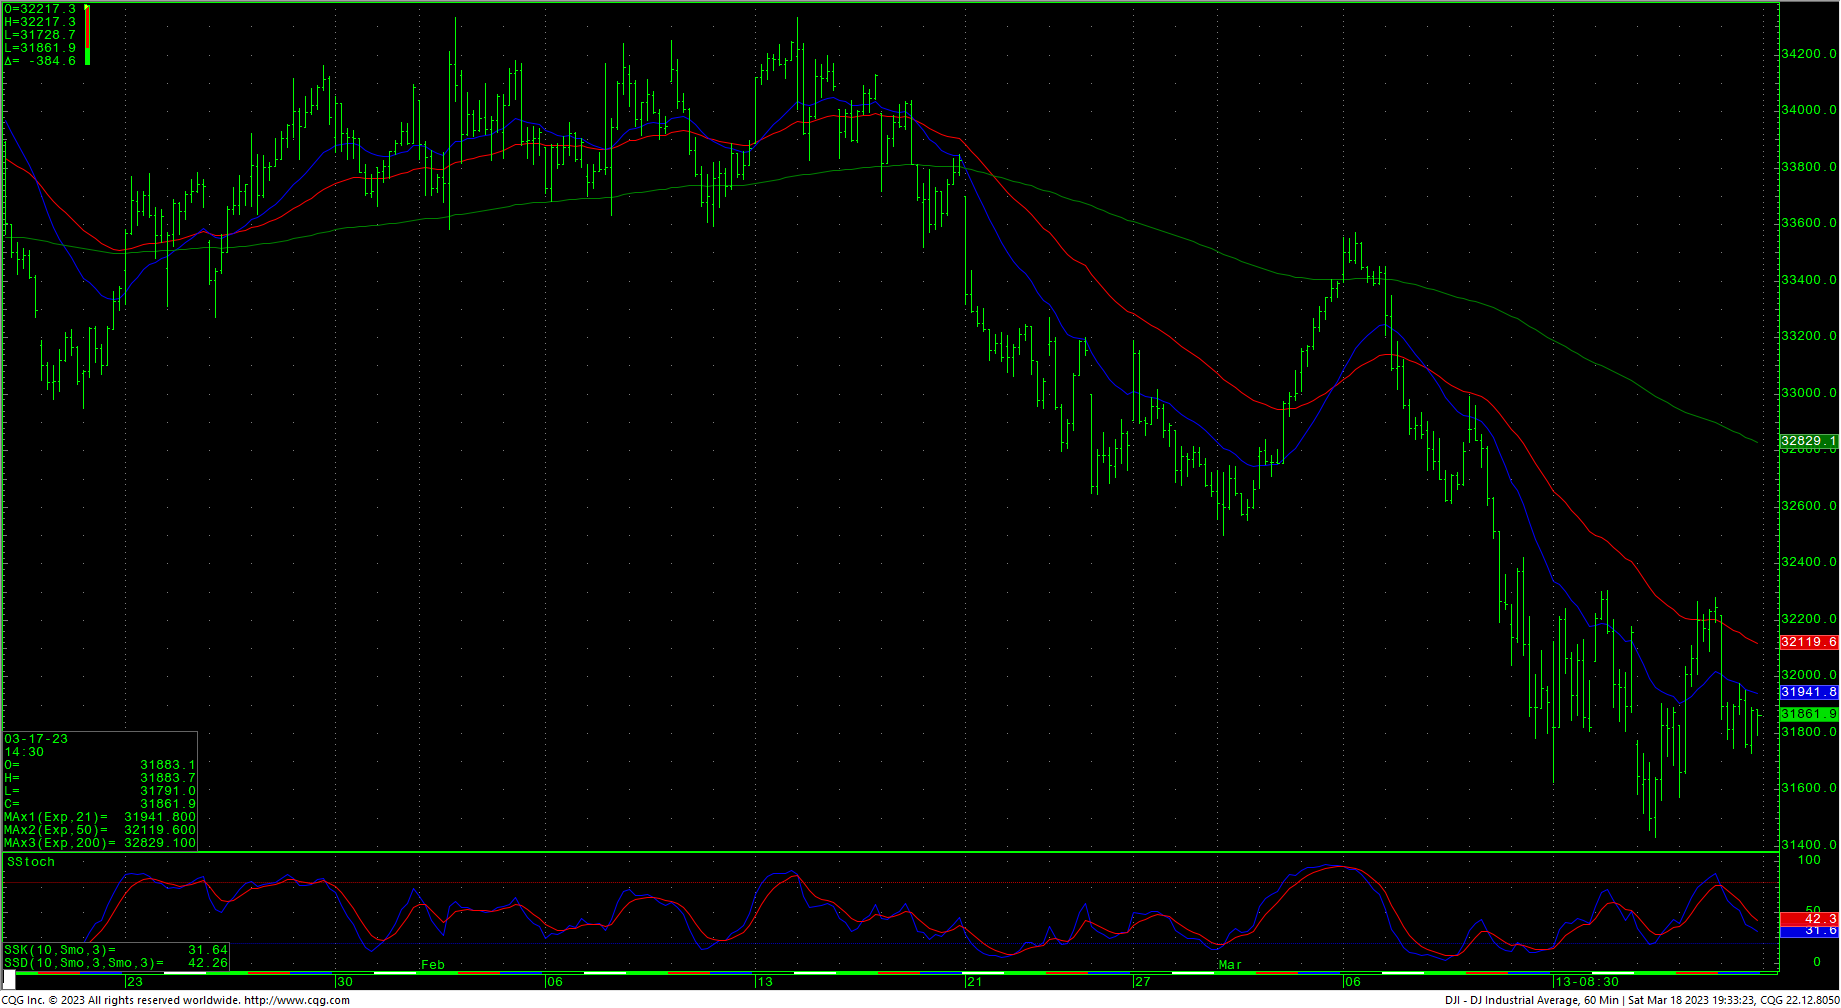
Resistance is at 31935, 32114, 32248 and 32306. Rallies above 32306 can carry to 32501 with counts to 32753/32760. Closes over 32760 should test 32880 with counts to pivotal short-term resistance at 33222/33330. Closes over 33330 set up a drive to 33572 with counts to critical resistance of 33572/33646. A breakout over 33646 is bullish and opens counts to 33980/34021. Rallies through 34021 suggest 34222 and 34334 with full counts back critical resistance at 34589.
Dow Jones Industrial Average Weekly HLC
CNN Fear & Greed Index
AAII Investor Sentiment Survey
 Support
- 31783 **
- 31727 *** ↓
- 31686 *** ↓
- 31575 **
- 31429/31423 *** ↓
- 31300 **
- 31161 ***
- 31119 *** ↓
- 30972/30950 *** ↓
- 30800 **
- 30650 **
- 30500/30454 *** ↓
- 30320 **
- 30206/30173 *** ↓
- 30089 *** ↓
- 29997 *** ↓
Resistance
- 31935 **
- 32114 **
- 32248 ***
- 32306 *** ↑
- 32410 **
- 32506 *** ↑
- 32625 **
- 32753/32760 *** ↑
- 32880 *** ↑
- 33000 **
- 33222/33330 *** ↑
- 33410
- 33572/33646 *** ↑
- 33790 **
- 33880 **
- 33980/34021 *** ↑
S&P 500 Cash Index
Support is 3905/3901, 3886 and 3868/3865. A breakdown under 3865 can test 3808 through 3797 with support at 3845. A breakdown with closes under 3799/3797 opens counts to critical support against the 3760/3750 level. Under 3750 sets up a move to 3657 and full potential back to critical long-term support of 3505/3491. Closes under 3491 open counts to critical weekly support of 3195/3180.
S&P 500 Index Weekly HLC
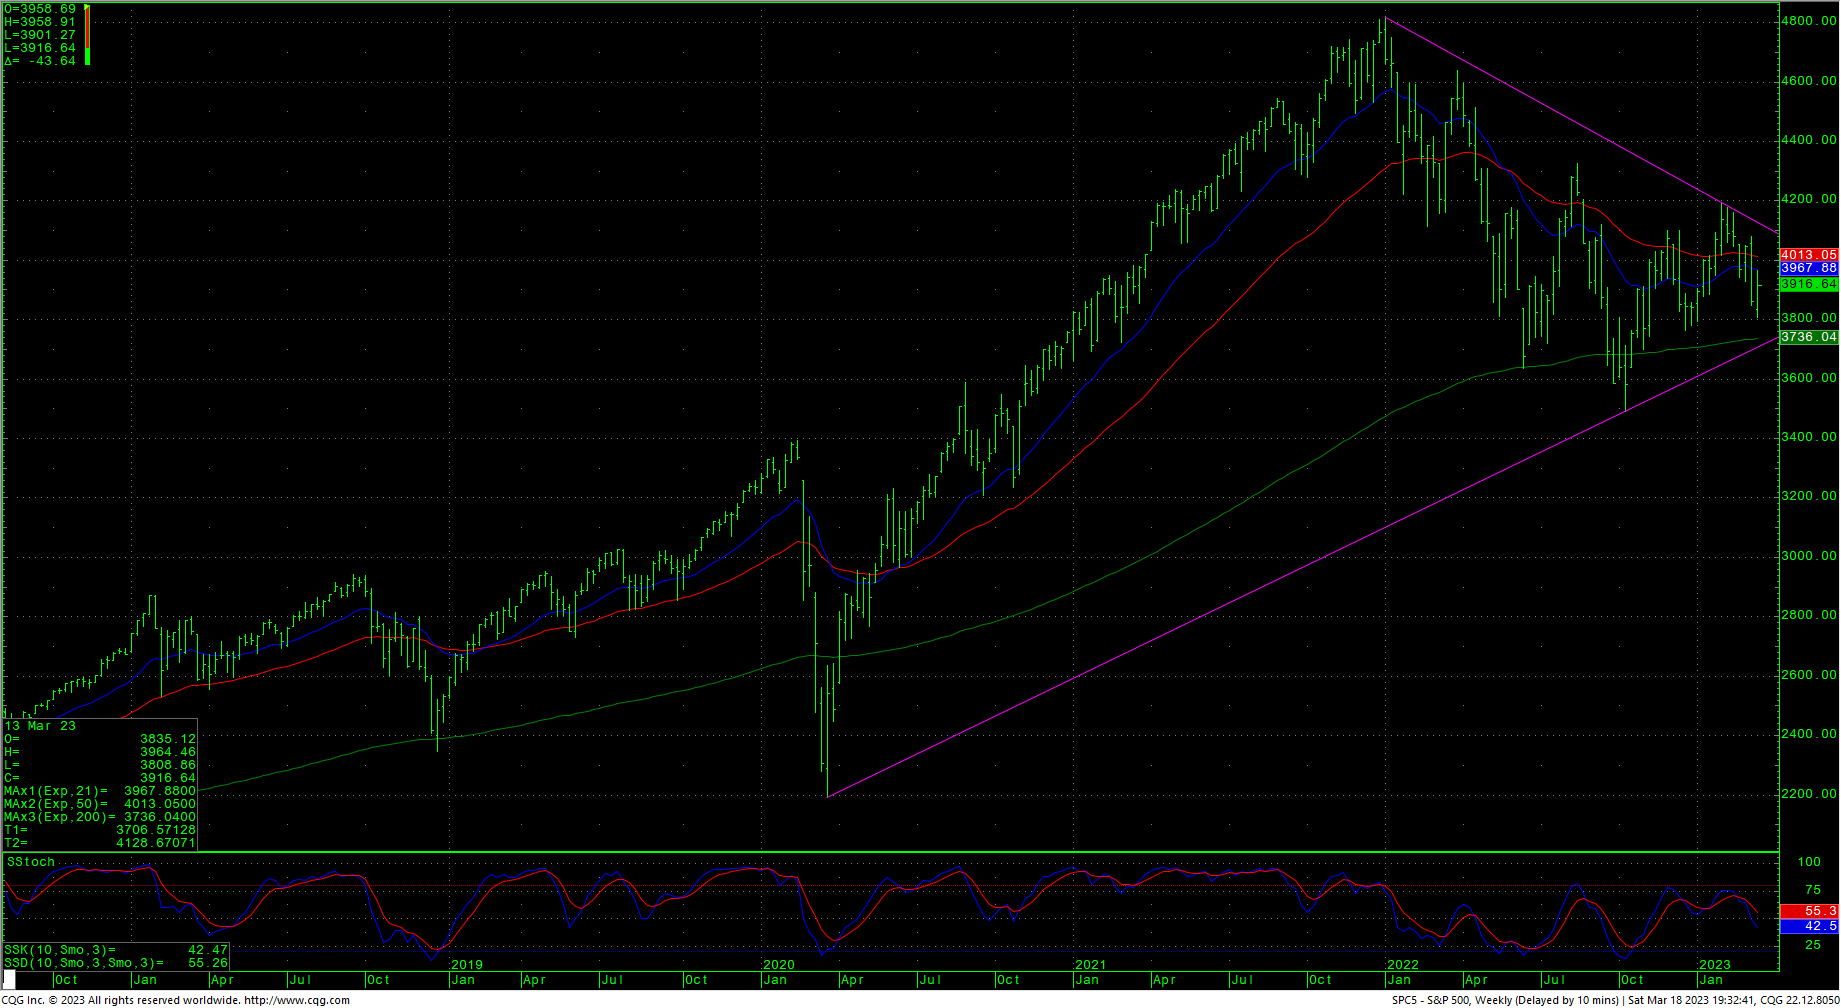
Resistance is 3956/3964 with pivotal short-term resistance at 3975/3977. Closes back above 3977 are near-term friendly and set up a drive to 4002 and possibly 4047/4050. A breakout above 4050 gives counts to 4077 and possibly 4098/4104, A drive above 4104 sets up a move to the gap area at 4203 to 4218 and longer-term counts to critical resistance of 4311/4315. Daily closes over 4315 open counts to 4385 with full potential to long-term critical resistance of 4486/4505. Closes over 4505 can carry to 4593 with full potential toward 4637.
Support
- 3905/3901 ***
- 3886 ***
- 3868/3865 *** ↓
- 3845 **
- 3808 *** ↓
- 3799/3797 *** ↓
- 3760/3750 *** ↓
- 3667/3657 *** ↓
- 3584 **
- 3505/3491 *** ↓
- 3383 ***
- 3328 **
- 3259 **
- 3233 **
- 3195/3180 *** ↓
Resistance
- 3943 **
- 3956/3964 *** ↑
- 3975/3977 *** ↑
- 4002 ***
- 4047/4050 *** ↑
- 4077 ** ↑
- 4098/4104 *** ↑
- 4203/4218 ***
- 4311/4315 *** ↑
- 4350 **
- 4385 *** ↑
- 4430 **

