
TECHNICAL ANALYSIS
Major Indices Week of April 6, 2023
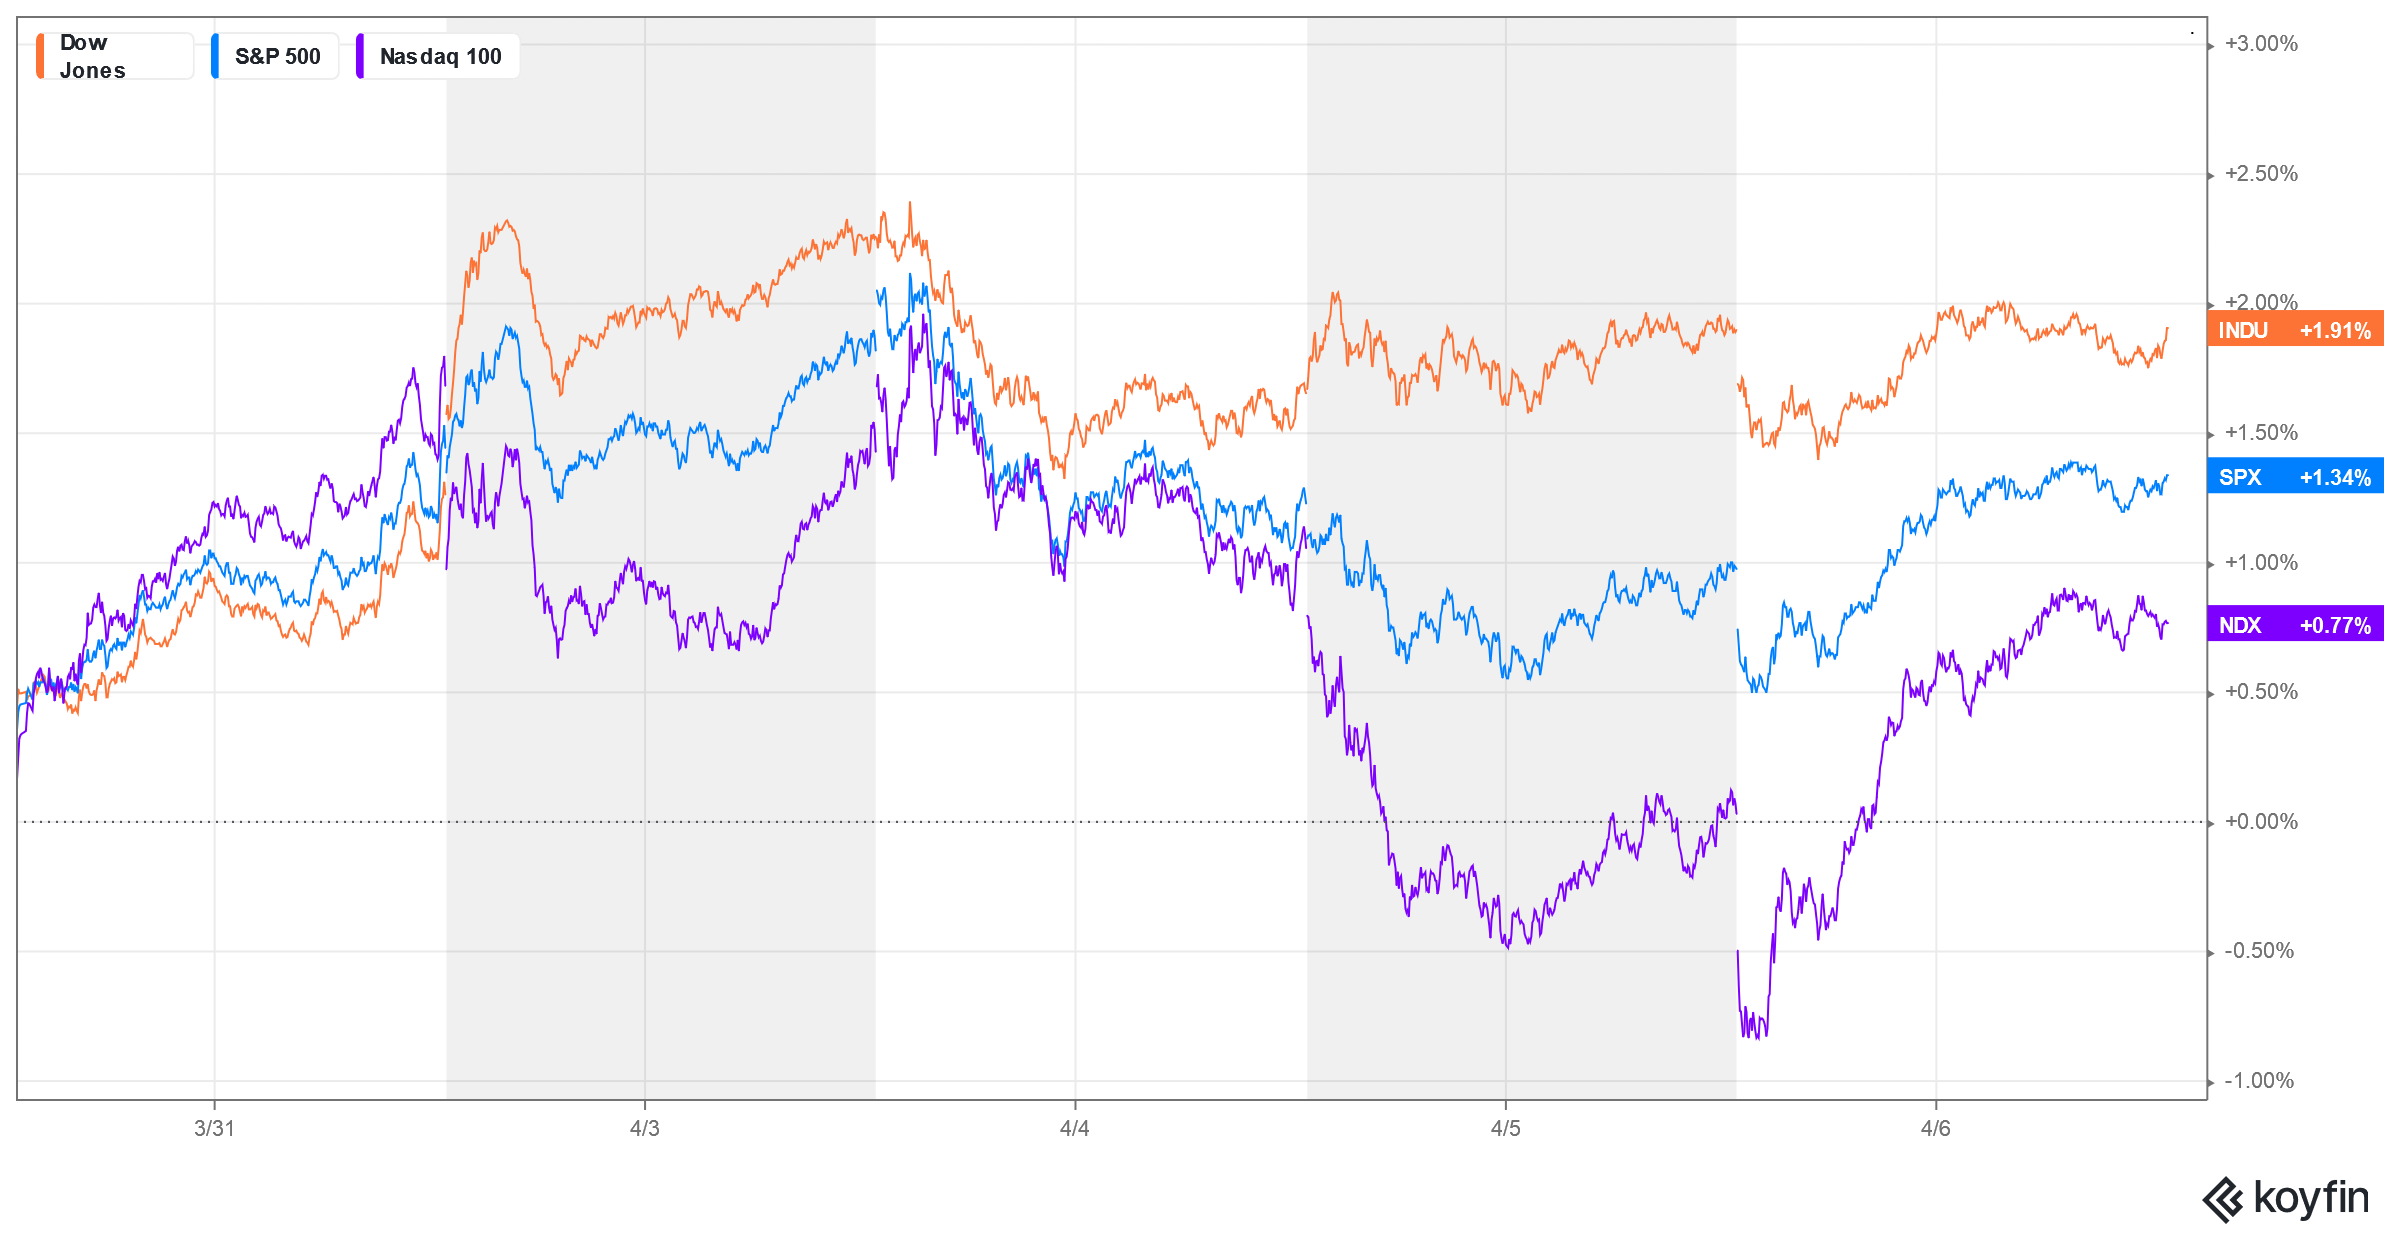 The Dow traded in an extremely tight, shortened weeks range, and closed up +0.63% in the middle of the weekly range. The S&P ended down -0.10% for the first lower close of the past four weeks. The Nasdaq closed down -1.07%. Sentiment has shifted to a neutral to greedy phase. The weekly chart is trying to hook up on the stochastics and the hourly looks like it is building a flag or triangle off the side of the past few week’s rally. Today and tomorrow are highlighted as strong timing dates with the focus on bonds and the dollar and all the financials in general. The Dow closed out the week just above a pivotal area of resistance at 33470.
Dow Jones Industrial Average Hourly HLC
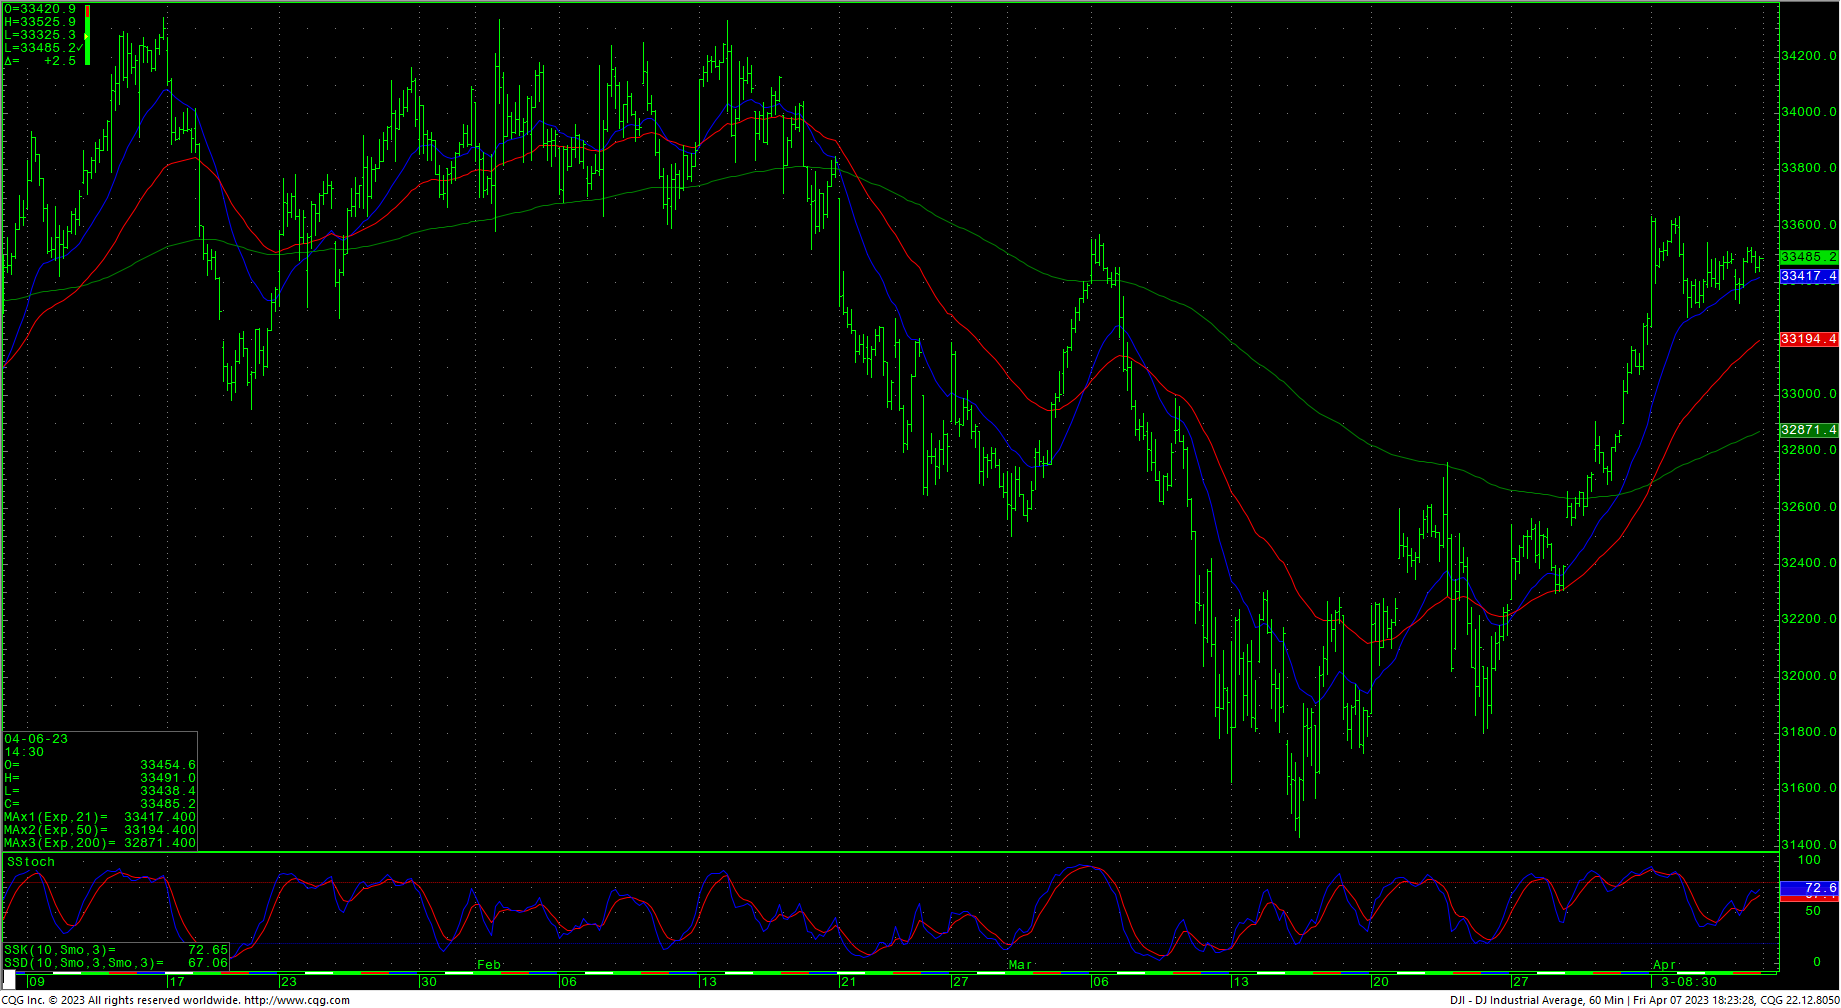
Continued rallies and closes above 33470 should retest 33572 with potential toward 33891/33937 with trading resistance at 33634 and 33699. A breakout over 33937 is bullish and opens counts to 34712 with resistance at 34222 and 34334/34342. Closes over 34712 ultimately offers full counts back critical resistance at 34589. A drive over 34712 can test significant long-term resistance at 34879 and 34995.
Dow Jones Industrial Average Weekly HLC
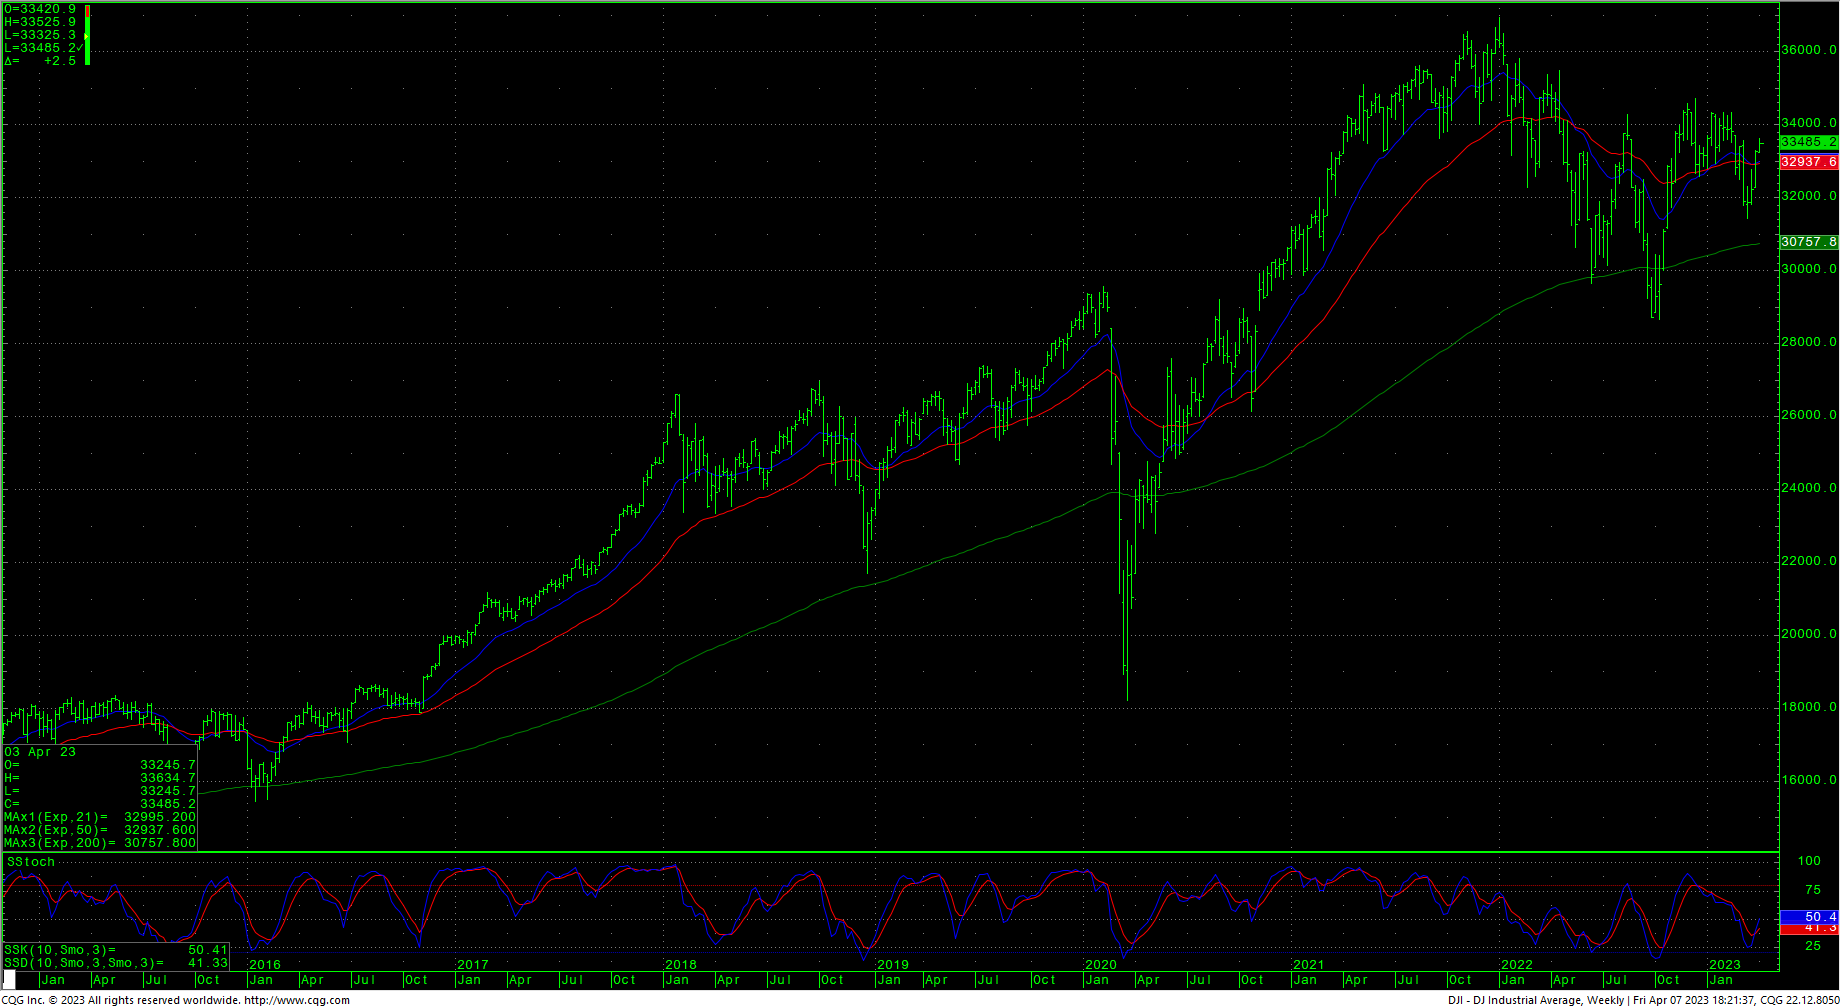
Support for the Dow is 33114 and 32792. A breakdown under 32792 can test 32532 with counts to critical short-term support of 32272/32260. Daily closes under 32260 setup a retest of intermediate support in the 31727/31686 level. A breakdown with closes under 31686 will open counts into the 30972/30960 level with support of 31429/31423 and 31160. There is a gap on the daily chart that runs from 31160 to 31119.
Resistance
- 33572 **
- 33634 **
- 33699 *** ↑
- 33790 **
- 33891/33937 *** ↑
- 34041 **
- 34130 **
- 34222 *** ↑
- 34334/34342 *** ↑
- 34395 **
- 34495 **
- 34595 **
- 34712 *** ↑
- 34879 ***
- 34995 *** ↑
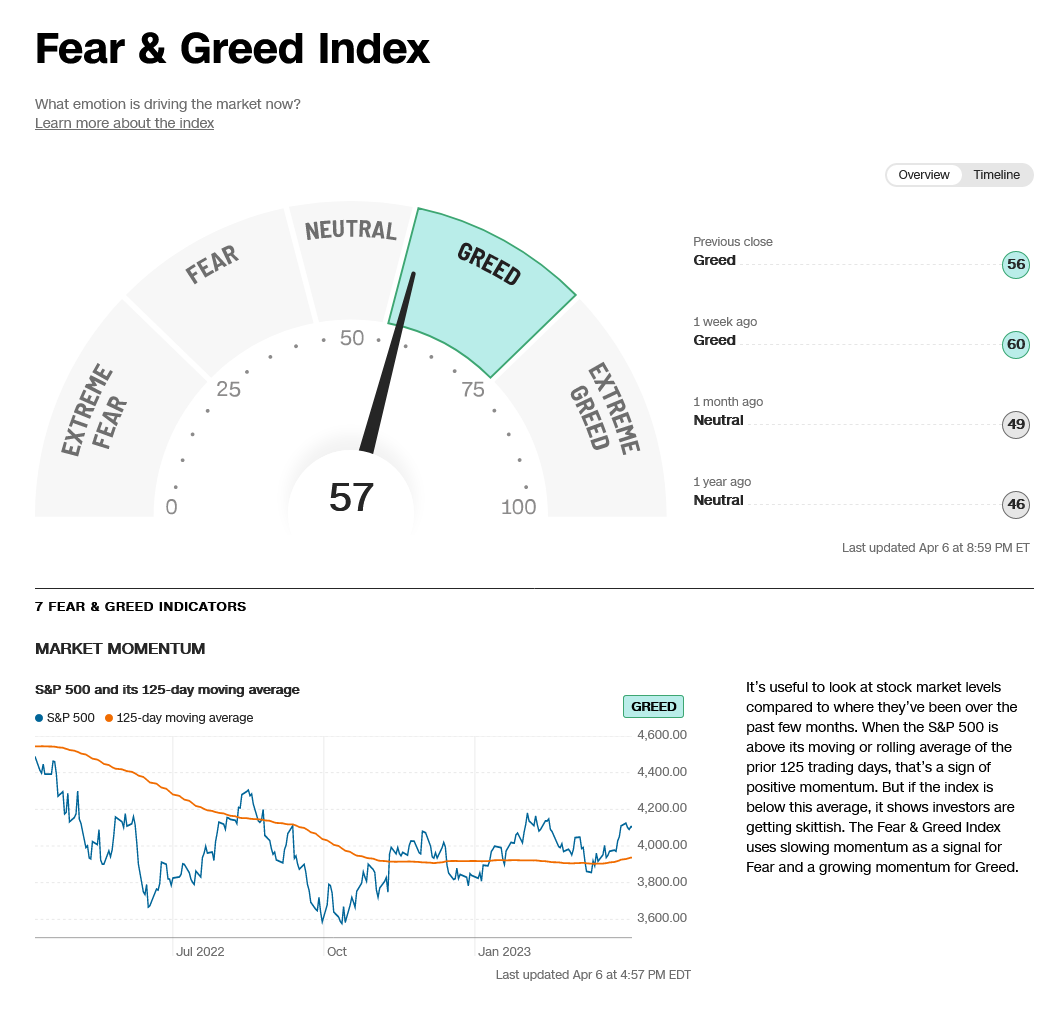
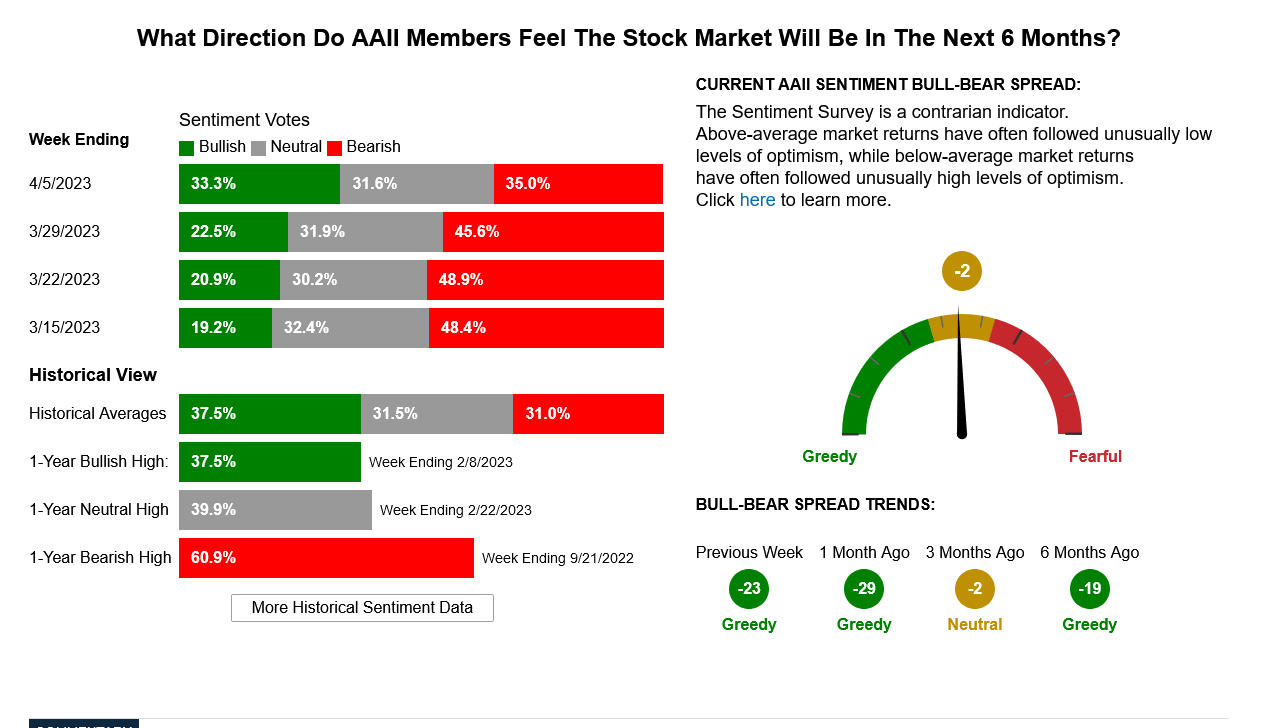
CNN Fear & Greed Index
AAII Investor Sentiment Survey
Support
- 33283 **
- 33200 **
- 33114 *** ↓
- 33074 **
- 32950 **
- 32850 *** ↓
- 32792 *** ↓
- 32660 **
- 32532 *** ↓
- 32465 **
- 32360 *** ↓
- 32272/32260 *** ↓
- 32149 **
- 32040 **
- 31950 **
- 31809 ***
- 31727 *** ↓
- 31686 *** ↓
- 31575 **
- 31429/31423 *** ↓
S&P 500 Cash Index
The S&P closed higher Thursday as the hourly flags to the side of the recent upmove. Resistance remains at 4128 and key at 4155. Daily closes over 4155 should test the overhead gap area at 4203 to 4218 and longer-term counts to critical resistance of 4311/4315. Daily closes over 4315 open counts to 4385 with full potential to long-term critical resistance of 4486/4505. Closes over 4505 can carry to 4593 with full potential toward 4637. A breakout above 4637 opens potential toward 4748 and ultimately 4818.
S&P 500 Index Weekly HLC
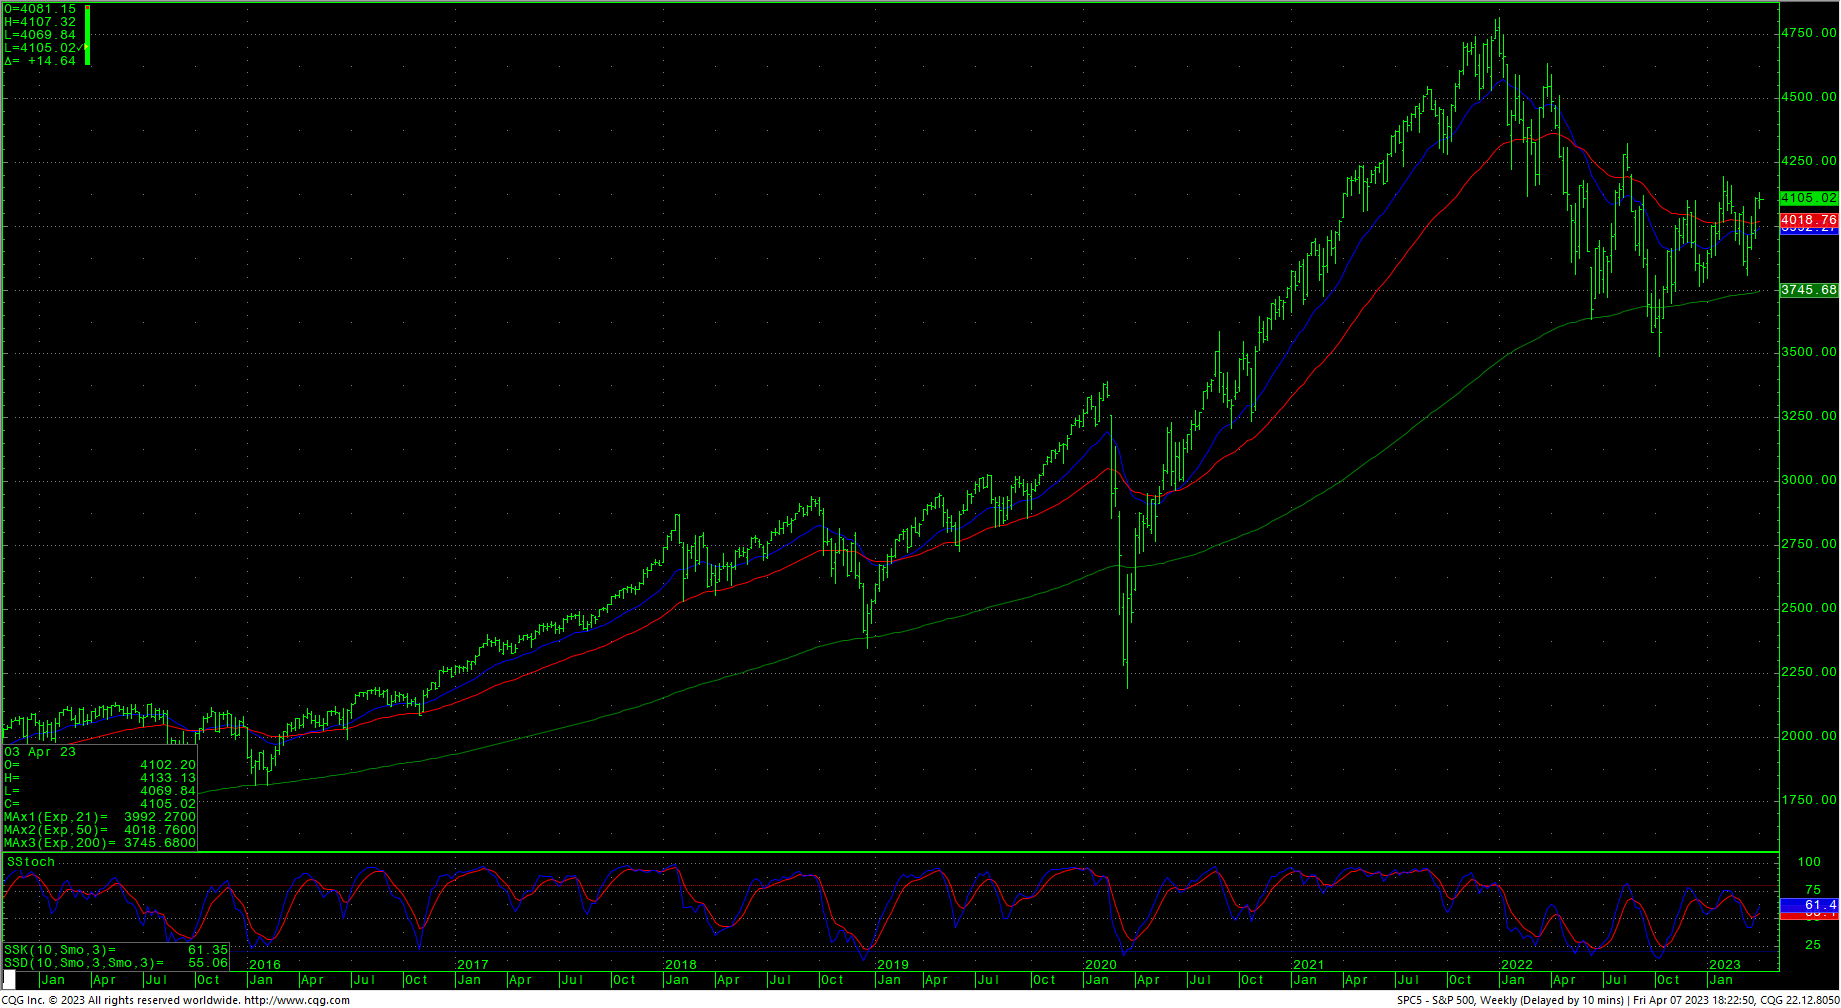
Support is 4080 and 4047/4045. A breakdown under 4045 should test 4021 with counts to 3984/3990. Closes under the 3990 level should carry to pivotal near-term support of 3932/3928. Closes under 3928 setup a retest of 3868/3865. A breakdown under 3865 can test 3808 through 3797. A breakdown with closes under 3799/3797 opens counts to critical support against the 3760/3750 level. Under 3750 sets up a move to 3657 and full potential back to critical long-term support of 3505/3491.
Resistance
- 4128/4133 ** ↑
- 4155 *** ↑
- 4203/4218 ***
- 4311/4315 *** ↑
- 4350 **
- 4385 *** ↑
- 4430 **
- 4486 *** ↑
- 4505 *** ↑
- 4593 **
- 4637 *** ↑
Support
- 4080 **
- 4047/4045 *** ↓
- 4021 ***
- 3984/3990 ***↓
- 3951 **
- 3868/3865 *** ↓
- 3845 **
- 3808 *** ↓
- 3799/3797 *** ↓
- 3760/3750 *** ↓
- 3667/3657 *** ↓
- 3584 **
- 3505/3491 *** ↓