TECHNICAL ANALYSIS
NOTE: THERE WILL BE NO UPDATE NEXT WEEKEND 07/14/23
Major Indices Week of July 07, 2023
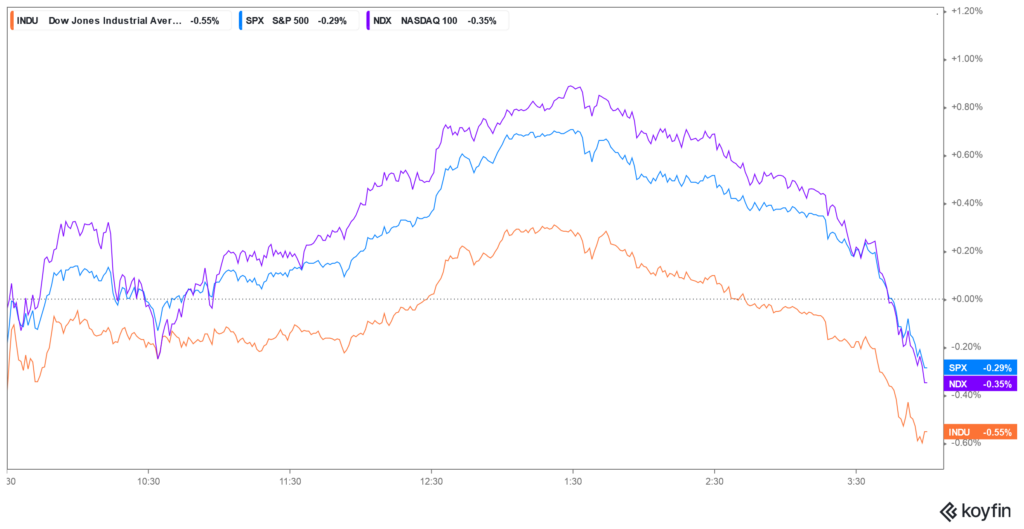
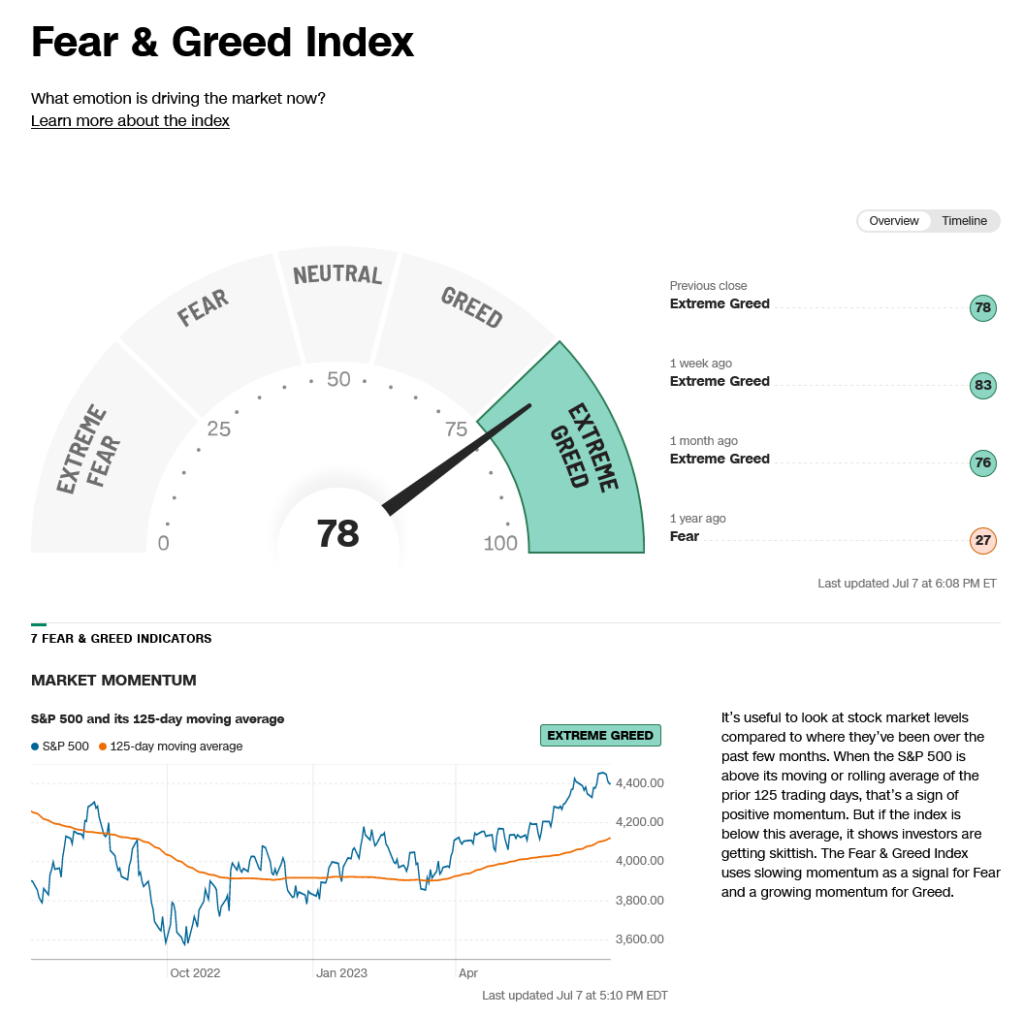
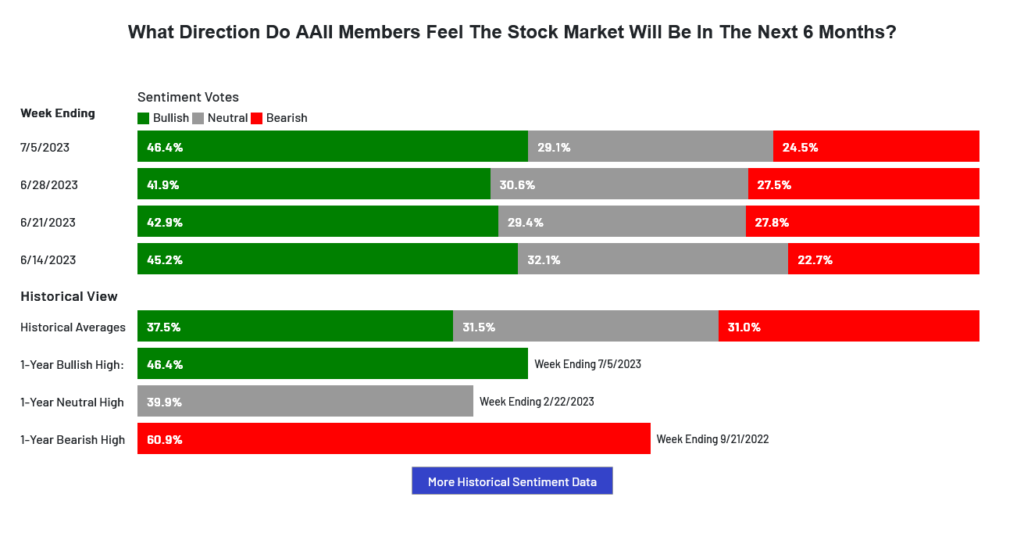
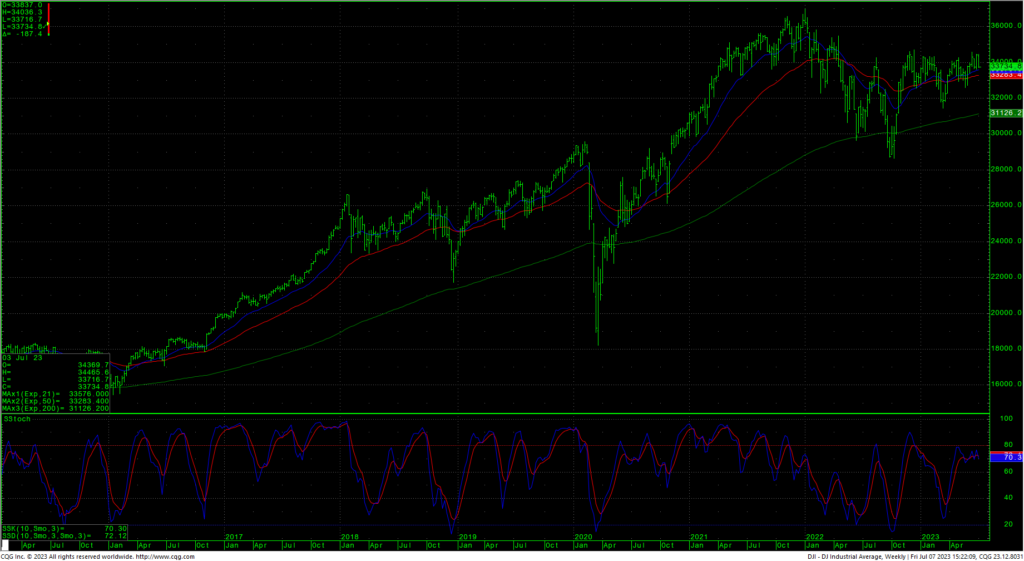
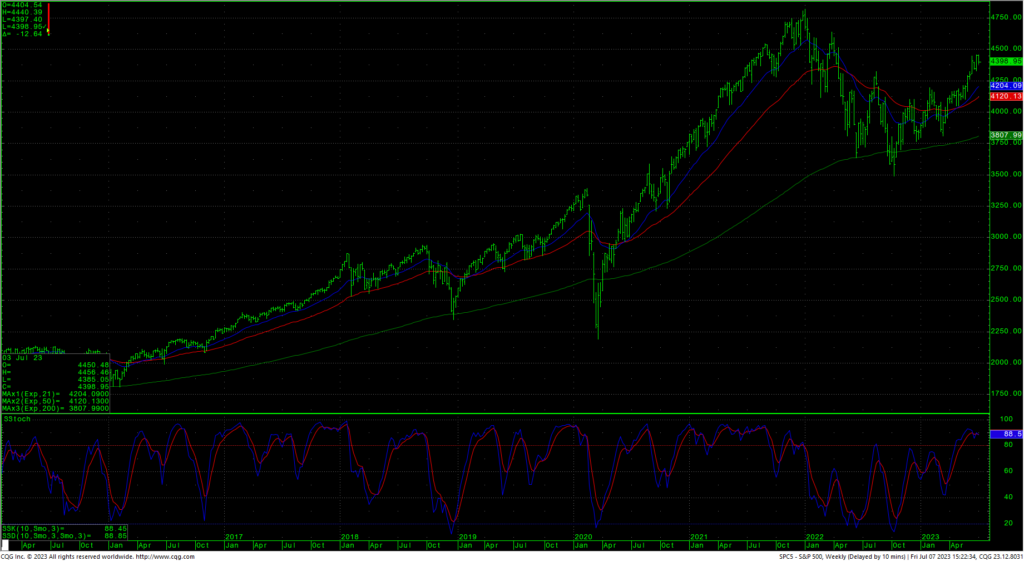
Stocks traded an inside week (Dow) and closed on the bottom of the range. The daily Dow chart hooked down with the action as prices left yet another island reversal on the daily chart as the Dow now has two islands in three weeks. It is possible that, intermediate term, the Dow is mapping out more of a shoulder in a larger inverted H&S pattern. Two significant long-term issues for the Dow: 1. The 34500 level is a massive overhead barrier, and 2. Sentiment has shifted radically to the greed side in just five weeks, after showing most people fighting the uptrend. The S&P also left an island mid-week, but Friday’s midday rally filled in the overhead gap before prices collapsed again to close on the lows. That daily chart has also hooked down and the hourly has hooked lower with the break on Friday. The S&P weekly remains overbought and the Dow weekly is still in a schizophrenic pattern on the oscillators. Sentiment sits in a Greedy/Bullish posture and the CoT continues to show a shift between commercial traders and speculators. Institutional investors tempered their buying in the past week after finishing the second quarter window dressing. The VIX traded a little more reality-based as it jumped to five week highs during the week. The AAII scored the fifth bullish sentiment week in a row. The next timing point is Monday July 10th and is a minor date. The next CRITICAL timing point is July 20-21. The Dow closed the week down -1.96%, The S&P was down -1.56%. The Nasdaq ended the week down -0.92%, the FANG settled down -0.08% and the Russell was down -1.27%. The 52-week A/D ratio dropped fractionally to +2.57…still a frothy reading.
Timing Points
- 07/10 **
- 07/20-21 *** X Critical
CNN Fear & Greed Index
AAII Investor Sentiment Survey
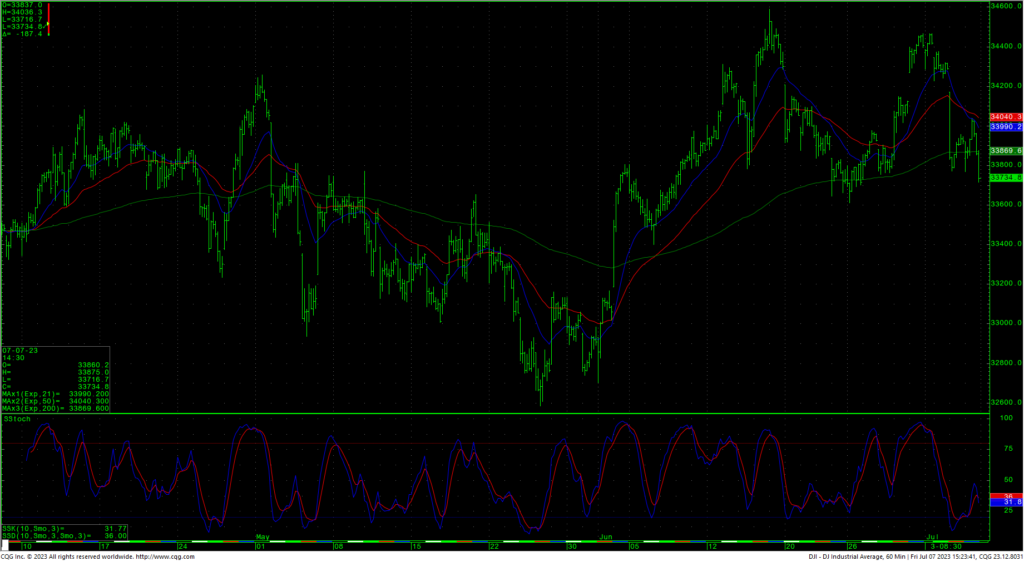
Dow Jones Industrial Average Hourly HLC
The Dow hourly is hooking lower again after bouncing midday Friday from oversold conditions. The stochastics are flashing a preliminary bullish divergence. Support for the Dow is at 33610 and 33588. Declines under 33588 have potential to pivotal short-term support of 33351/33340. Daily closes under 33340 open counts to 33009 with potential to critical near-term support of 32636/32620. Closes under 32620 will count to 32219/32175. A breakdown under 32175 sets up a test of intermediate support in the 31727/31686 level. A breakdown with closes under 31686 will open counts into the 30972/30960 level with support of 31429/31423 and 31160. There is a gap on the daily chart that runs from 31160 to 31119.
Resistance is 33984, 34099 and 34214/34226 (gap area). Closes back over 34226 are friendly and set up 34418. Daily closes over 34418 set up a move toward the late 2022 trading highs at 34712 with trading resistance at 34589. A drive with closes over 34712 can test significant long-term resistance at 34879 and 34995 and offers full counts back critical resistance at 35492. Closes over 35492 will open counts to 35824 with longer-term counts into a gap area on the daily at 35996 to 36044. A reminder that holding the breakout of the inverted H&S pattern counts toward long-term targets at 37095.
Dow Jones Industrial Average Weekly HLC
Support
- 33610 *** ↓
- 33588 *** ↓
- 33381 **
- 33251/33340 *** ↓
- 33261 **
- 33195 **
- 330009/33000 *** ↓
- 32843 ***
- 32636/33620 ***
- 32500 **
- 32396 **
- 32319/32175 *** ↓
- 31950 **
- 31828/31805 *** ↓
- 31624 ***
- 31530 **
- 31429/31423 *** ↓
Resistance
- 33984 **
- 34036 **
- 34099 ***
- 34171 **
- 34214/34226 ***↑
- 34418 *** ↑
- 34467 ** ↑
- 34495 **
- 34589 *** ↑
- 34712 *** ↑
- 34879 ***
- 34995 *** ↑
- 35112 **
- 35225 **
- 35372 ***
- 35492 *** ↑
- 35800/35824 *** ↑
- 35996 ***
- 36044 *** ↑
S&P 500 Cash Index
The S&P hourly is hooking lower after prices filled in the gap on the daily in intraday trade on Friday. Support is at 4393 and 4377/4375. A breakdown under 4375 sets up a test of 4360/4358 with counts to 4328 and possibly 4305. Daily closes under 4305 setup a move to 4230 and 4210. Closes under 4210 open counts to 4133 and pivotal short-term support of 4057/4053. Daily closes below 4053 open counts to 3975 with potential to critical near-term support at 3860/3855. A breakdown with closes under 3855 opens counts to support against the 3691/3680 level. Under 3680 sets up a move to 3657 and full potential back to critical long-term support of 3505/3491.
S&P 500 Index Weekly HLC
Resistance is at 4413, 4421 and 4430/4432 with last gasp resistance at 4440/4441. Closes over 4441 set up a test of long-term critical resistance of 4486/4505. Closes over 4505 can carry to 4593 with full potential toward 4637. A breakout above 4637 opens potential toward 4748 and ultimately 4818. Above the record highs opens counts to 4952/5000.
Resistance
- 4413 **
- 4421 ***
- 4430/4432 ***
- 4440/4441 *** ↑
- 4459 **
- 4486 *** ↑
- 4505 *** ↑
- 4593 **
- 4637 *** ↑
- 4665 **
- 4748 *** ↑
- 4818 *** ↑
- 4952 ***↑
- 5000 *** ↑
- 5072 **
- 5144 ***
Support
- 4393 **
- 4377/4375 *** ↓
- 4358 ***
- 4328 *** ↓
- 4305 *** ↓
- 4230 **
- 4210 *** ↓
- 4133 *** ↓
- 4057/4053 *** ↓
- 3975 *** ↓
- 3860/3854 *** ↓
- 3765 **
- 3691/3680 *** ↓
- 3657 *** ↓
- 3503/3491 *** ↓
Gold Futures
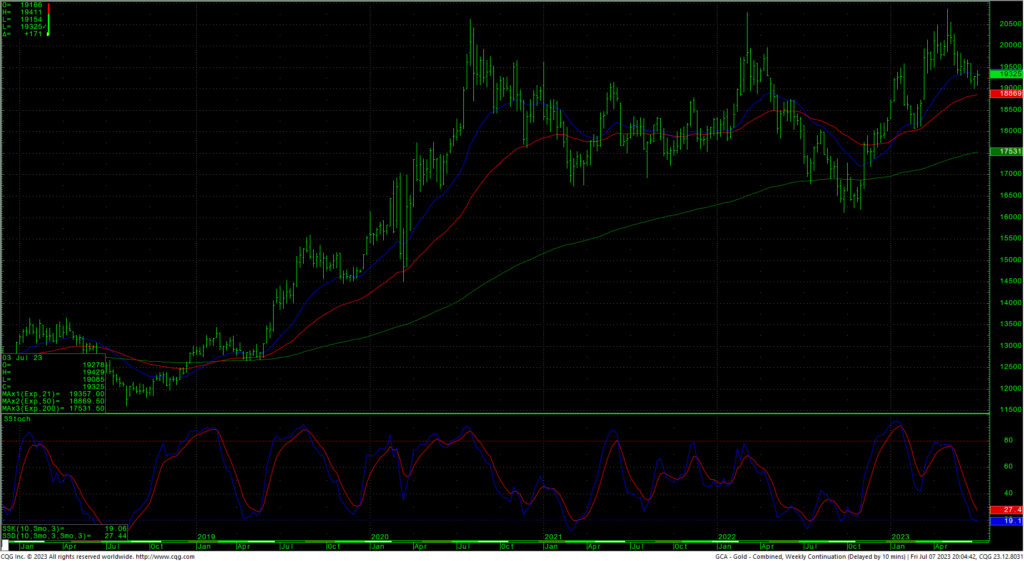
Spot Gold Weekly H-L-C
Price and time have both been very unfavorable for gold and the long-term outlook. So far, even with the monthly showing an uptrend, there remains a triple-top on the long-term charts. Nearby spot prices violated a key area at 1947 and, so far, have held against critical 62% retracement support against the 1914/1910 level. Support for spot futures is critical at 1910/1900 and closes under that area are bearish and suggest a move to 1878/1874 with potential to 1849. Closes under 1849 set up a move to critical long-term support at 1794/1790. Resistance is at 1984/1985 basis the DEC (GCZ). Rallies over 1985 set up a move to 2012. Closes in DEC over the 2012 area count to 2035 with potential toward pivotal resistance of 2057/2060. Closes in DEC gold over the 2060 level suggest a move to 2082 with full counts toward the contract highs at 2129.70.


