
TECHNICAL ANALYSIS
Major Indices Week of July 21, 2023
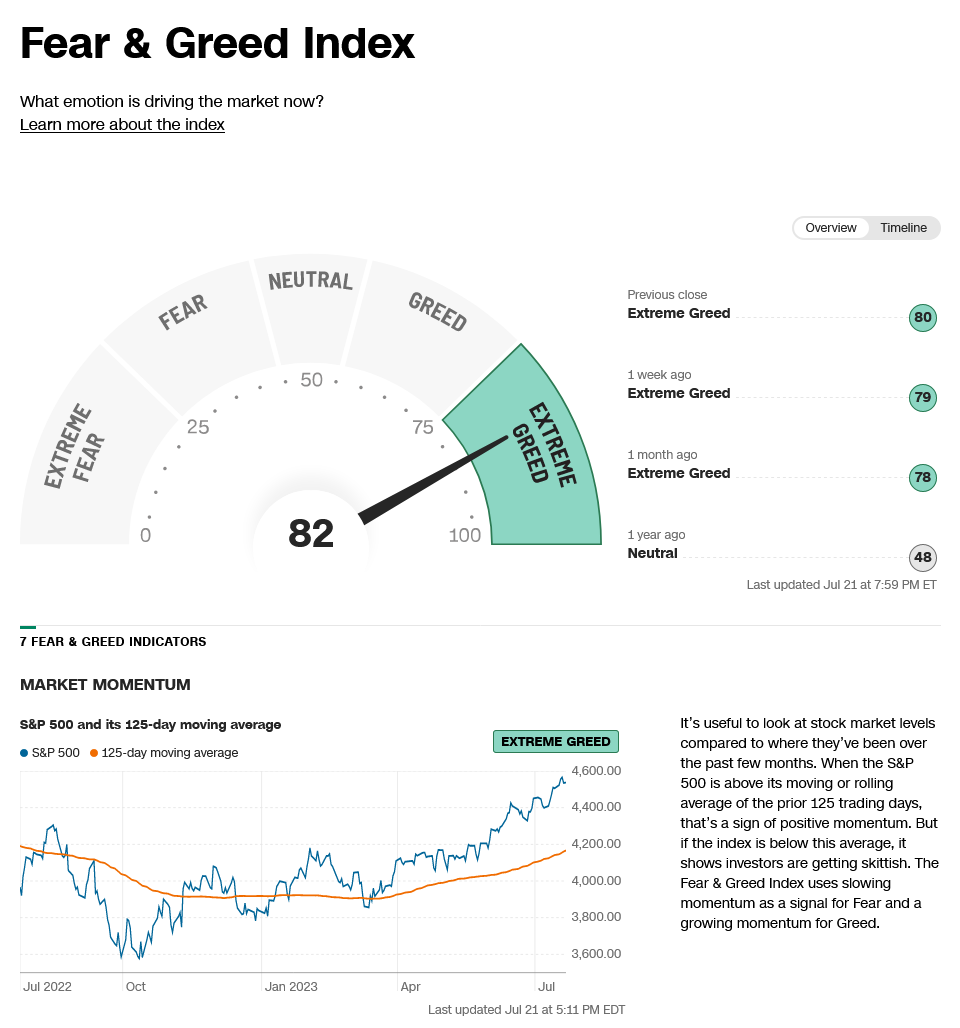
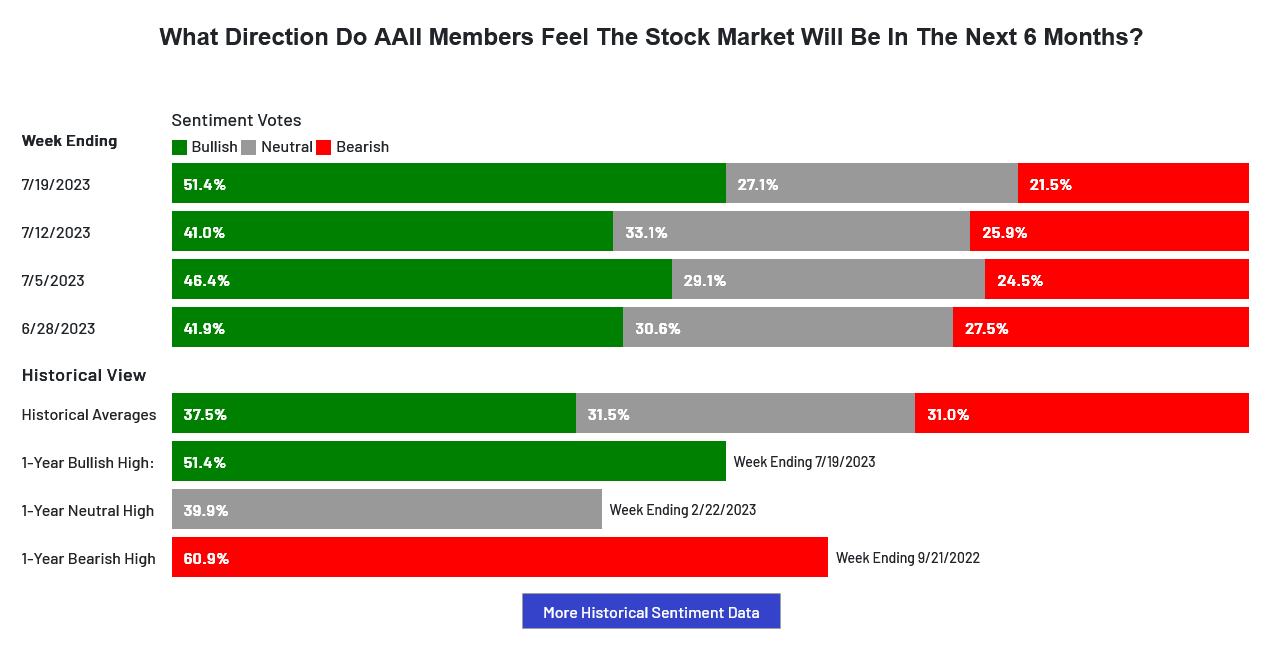
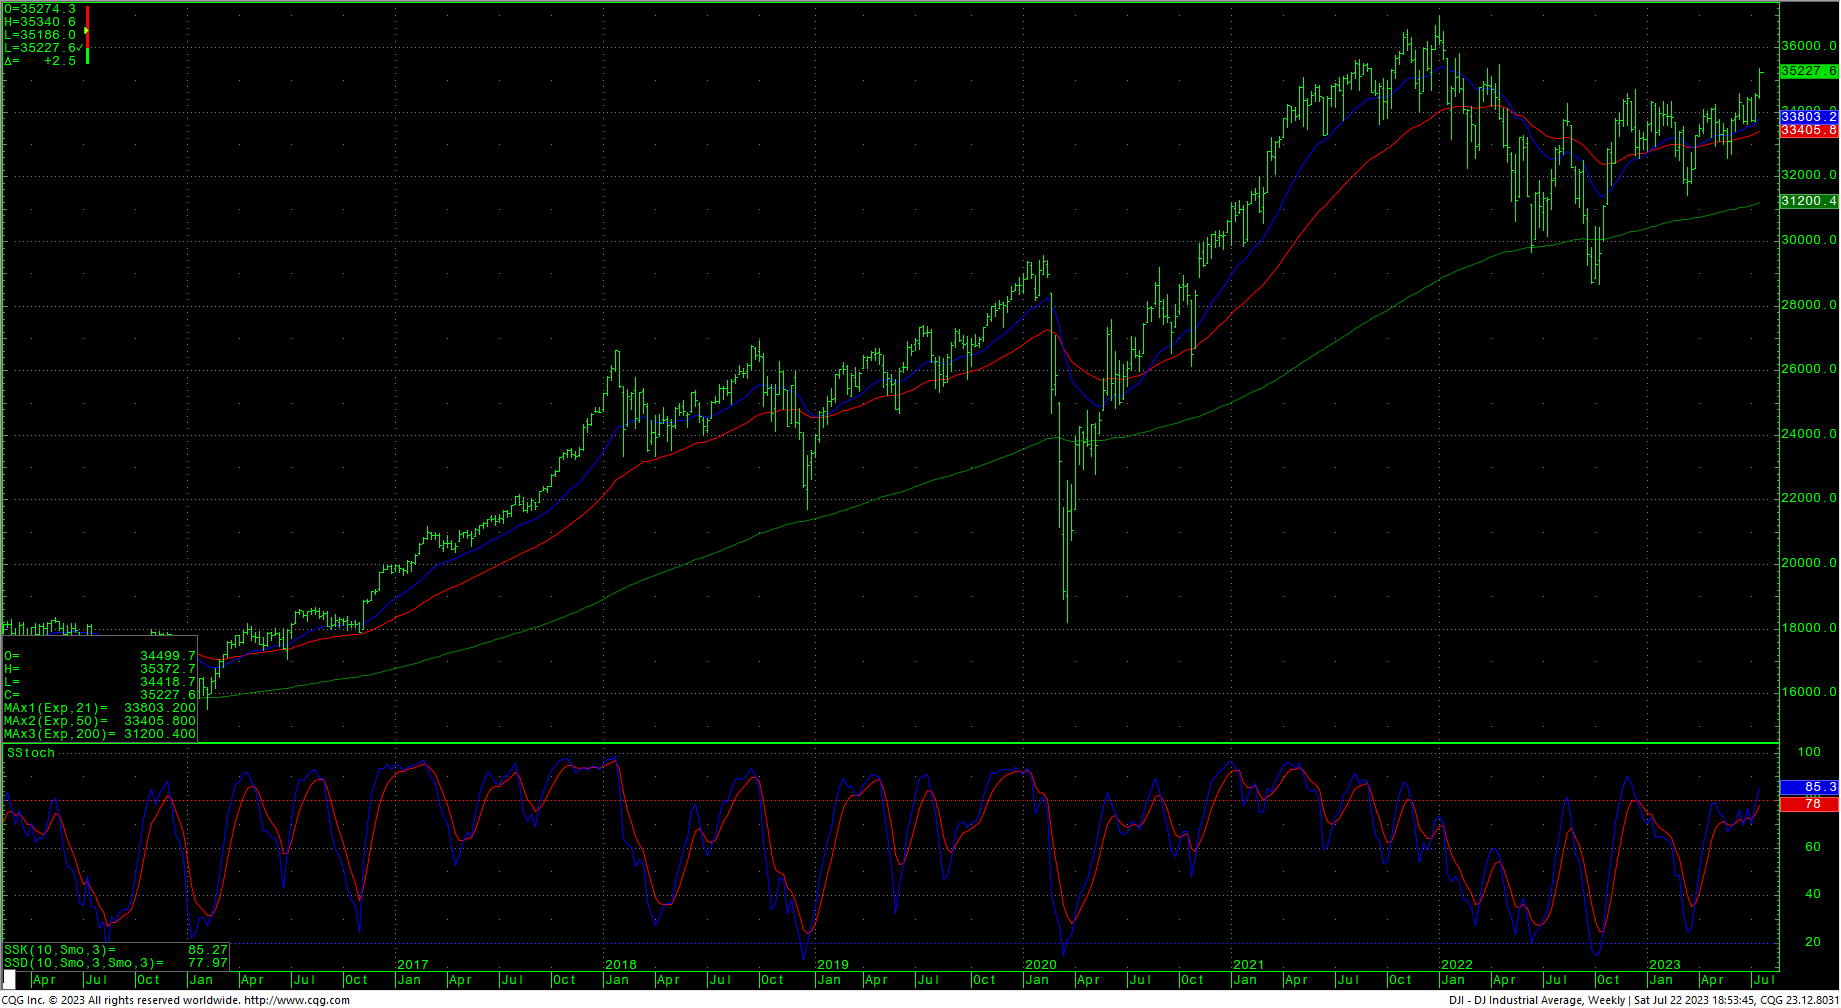
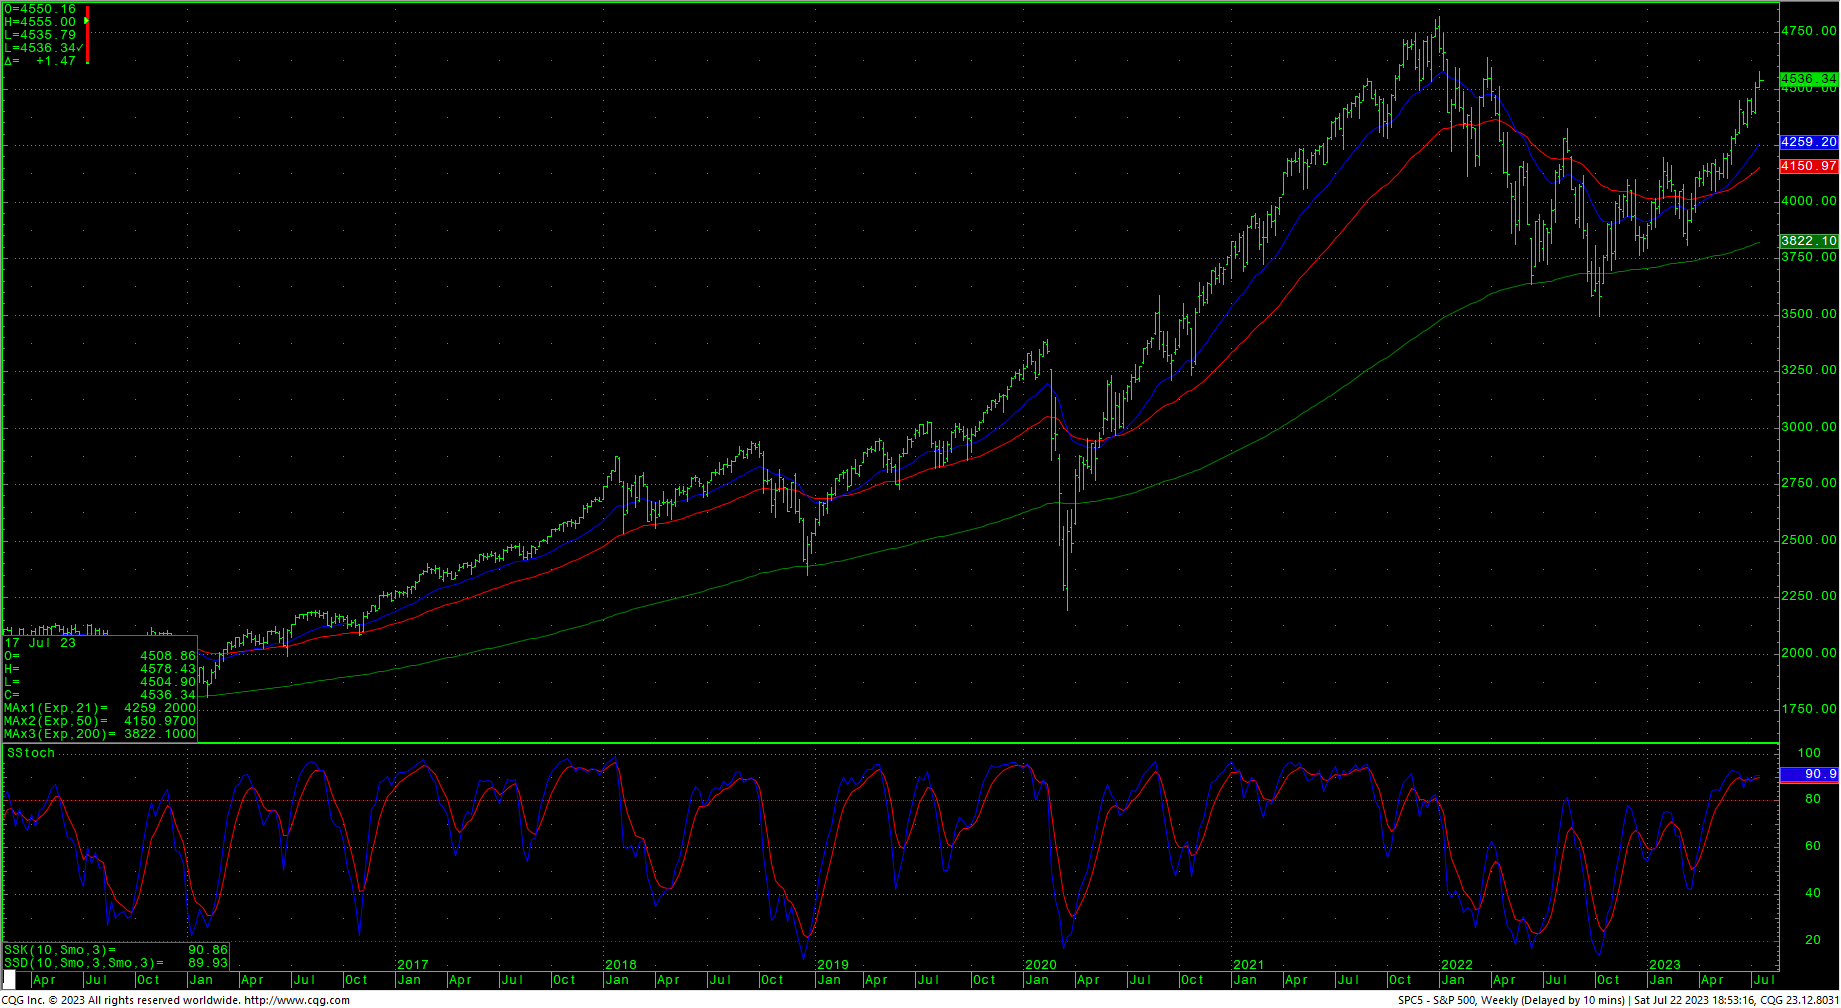
 The Dow raced to the highest levels since April of 2022 and set the highest weekly close Since 10 January 2022. The weekly chart is in an uptrend and the breakout projects to higher levels. The Dow Industrials have now closed higher for the past ten sessions in a row. The S&P set a new high for the current drive and closed at the highest level since 28 March 2022, ending toward the lower half of a tight weekly range. Needlesstosay, all this upside action has pushed sentiment into frothy/greedy levels with the AAII Sentiment Index hitting a bullish reading for the seventh week in a row. The S&P daily is showing overbought conditions and there are now a series of breakaway and runaway gaps on that chart. The Dow daily is reaching into overbought territory and the Dow hourly chart is working off overbought conditions while the S&P is actually reacting from oversold short-term conditions. There remains the possibility that the Dow is on a breakout from a larger inverted H&S pattern. A reminder that holding this breakout of the H&S pattern counts to long-term targets of 37095 for the DJIA.
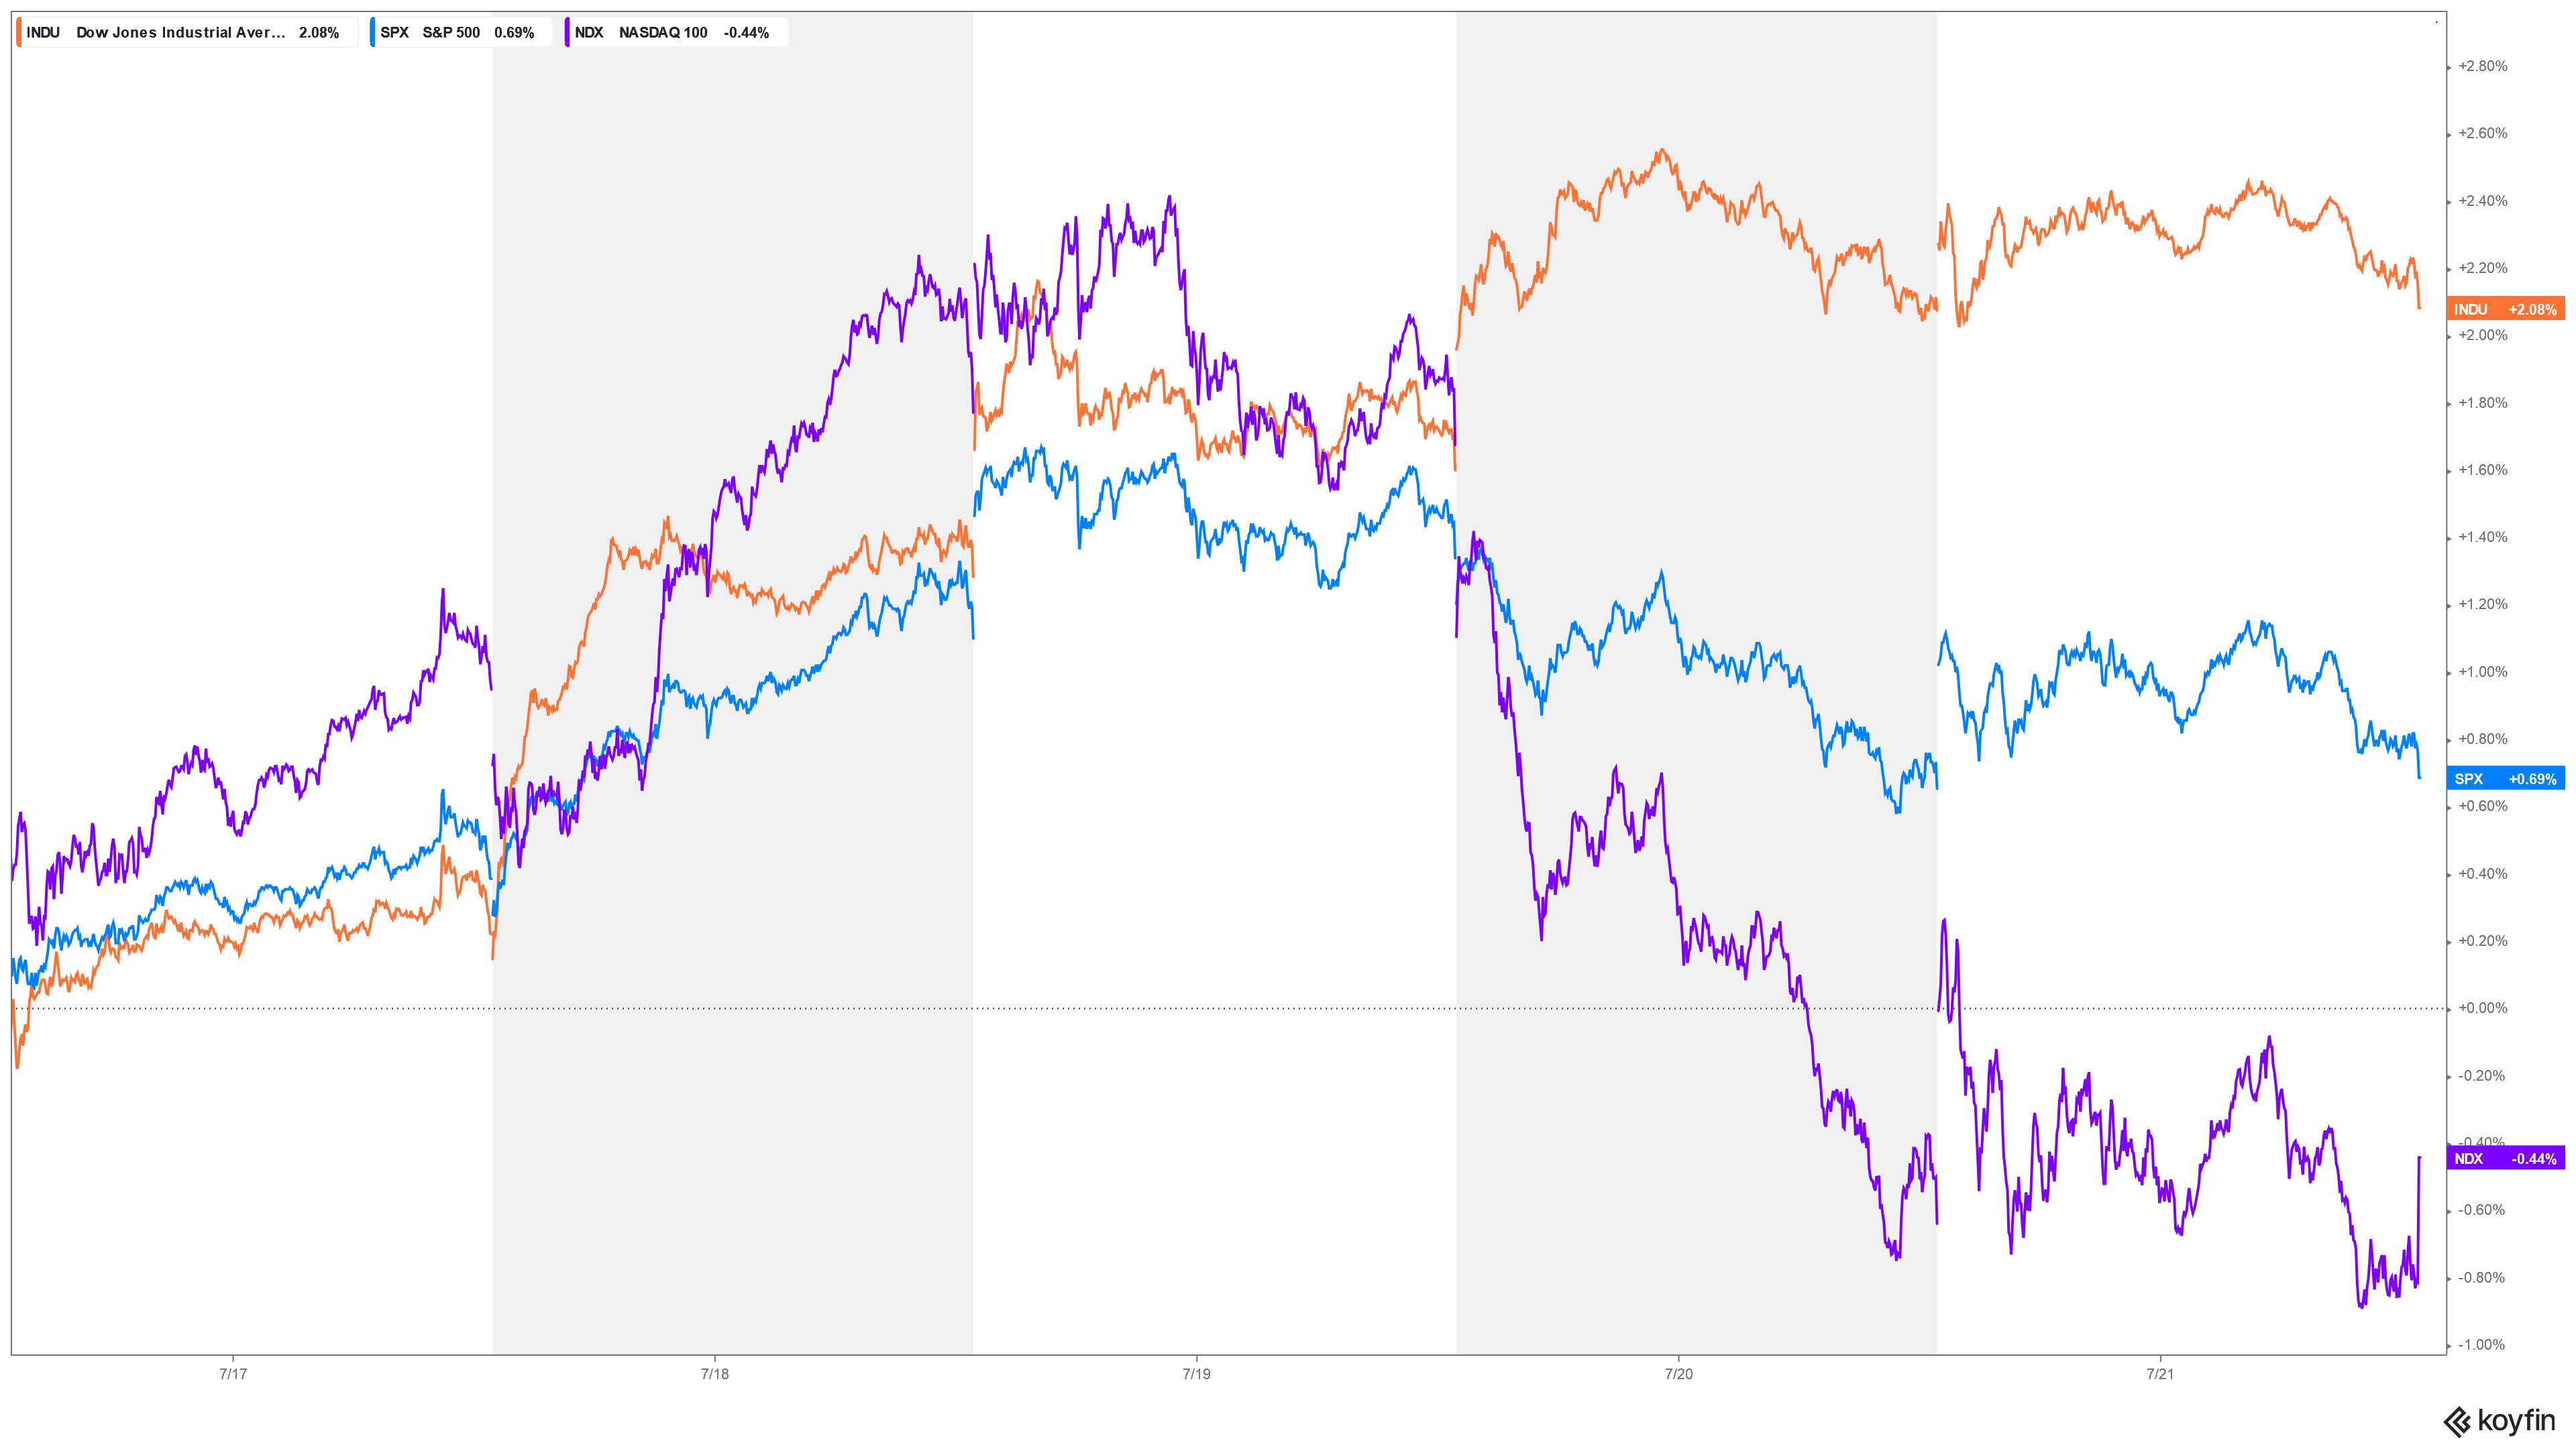
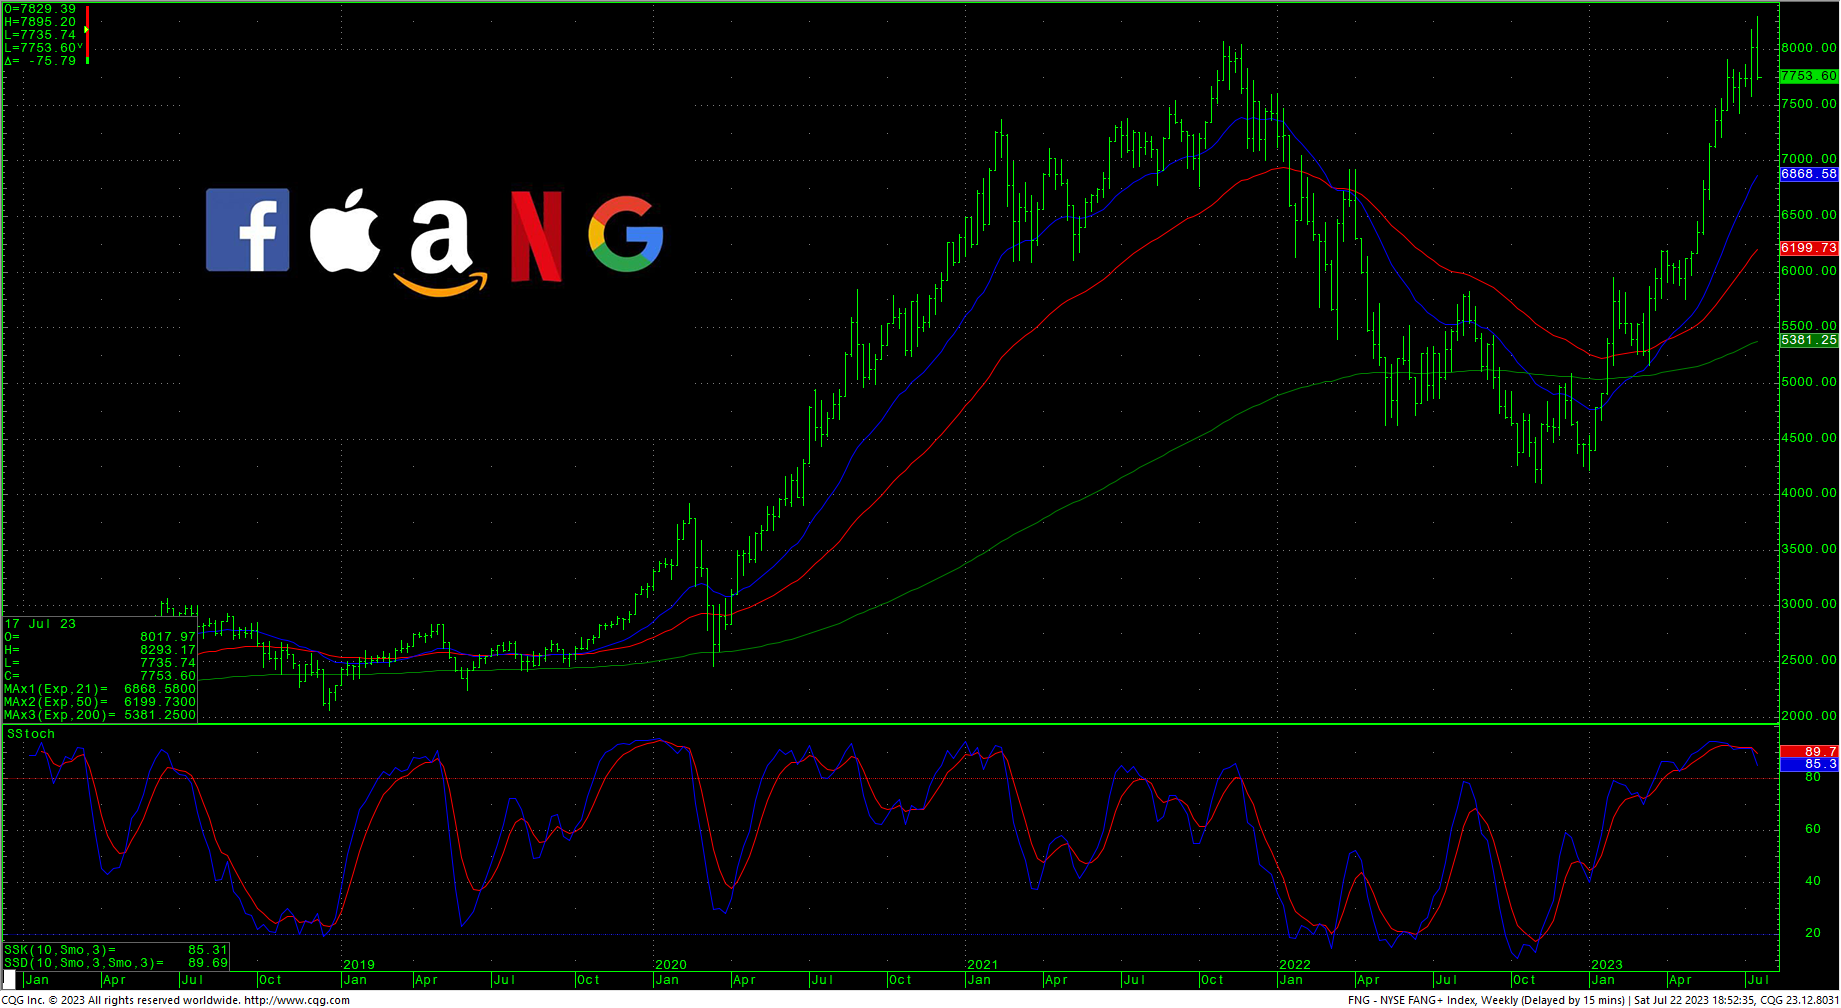
The FAANG staged a steep reversal lower in the CRITICAL timing of last Thursday/Friday after that index set new all-time record highs last week. That chart ended in a downside weekly reversal and the Nasdaq also stumbled in the critical timing and set a reversal lower. The Dow closed the week up +2.08%, The S&P was up +0.68%. The Nasdaq ended the week down -0.57%, the FANG settled down sharply -3.30% and the Russell was up +1.53%. The next timing point is Thursday the 27th. The next critical timing point is August 22/23. The Commitment of Traders CoT has flattened the recent trend of commercial liquidation and managed funds covering. Institutional investors have continued to pad positions on the rally. Hedge funds, which have been seriously out of step with the market this year, continue to have substantial cash sidelined as the Dow breaks into new highs.
Timing Points
- 07/27 **
- 08/04 **
- 08/09 **
- 08/15 ***
- 08-22/23 *** X Key
CNN Fear & Greed Index
AAII Investor Sentiment Survey
Dow Jones Industrial Average Hourly HLC
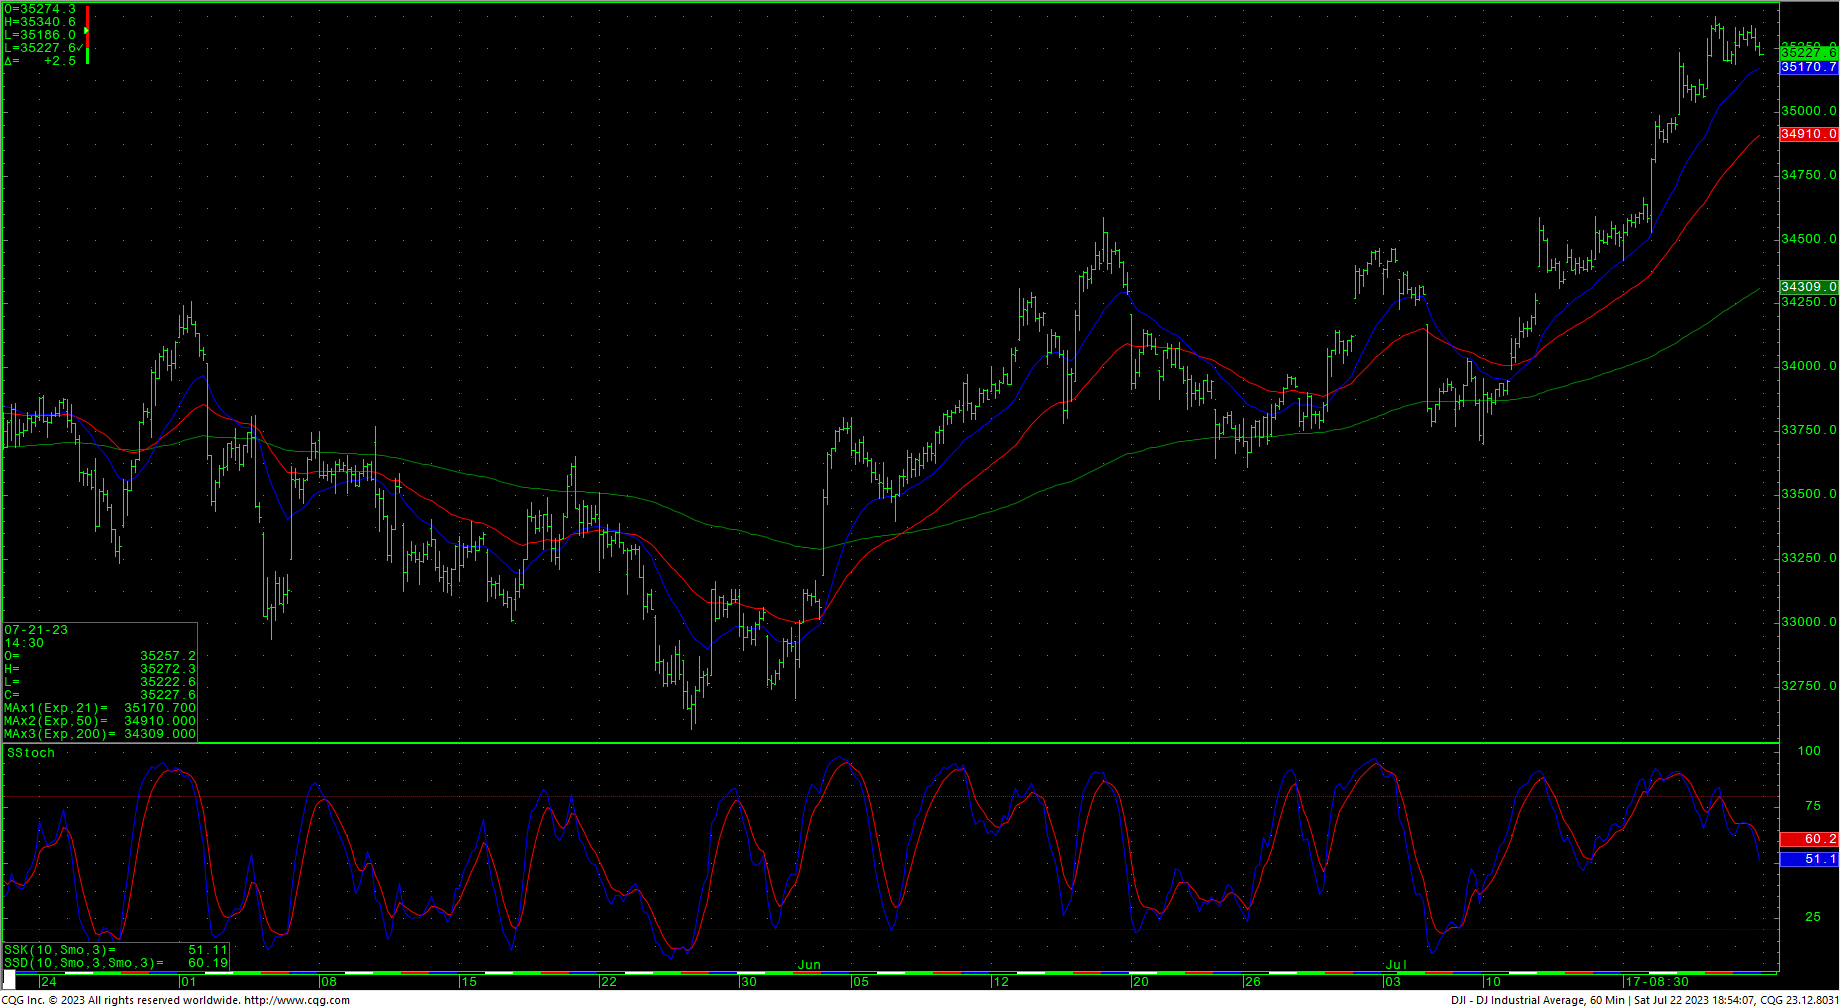 The Dow hourly is working off overbought conditions. The action is suggesting a move to test the highs of 21 April 2022 at 35492. Resistance is key overhead now at 35372 and 35492. Closes over 35492 will open counts to 35824 with longer-term counts into a gap area on the daily at 35996 to 36044. A breakout over 36044 sets up the 36513 area with potential to test the all-time record highs at 36952. A reminder that the inverted H&S pattern in the DJIA counts toward long-term targets at 37095.
Support for the Dow is at 34956 and short-term pivotal at 34715/34699. A breakdown with closes under 34699 opens counts to 34491 with potential to short-term critical support of 34308/34280. Daily closes under 34280 open counts to major short-term support in the 34026 through 33979. Closes under 33979 can test critical intermediate-term support of 33650/33640. Closes below 33640 suggest a move to 33283 to 33244.
Dow Jones Industrial Average Weekly HLC
Resistance
- 35372 ***
- 35492 *** ↑
- 35800/35824 *** ↑
- 35996 ***
- 36044 *** ↑
- 36271 **
- 36390 **
- 36513 ***↑
- 36636 **
- 36934/36952 *** ↑
- 37095/37096 *** ↑
Support
- 35186 **
- 34956 *** ↓
- 34715/34699 *** ↓
- 34491 ***
- 34308/34280 *** ↓
- 34026 **
- 33980/33979 *** ↓
- 33650/33640 *** ↓
- 33500 **
- 33283 **
- 33248/33244 *** ↓
S&P 500 Cash Index
The S&P hourly is flagging after working off oversold short-term conditions. The market has rallied toward a target at 4593 and is reacting to overbought conditions on the daily chart and strong cycle timing of late last week. Resistance is 4578 and 4593. A drive above 4593 should test 4637. A breakout with closes above 4637 opens potential toward 4748 and ultimately 4818. Above the record highs opens counts to 4952/5000 with potential to 5144.
S&P 500 Index Weekly HLC
 Support is 4519 and 4482/4480. A breakdown under 4480 sets up a test of 4453 with counts to pivotal near-term support 4423/4420. Daily closes under 4420 set up a move to 4165/4160. Closes under 4160 open counts to 4035 and critical short-term support of 3906/3900. Daily closes below 3900 open counts to 3748 with potential to support at 3503/3491.
Resistance
- 4578 **
- 4593 *** ↑
- 4637 *** ↑
- 4665 **
- 4748 *** ↑
- 4818 *** ↑
- 4952 ***↑
- 5000 *** ↑
- 5072 **
- 5144 *** ↑
Support
- 4519 **
- 4482/4480 *** ↓
- 4453 ***
- 4423/4420 *** ↓
- 4305 ***
- 4230 **
- 4165/4160 *** ↓
- 4035 *** ↓
- 3906/3900 *** ↓
- 3865 **
- 3750/3748 *** ↓

