
TECHNICAL ANALYSIS
Major Indices Week of August 18, 2023
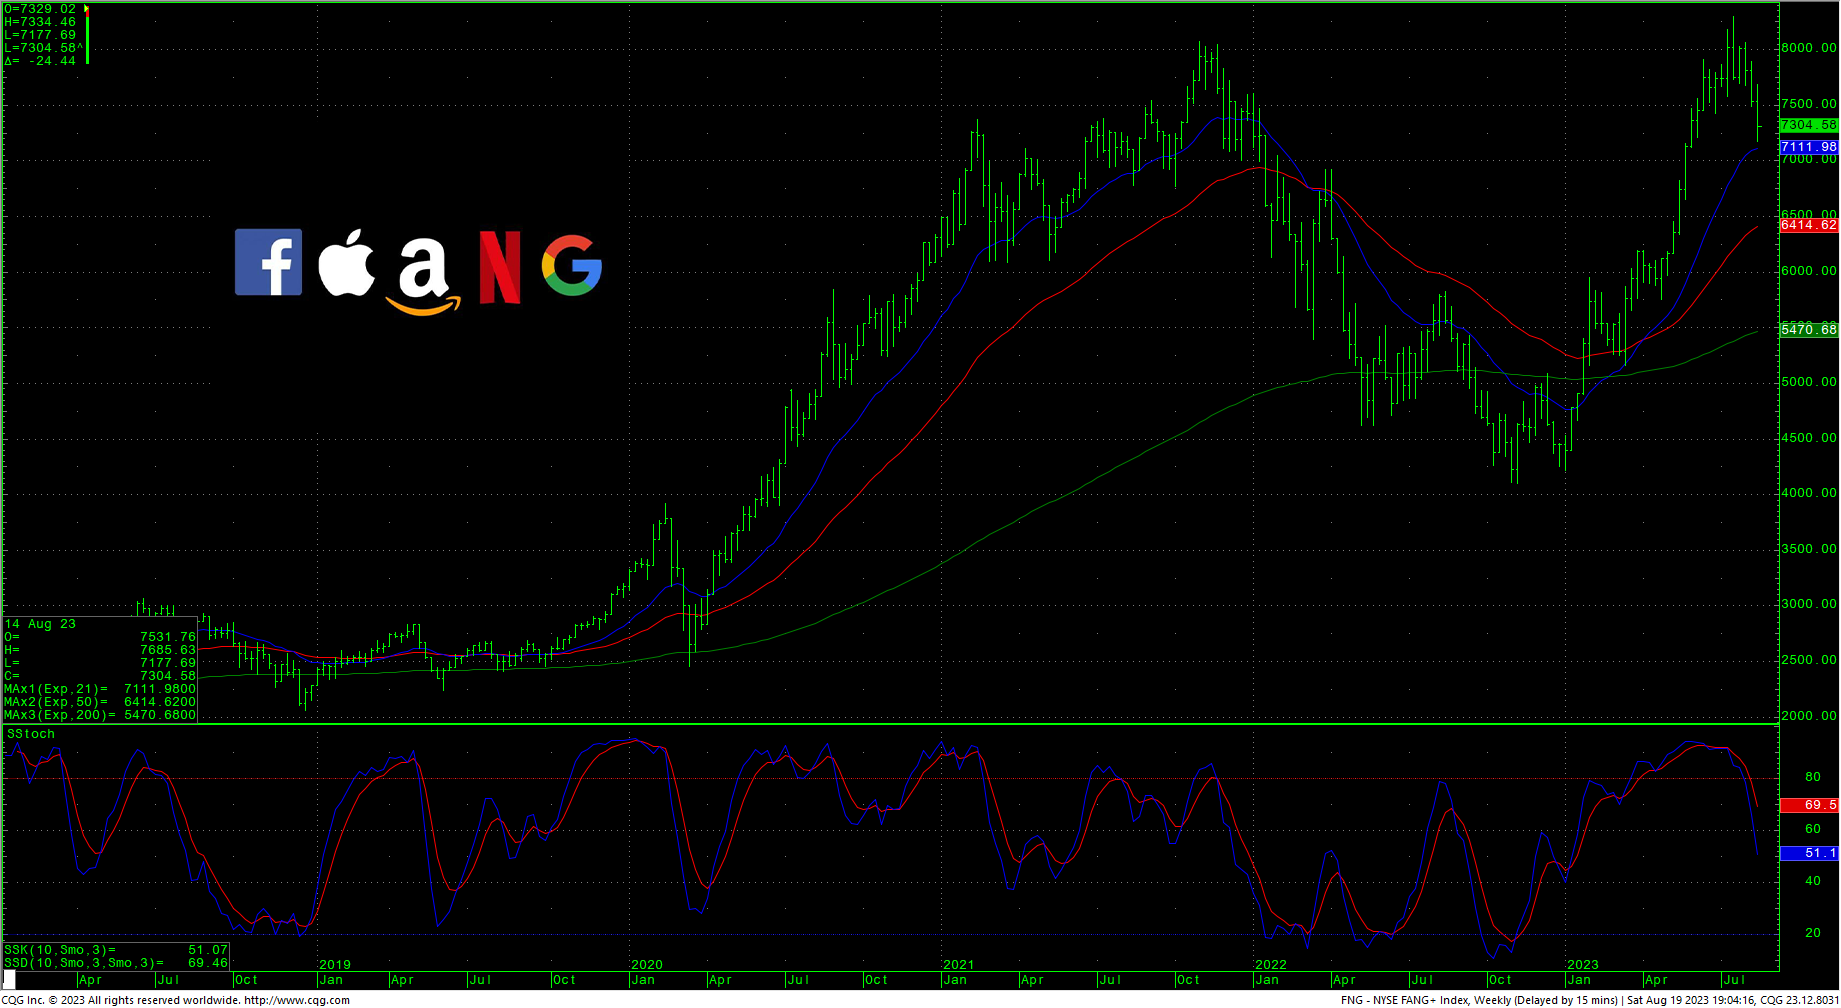
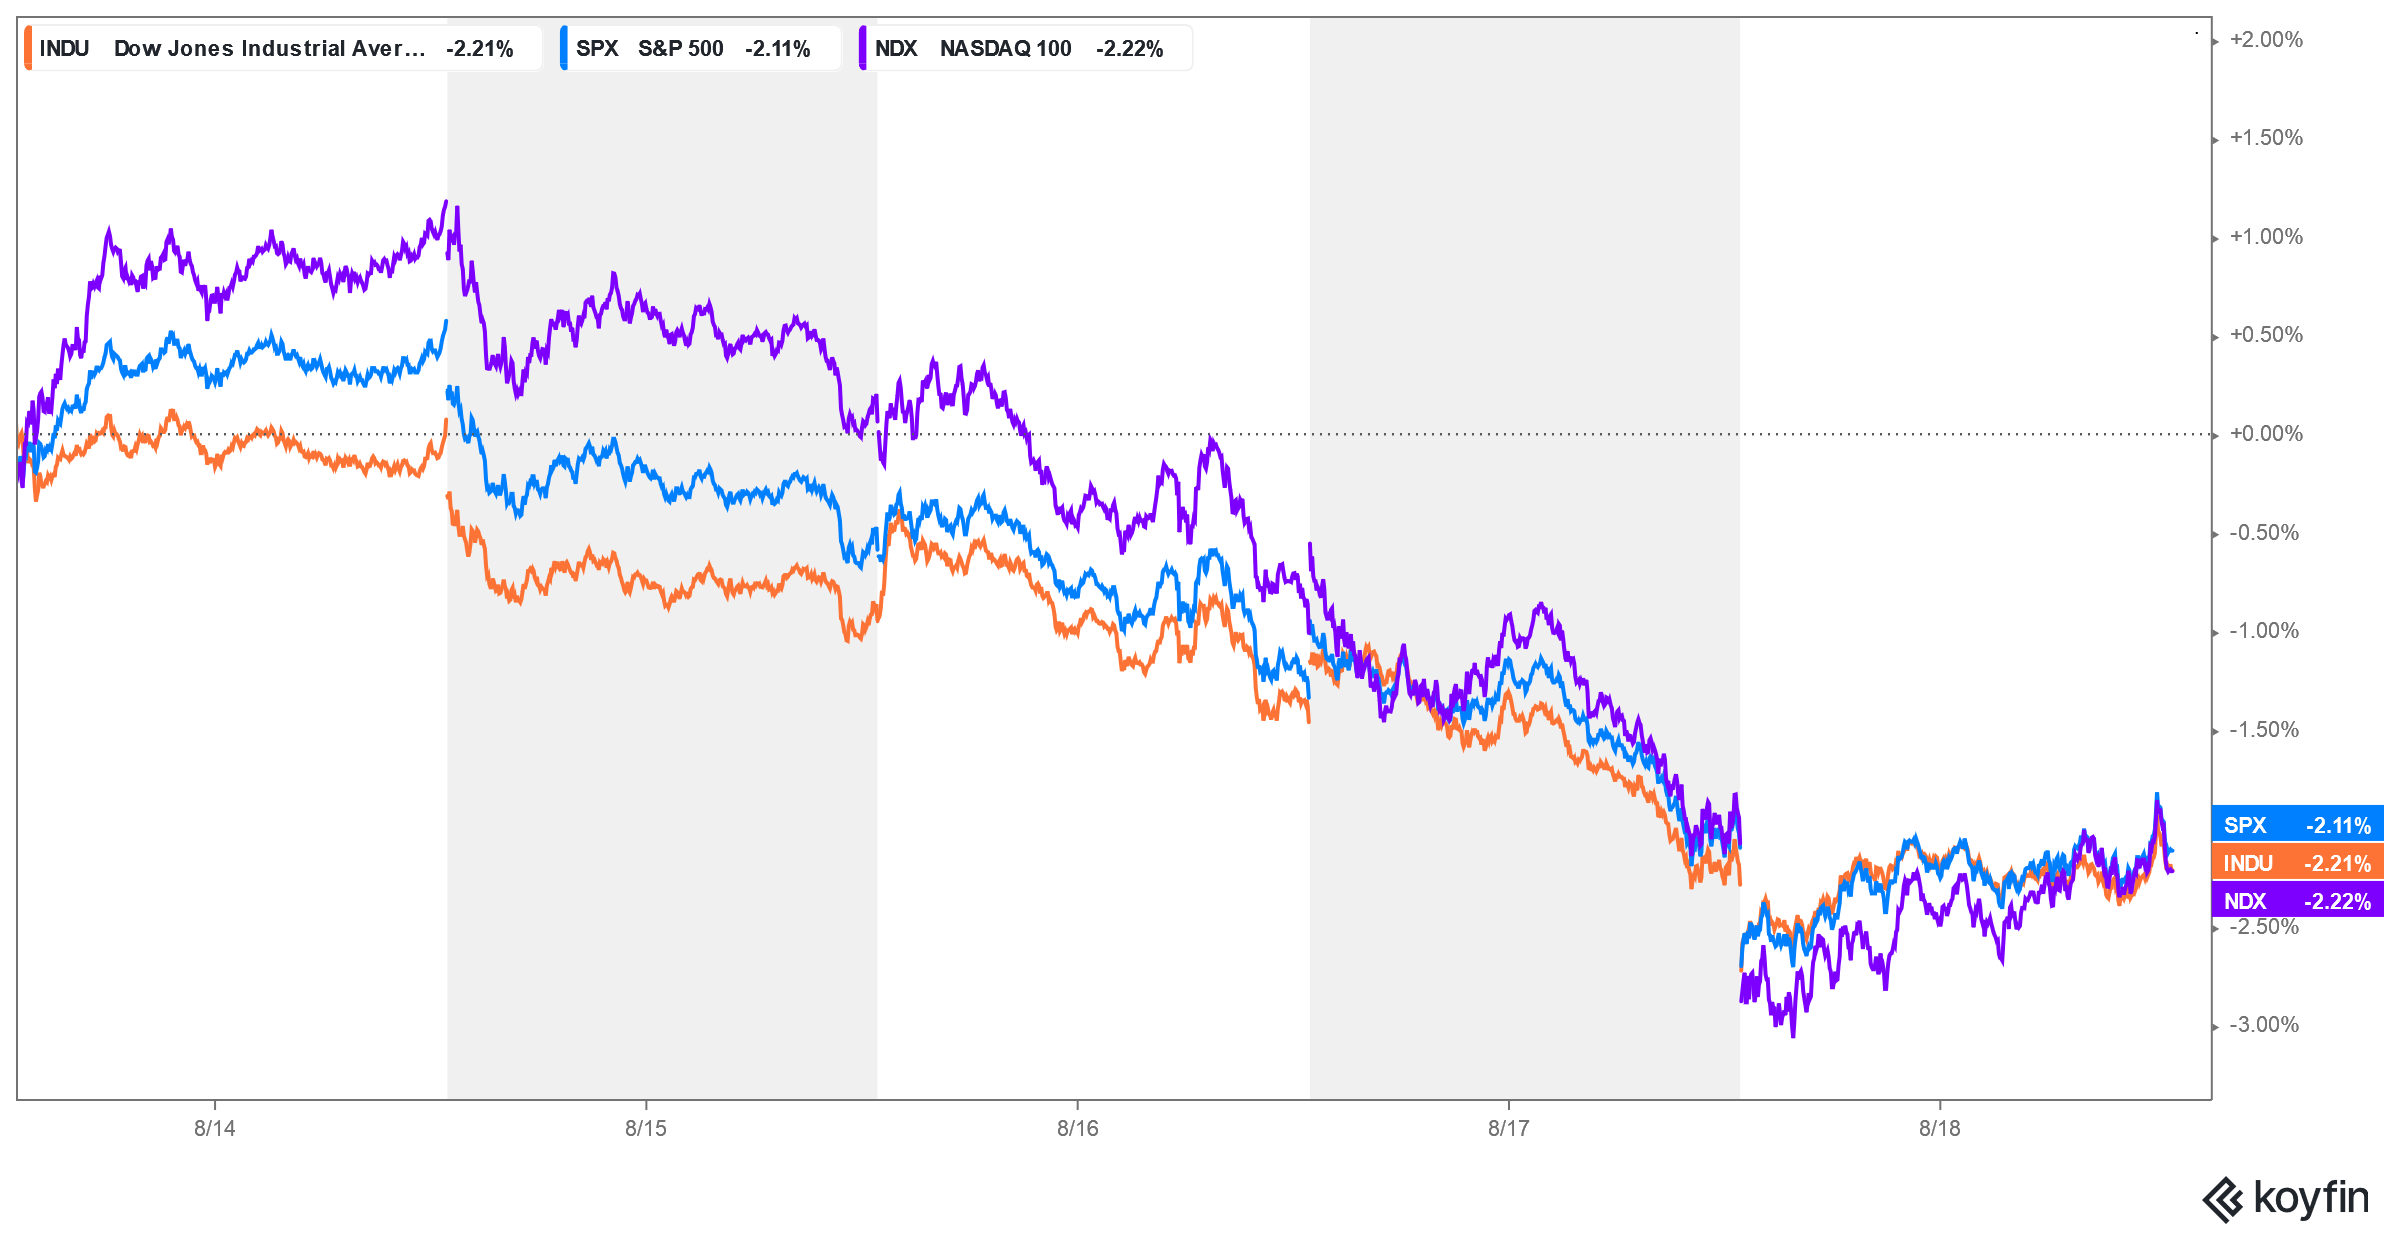 Stocks suffered their third straight week of losses and the month of August can basically be attributed to what can now be called The China Syndrome. All it took was the speculators capitulating their shorts and the “groupthink” on a US recession, to create a severe downdraft in stocks. All the major indices suffered sharp declines last week, carrying prices to two-month lows. Tech indices are still reacting to the CRITICAL timing of July 20/21 and there is strong timing both this week and next. Both the Dow and the S&P daily charts are into oversold territory now while the hourly charts try to bounce from deeply oversold conditions. Wednesday’s minor timing did not prove to be anything and the next critical timing point is this Tuesday/Wednesday and then next week at the end of the month.
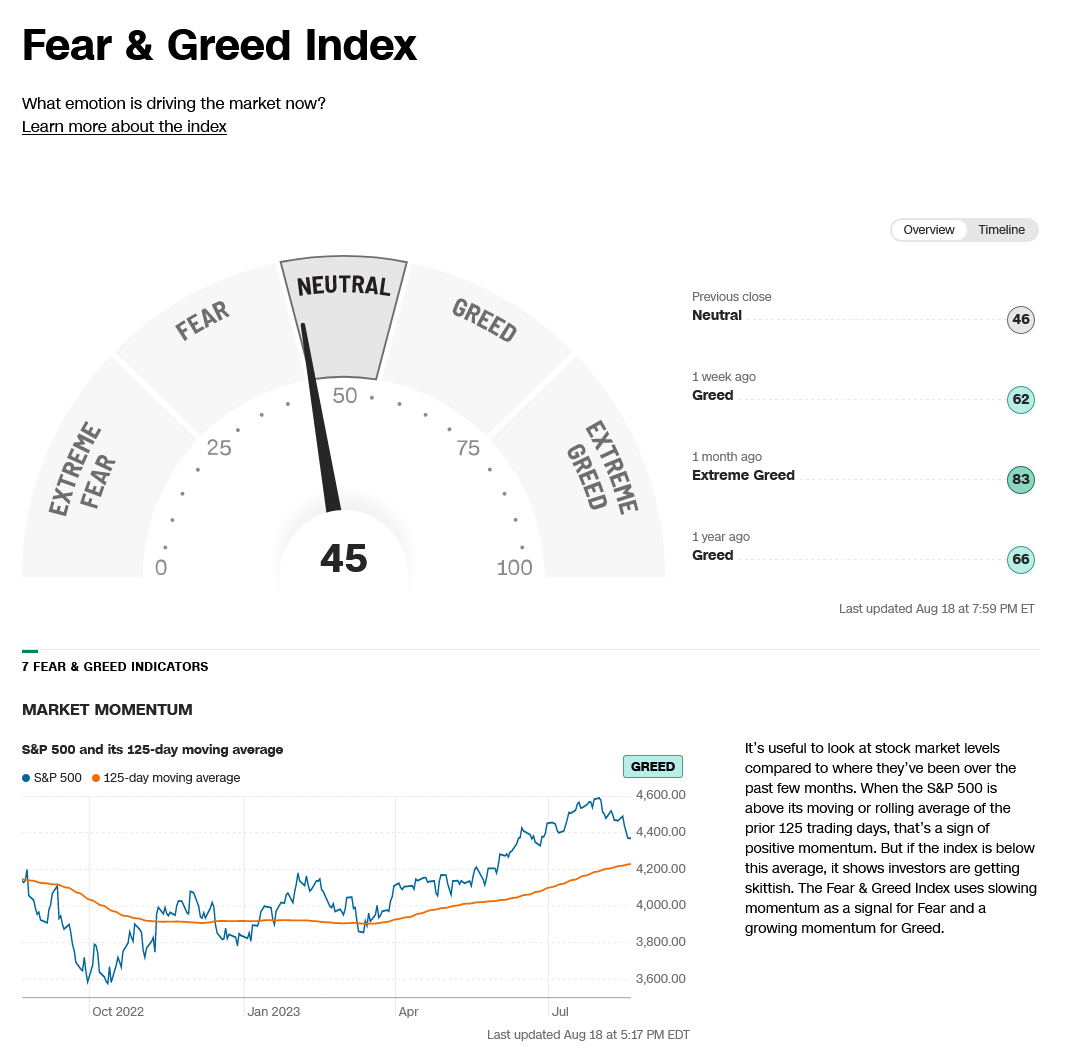
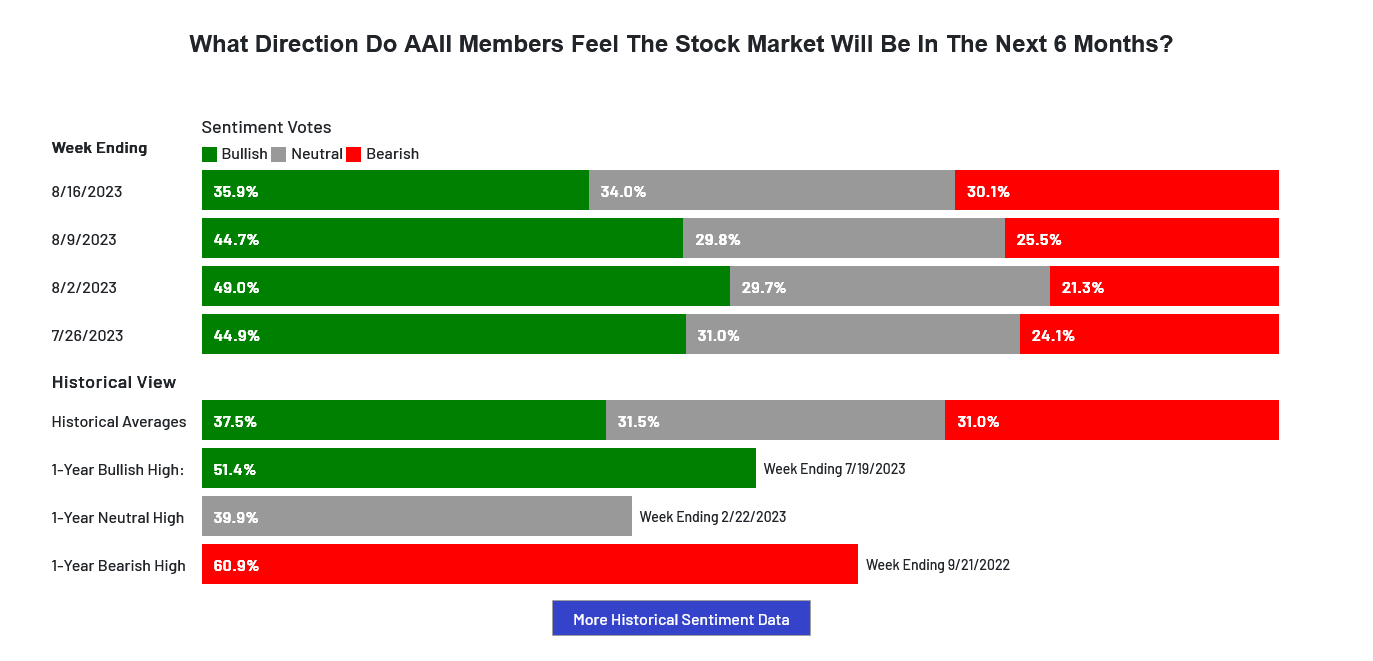
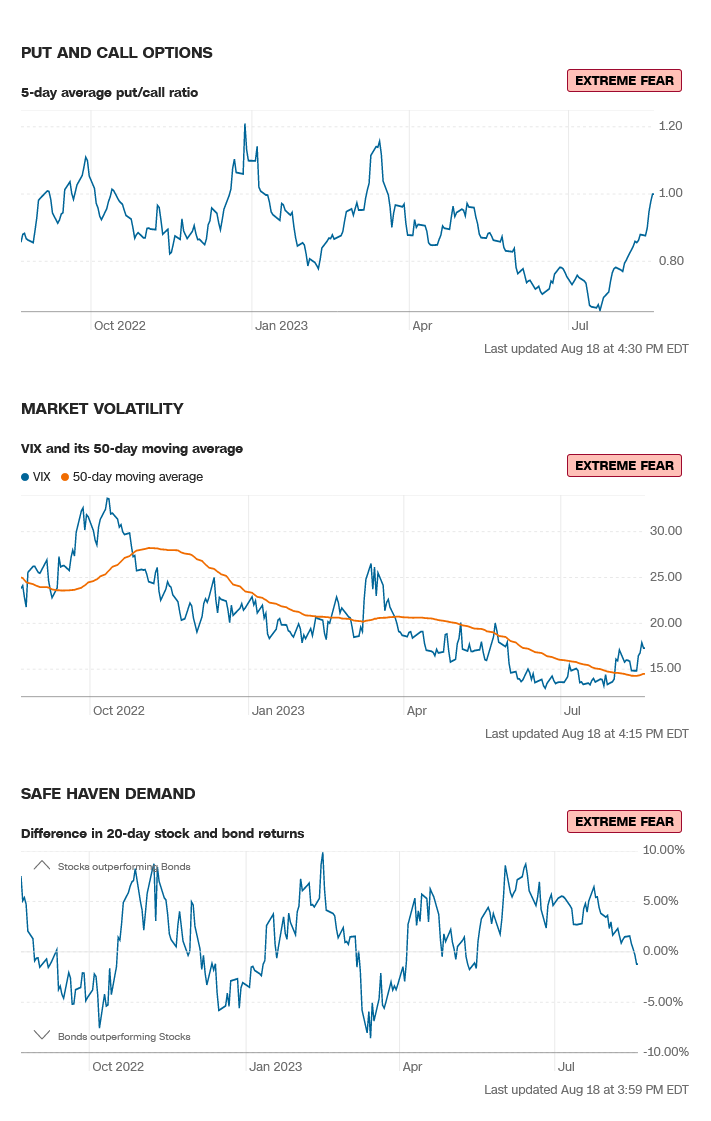
Sentiment shifted dramatically last week with a number of indicators moving into extreme fear quickly. The AAII Sentiment Index dropped below average for the first time in 11 weeks. The VIX jumped to three-month highs last week as it reacts to extreme oversold conditions. The 52-week, A/D line remains semi-greedy at +1.40%. The Put/Call ratio has driven into extreme fear territory, hitting 1.00, a level last seen 20 March 2023—when the Dow was at 32244. The Dow closed the week down -2.21%. The S&P was down -2.12%. The Nasdaq ended the week down -2.59%, the FANG closed down -3.01% with the Russell off -3.32%. Safe-haven sentiment is showing a FEAR reading as the bond markets are testing the late 2022 bottoms. Commodities, based on the CRB Index, sold off slightly last week as gold and the metals set new five-month lows. The Commitment of Traders CoT basically tells the story of smart money buying throughout the first half of 2023 and unloading their inventory the first two month of the second half. Commercials have now dumped to the point where they were at when the market was last setting lows in late 2022. Asset managers have flattened their buying, and the same can be said for the funds.
Timing Points
- 08-22/23 *** X Key-Critical
- 08-29/30 *** X Key-Critical
CNN Fear & Greed Index
AAII Investor Sentiment Survey
Dow Jones Industrial Average Hourly HLC
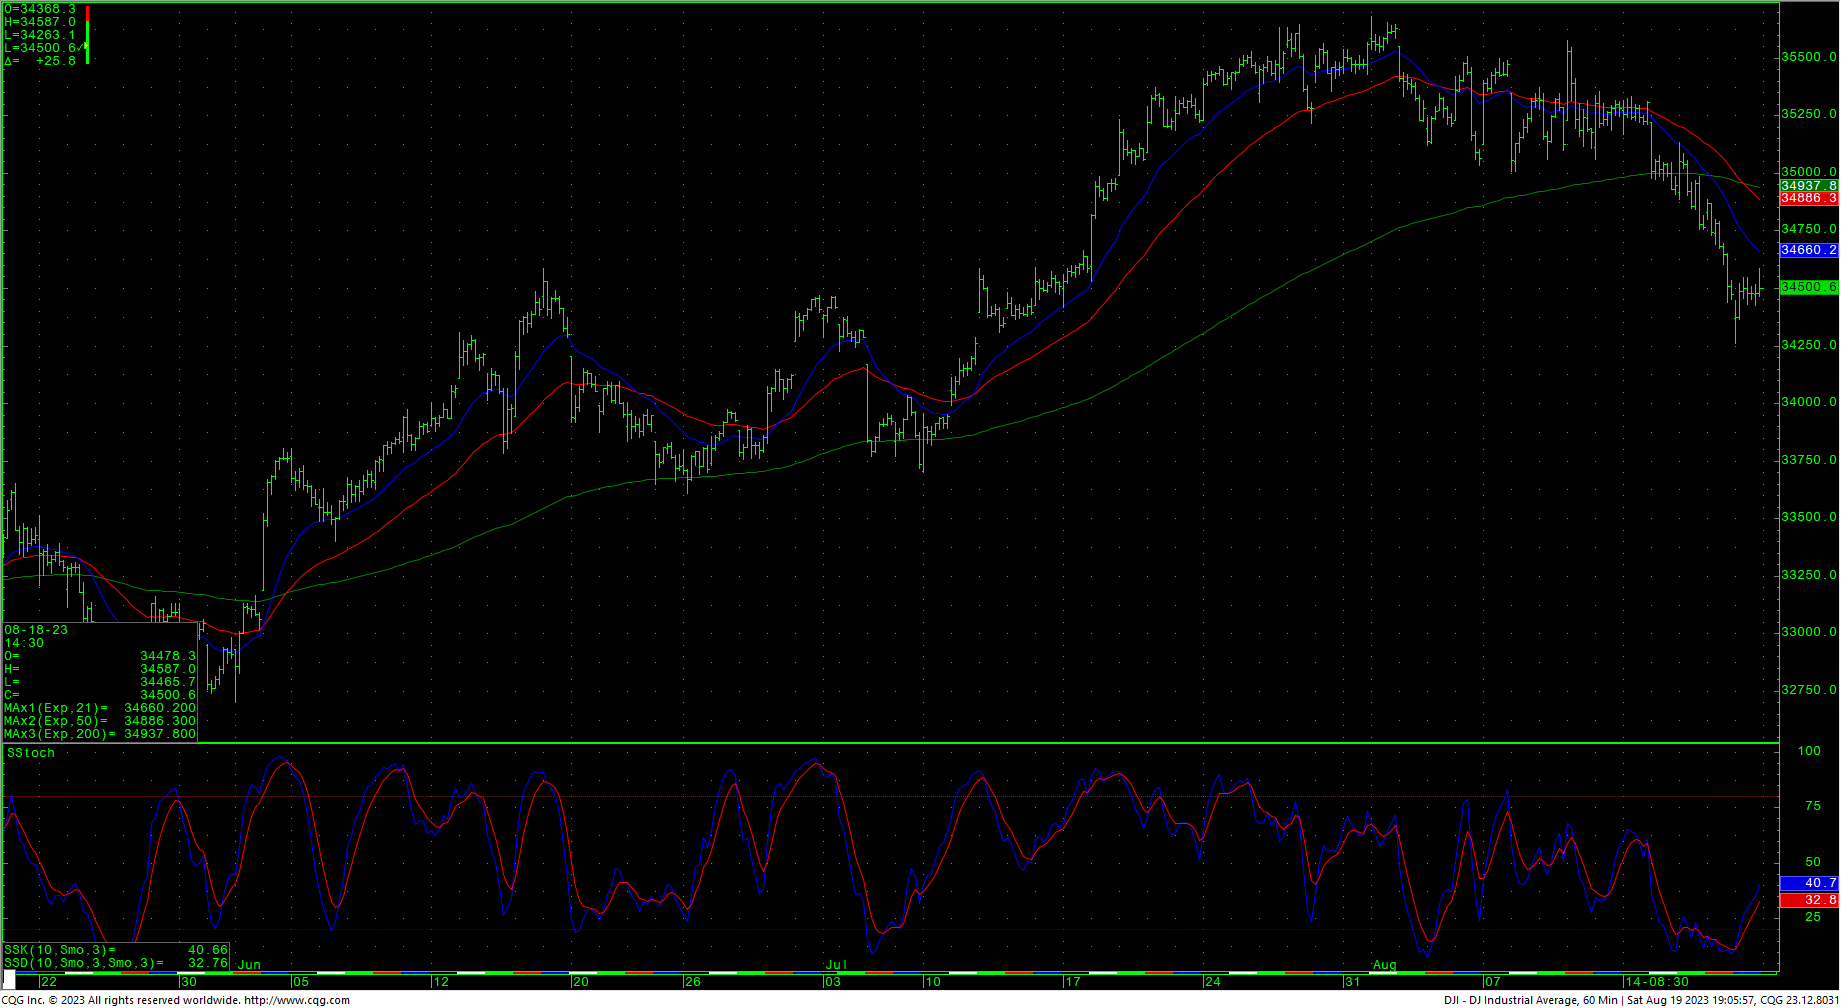
The Dow hourly is reacting to oversold conditions after prices hit short-term pivotal support of 34400/34390. A continued breakdown with closes under 34390 opens counts to 34132 with potential to short-term critical support of 33767/33760. Daily closes under 33760 open counts to major short-term support in the 33359 through 33316 area. Closes under 33316 can test 32998 with counts to critical intermediate-term support of 32586/32580. Closes below 32580 suggest a move to 32170 with potential to 31341/31330.
Resistance is now at 34597, 34804, key at 34971 and short-term pivotal at 35138/35145. Rallies with closes over 35145 suggest a test of last-gasp resistance at 35325/35344. Closes above 35344 setup a test of the trading highs at 35679 with intermediate counts to 35824 and longer-term counts into a gap area on the daily at 35996 to 36044. A breakout over 36044 sets up the 36513 area with potential to test the all-time record highs at 36952. A reminder that the larger inverted H&S pattern on the DJIA weekly counts toward long-term targets at 37095.
Dow Jones Industrial Average Weekly HLC
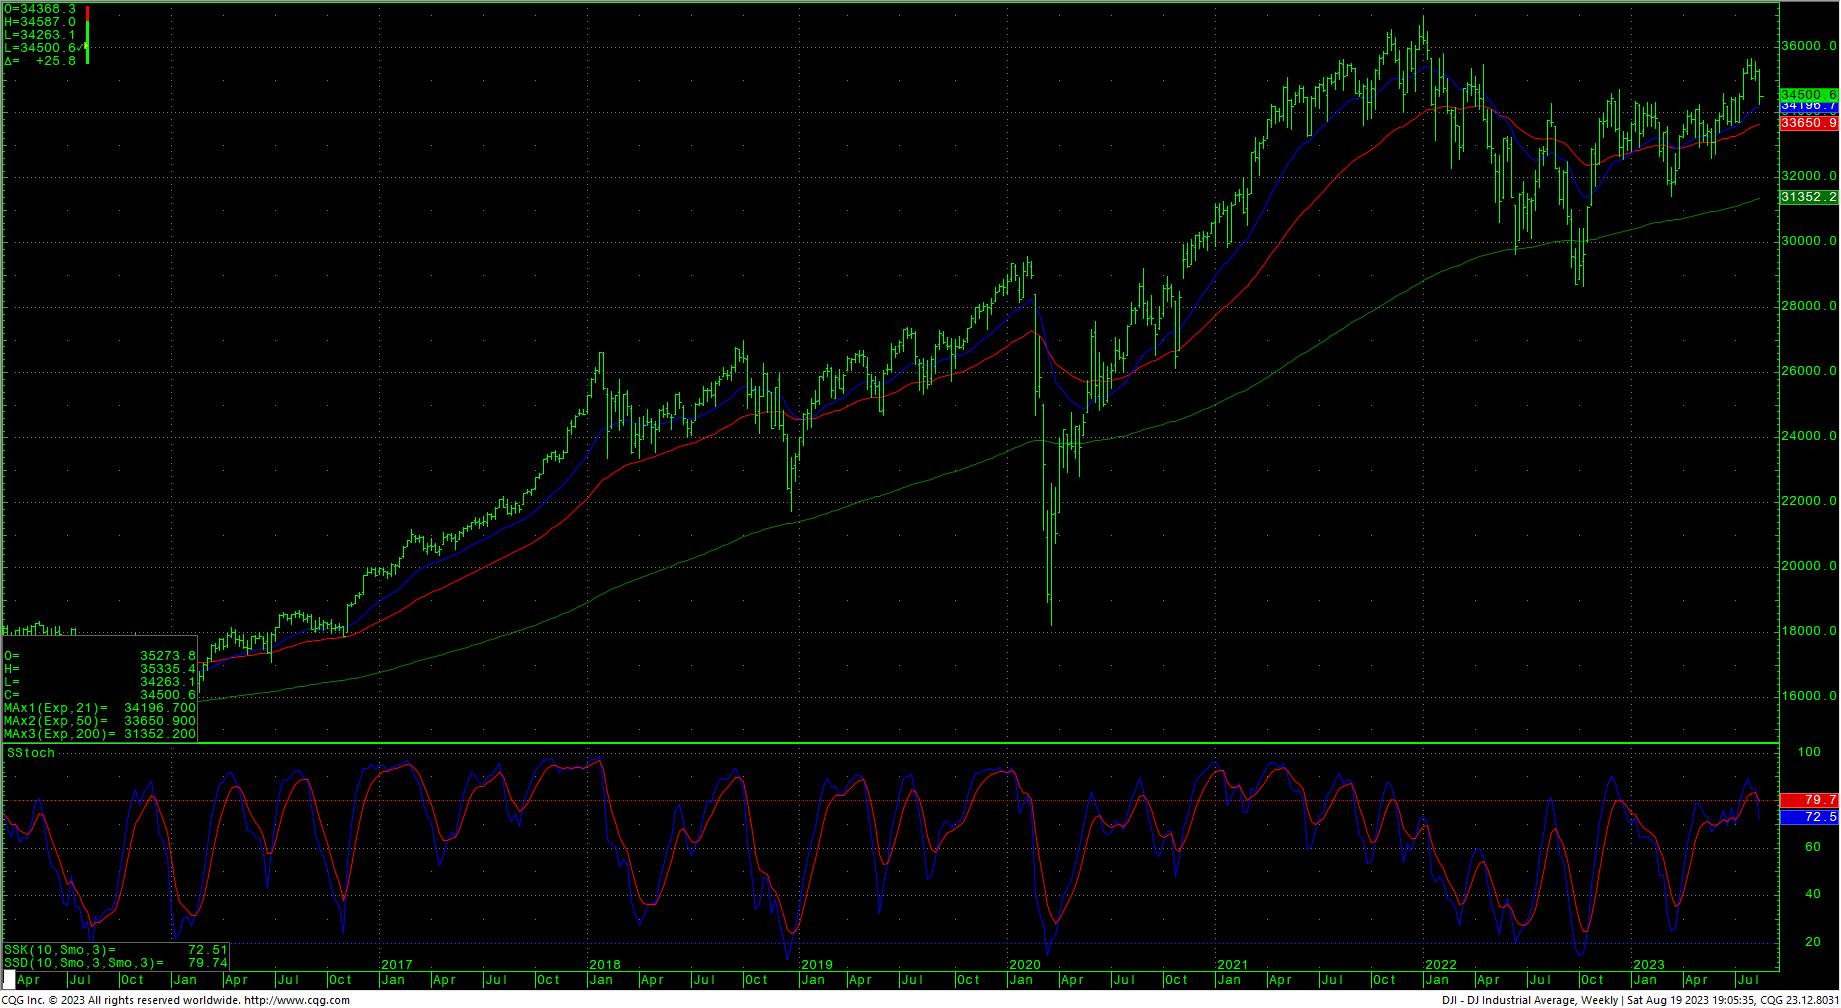
Support
- 34400/34390 *** ↓
- 34270 **
- 34132 *** ↓
- 33990 **
- 33865 **
- 33767/33760 *** ↓
- 33610 *** ↓
- 33537 **
- 33400/33399 *** ↓
- 33359 ** ↓
- 33316 ** ↓
- 33187 ** ↓
- 33091 *** ↓
- 32998 *** ↓
Resistance
- 34597 **
- 34804 ***
- 34971 *** ↑
- 35138/35144 *** ↑
- 35325/35344 *** ↑
- 35578 ** ↑
- 35670 *** ↑
- 35800/35824 *** ↑
- 35996 ***
- 36044 *** ↑
- 36271 **
- 36390 **
- 36513 ***↑
- 36636 **
- 36934/36952 *** ↑
- 37095/37096 *** ↑
S&P 500 Cash Index
The S&P hourly is bouncing from deeply oversold conditions as prices neared a critical swing point on that chart against the late June lows at 4328. A further breakdown with closes under 4328 set up a move to 4180/4177. Closes under 4177 open counts to 4049 and critical short-term support of 3917/3910. Daily closes below 3910 open counts to 3754/3750 with potential to support at 3503/3491.
Resistance short-term is 4399, 4439, 4471 and pivotal at 4503/4510. Closes back over 4510 setup a minimal test of 4550 and 4575. Closes over 4575 are bullish for a test of the swing high at 4607. Closes over 4607 suggest a minimal test of 4637. A breakout with closes above 4637 opens potential toward 4748 and ultimately 4818. Above the record highs opens counts to 4952/5000 with potential to 5144.
S&P 500 Index Weekly HLC
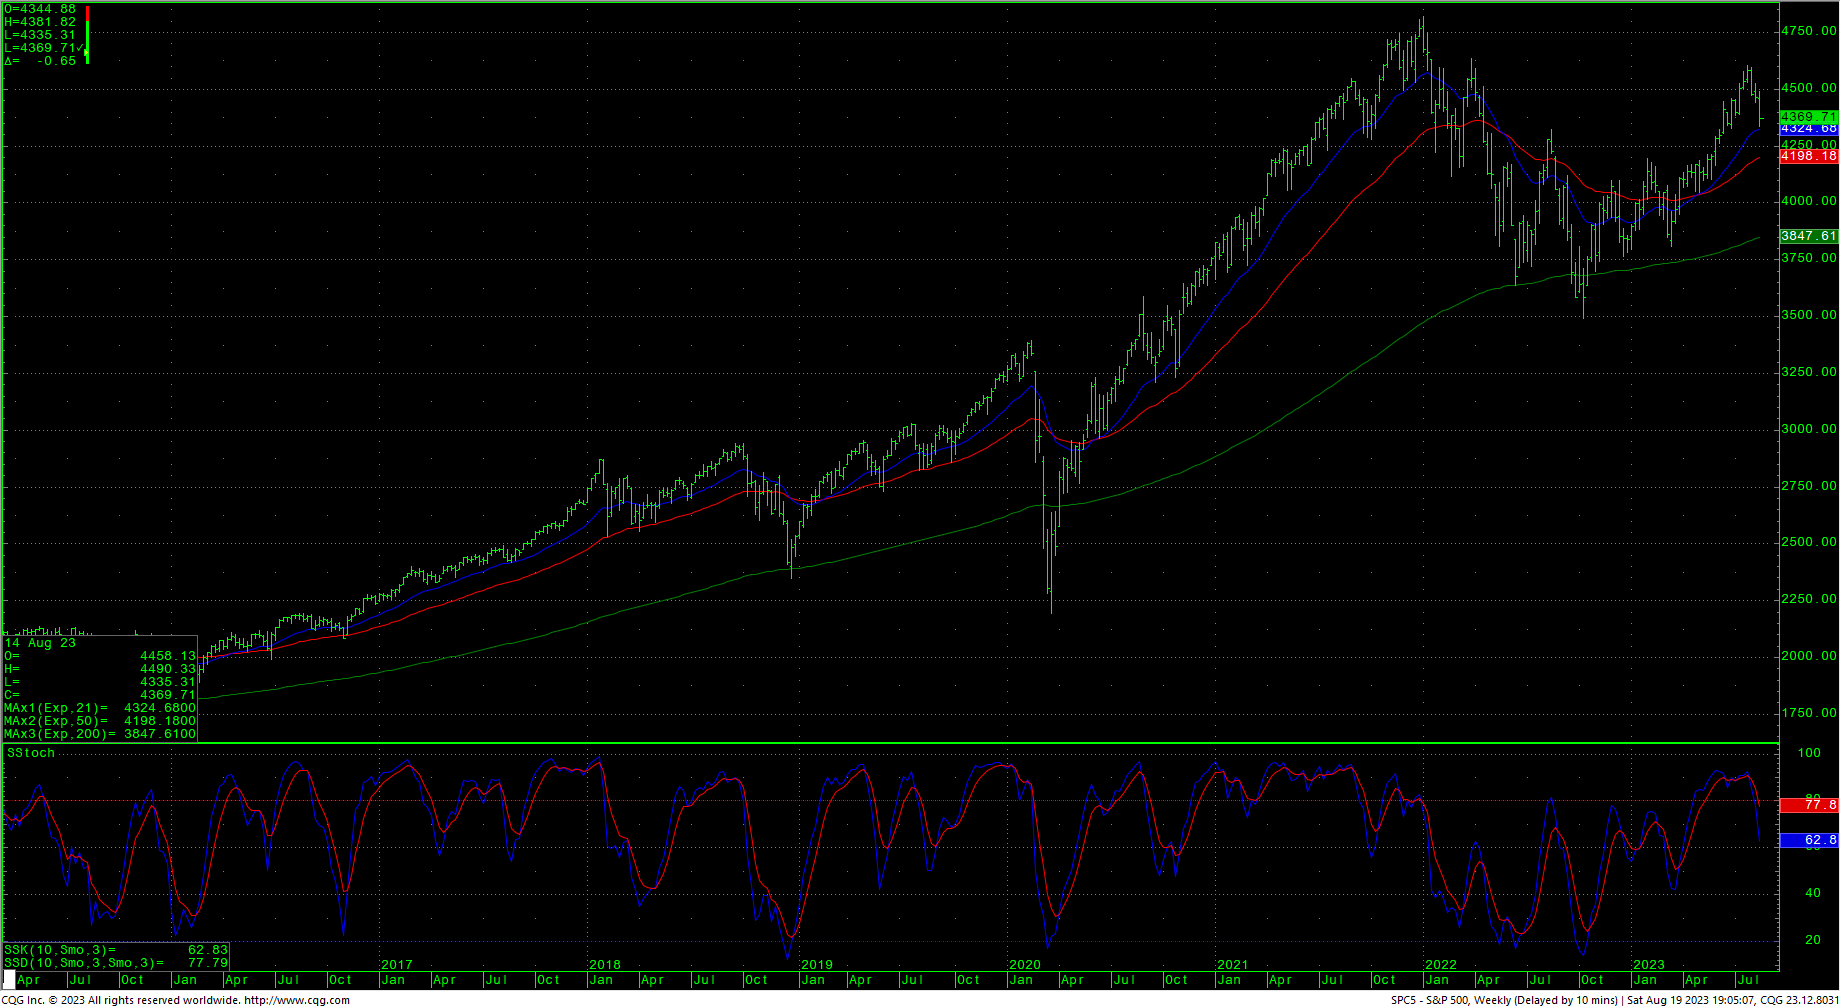
Support
- 4328 *** ↓
- 4304 **
- 4280 **
- 4261 *** ↓
- 4180/4177 *** ↓
- 4049 *** ↓
- 3917/3910 *** ↓
- 3875 **
- 3754/3750 *** ↓
- 3625 **
- 3500/3491 *** ↓
Resistance
- 4399 **
- 4439 **
- 4471 *** ↑
- 4503/4510 *** ↑
- 4530 **
- 4550 *** ↑
- 4575 *** ↑
- 4593 **
- 4607 *** ↑
- 4637 *** ↑
- 4665 **
- 4748 *** ↑
- 4818 *** ↑
- 4952 ***↑
- 5000 *** ↑
- 5072 **
- 5144 *** ↑


