
TECHNICAL ANALYSIS
Major Indices Week of September 1, 2023
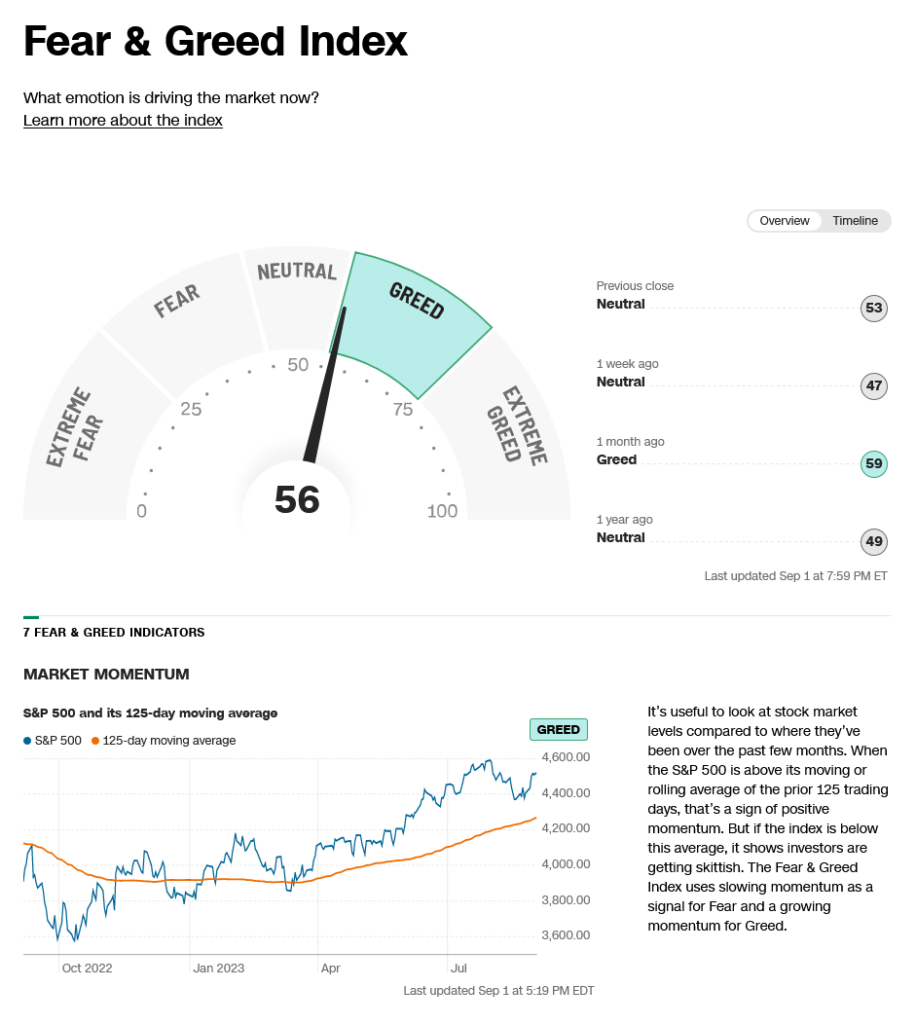
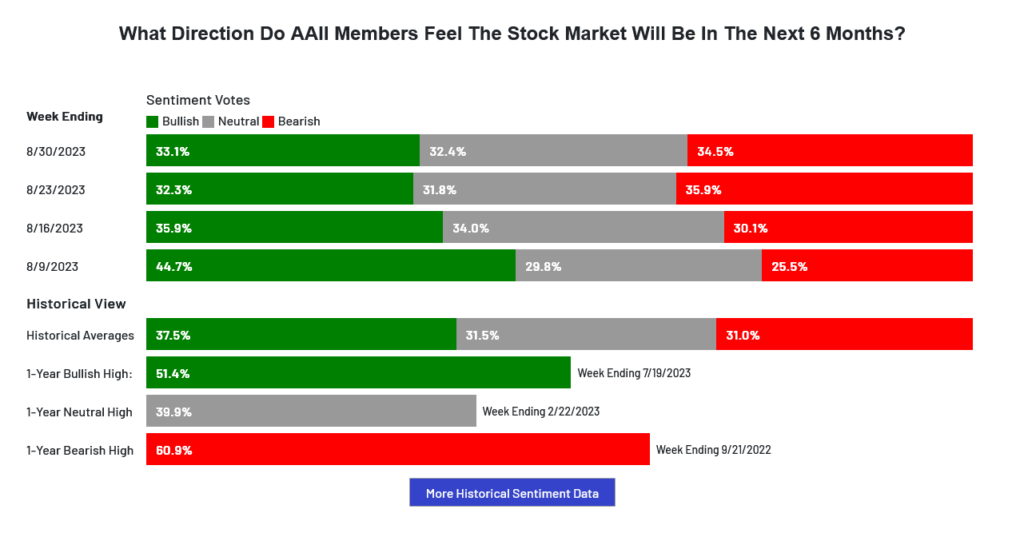
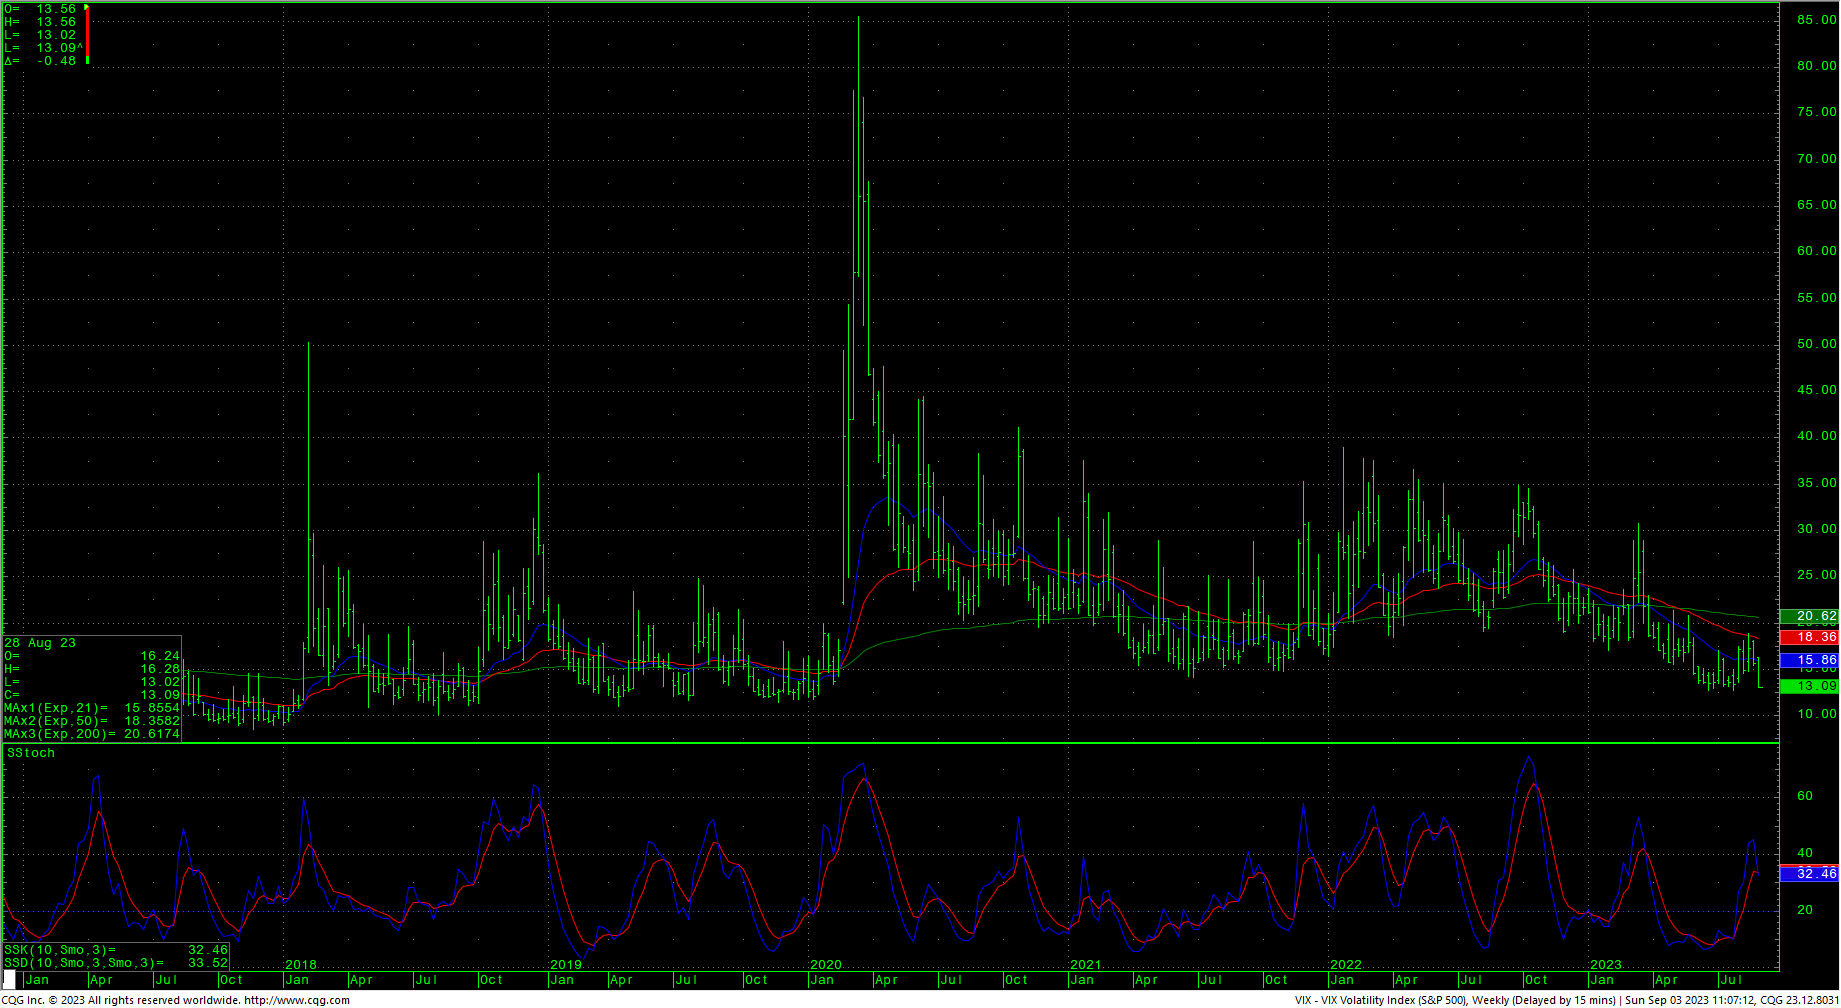
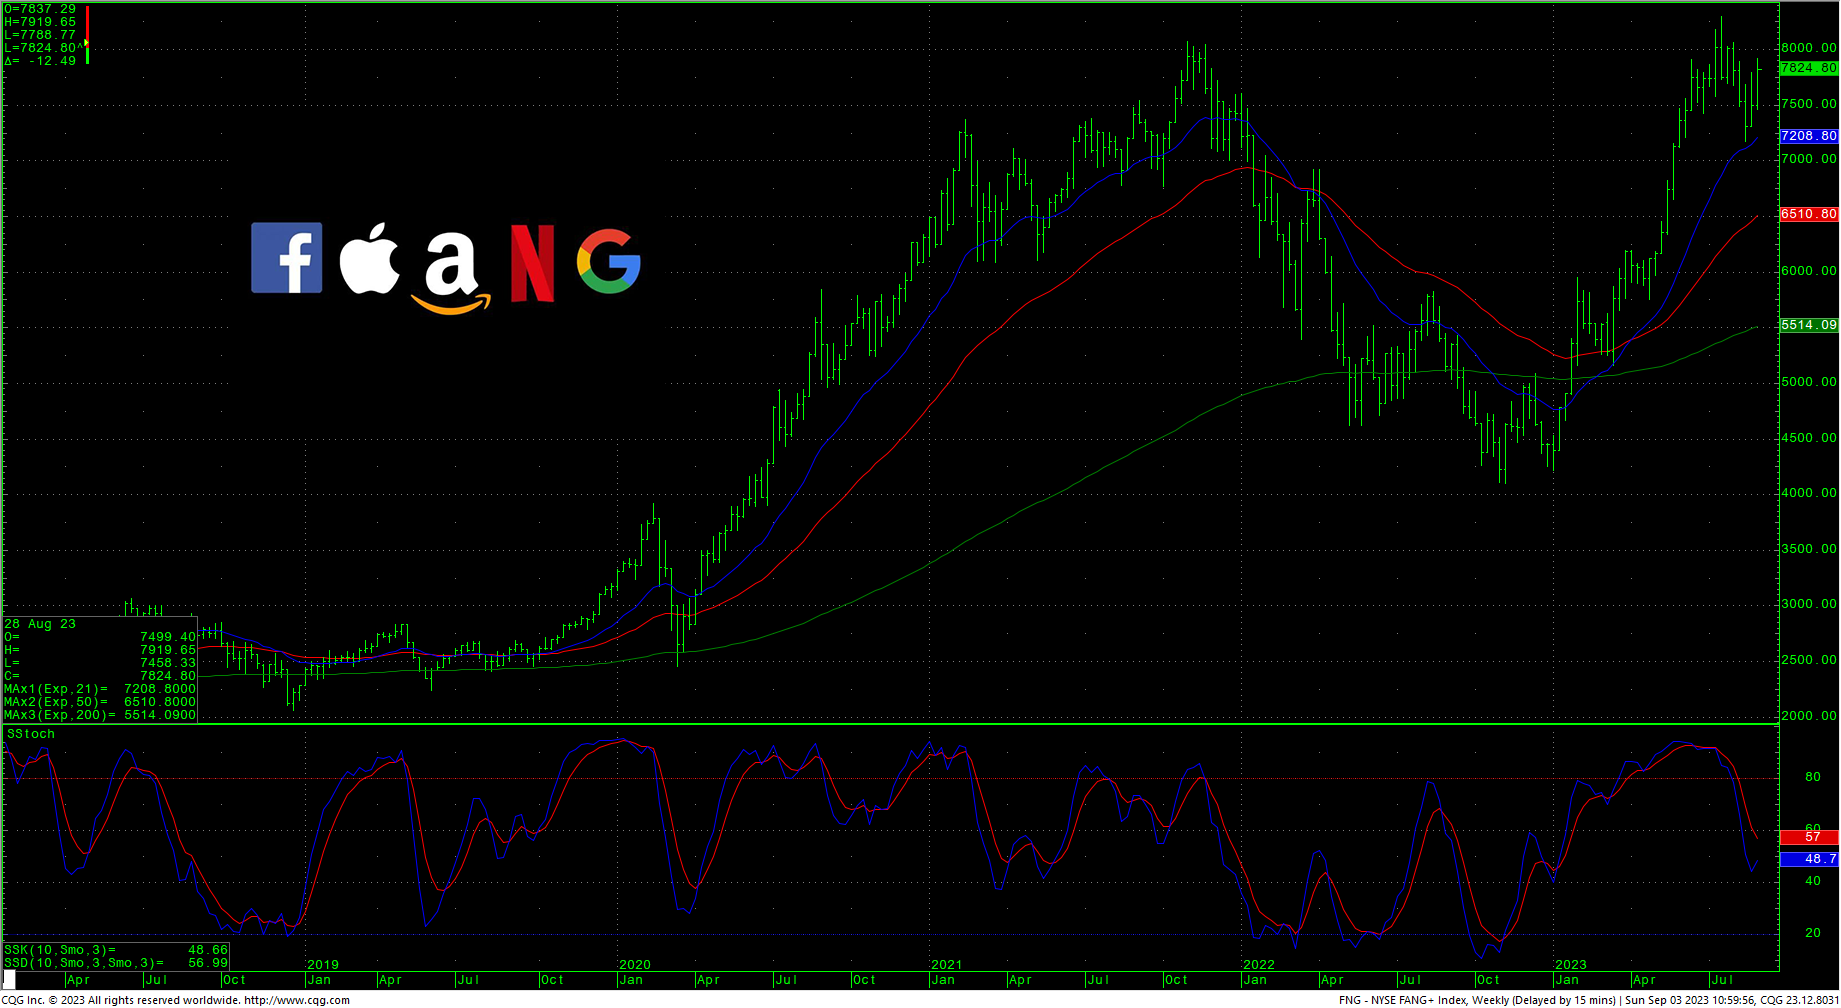
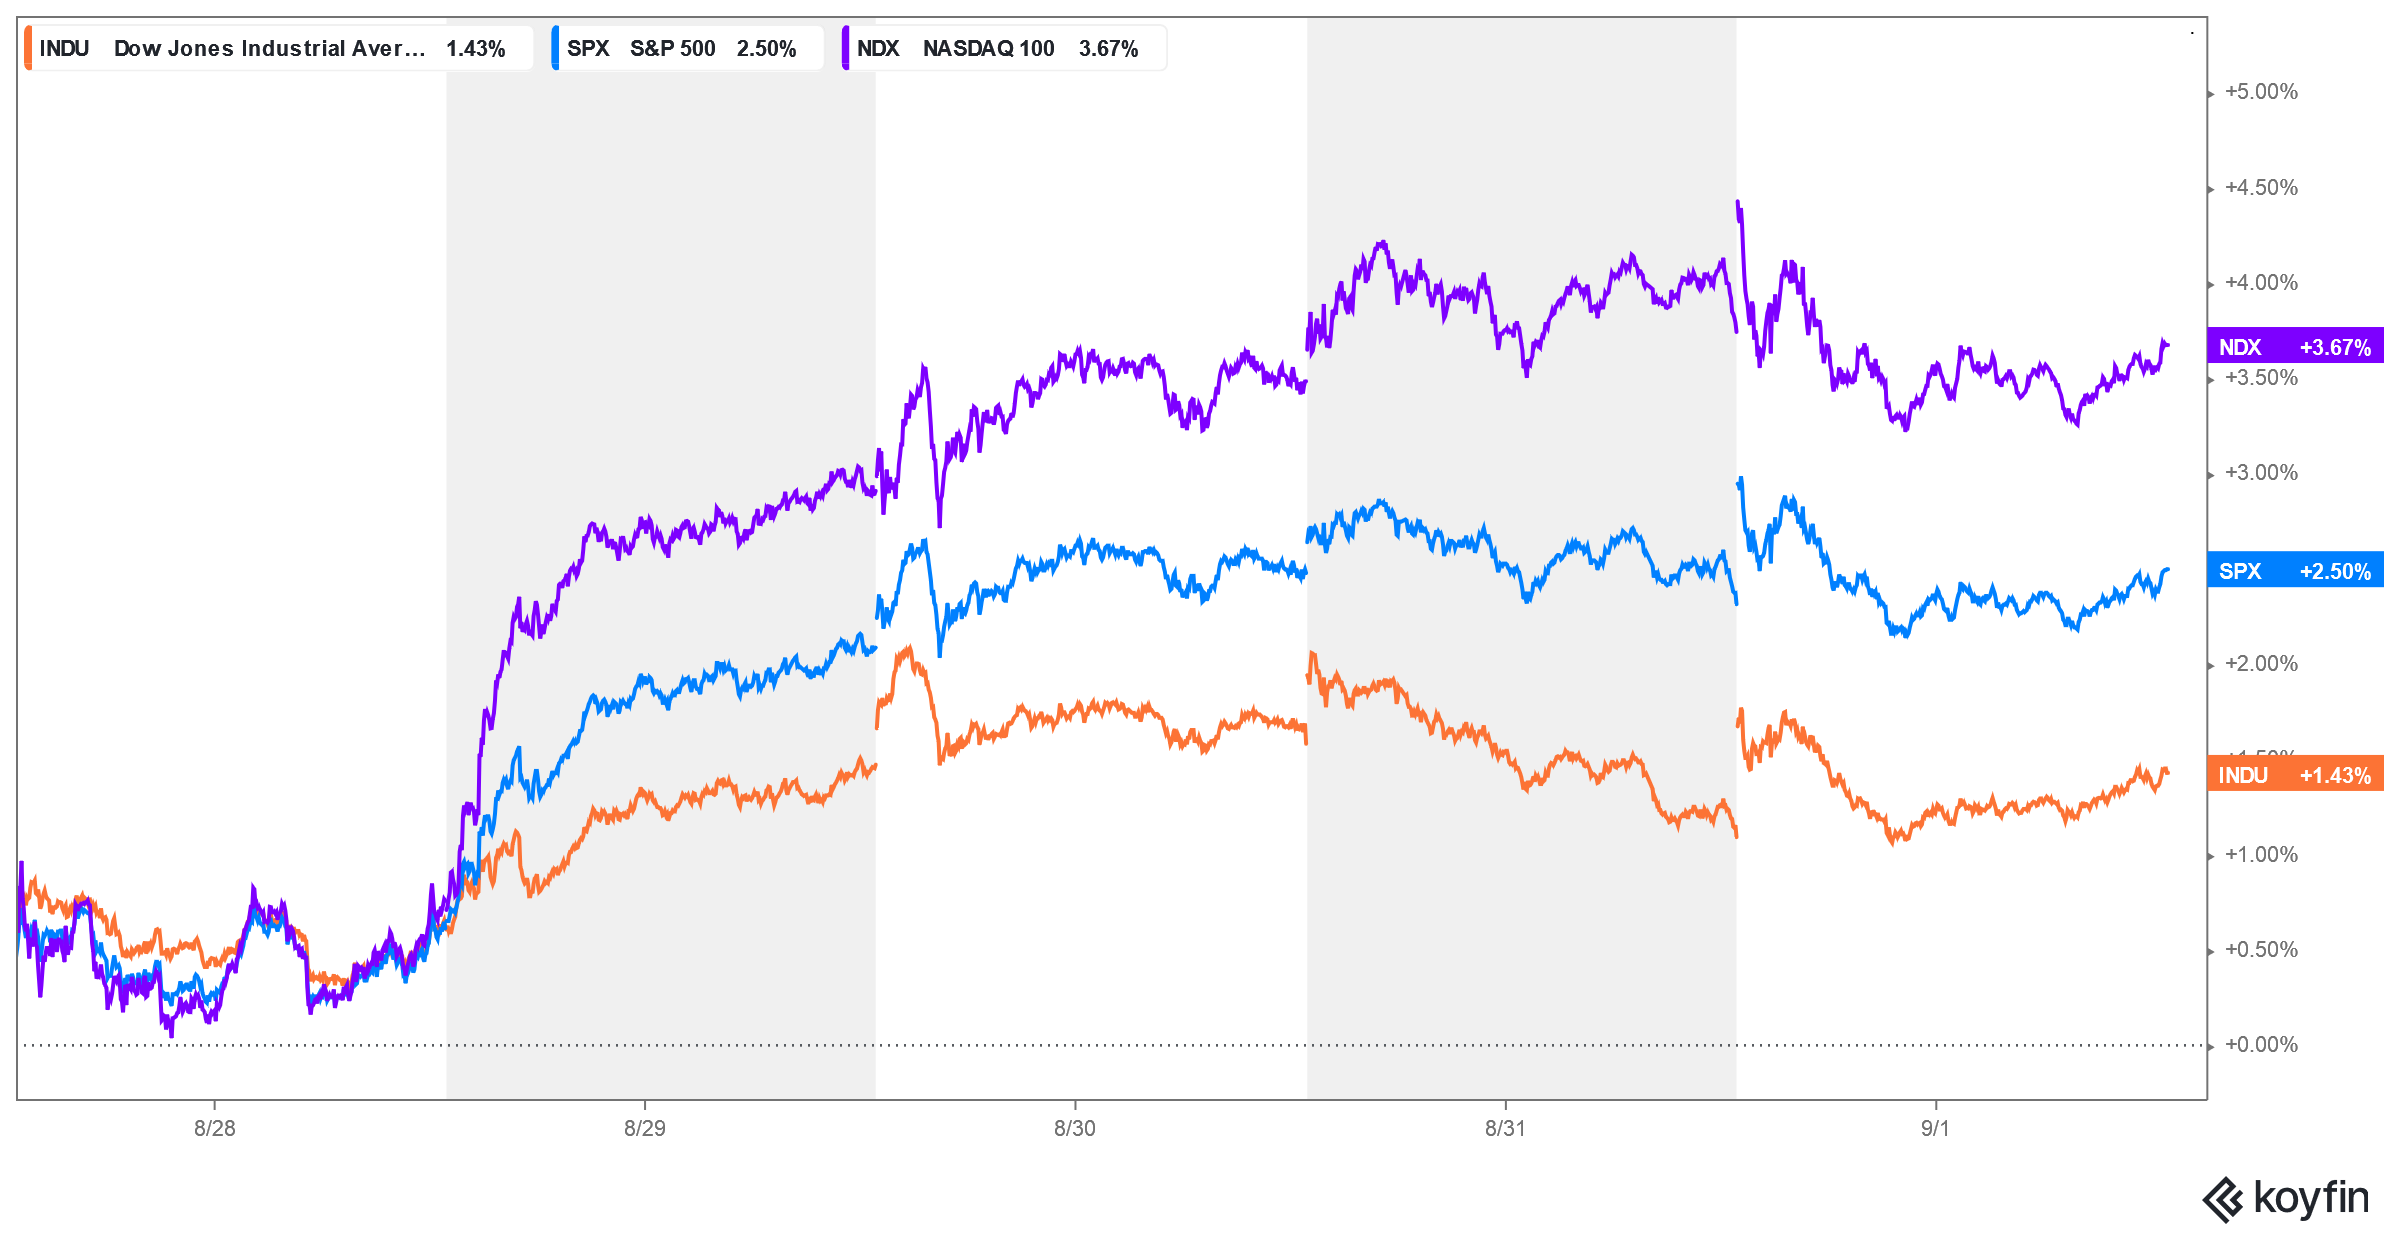 Stocks opened higher and held higher trade throughout the week with the tech indices once again leading the charge. The daily charts are in uptrends and the hourly charts have worked off oversold conditions and are turning back up with Friday’s action. Last week’s timing played a factor in Tuesday’s big rally. The next timing point is this Tuesday the 5th and one possibility is that whatever energy might have been holding back the tech stocks, the throttle should officially be off following this timing area. Sentiment moved back a bit toward greed in the CNN polls and the AAII Sentiment Index moved to a neutral reading. The VIX settled at the lowest weekly close since 13 January 2020. The 52-week, A/D dropped to -0.18%. The Put/Call ratio dropped to +0.89. The Dow closed the week up +1.43%. The S&P was up +2.50%. The Nasdaq ended the week up +3.25%, the FANG closed sharply higher, up +4.34% with the Russell up +3.73%. Safe-haven sentiment remains in FEAR but bond market collapsed on Friday to settled on the bottom of the weekly range as that chart remains deeply oversold. Commodities rallied to a new high for 2023, closing up +2.01%, as crude oil moved to the highest level since 14 November 2022. The Commitment of Traders CoT remains flattened out with no new clues lately. Commercial holdings are back to the lowest since the middle of 2022.
Timing Points
- 09/05 *** (end of tech decline?)
- 09/08 **
- 09/14 *** bonds
- 09/22 **
- 09-28 *** X extreme/fast moves
CNN Fear & Greed Index
 AAII Investor Sentiment Survey
 Dow Jones Industrial Average Hourly HLC

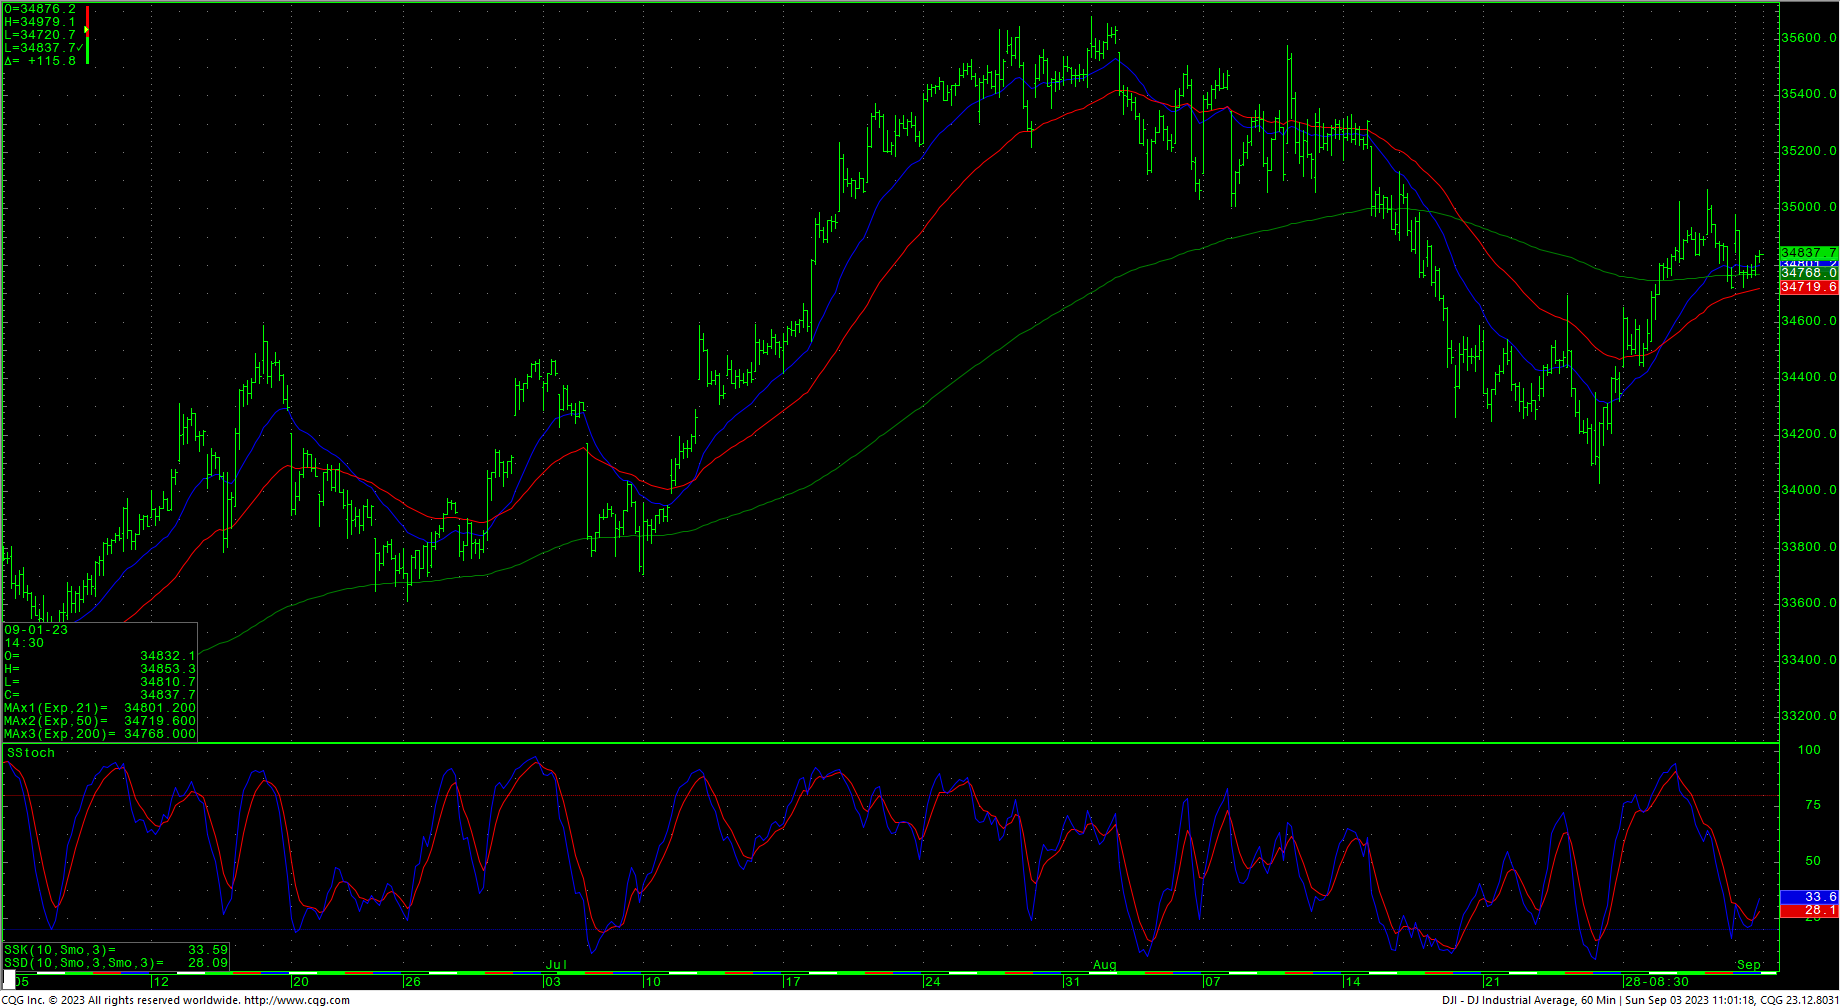 The Dow hourly is reacting to short-term oversold conditions and prices are holding at roughly a 50% retracement of the recent selloff. Support is 34672, 34549 and 34426/34420. A breakdown under 34420 should test 34289/34274 and open counts to retest 34022 with potential to short-term critical support at 33767/33760. Daily closes under 33760 open counts to major short-term support in the 33359 through 33316 area. Closes under 33316 can test 32998 with counts to critical intermediate-term support of 32586/32580. Closes below 32580 suggest a move to 32170 with potential to 31341/31330.
Resistance remains short-term pivotal at 35048/35055. Further rallies with closes over 35055 suggest a test of last-gasp resistance at 35266/35289. Closes above 35289 setup a test of the trading highs at 35679 with intermediate counts to 35824 and longer-term counts into a gap area on the daily at 35996 to 36044. A breakout over 36044 sets up the 36513 area with potential to test the all-time record highs at 36952. A reminder that the larger inverted H&S pattern on the DJIA weekly counts toward long-term targets at 37095.
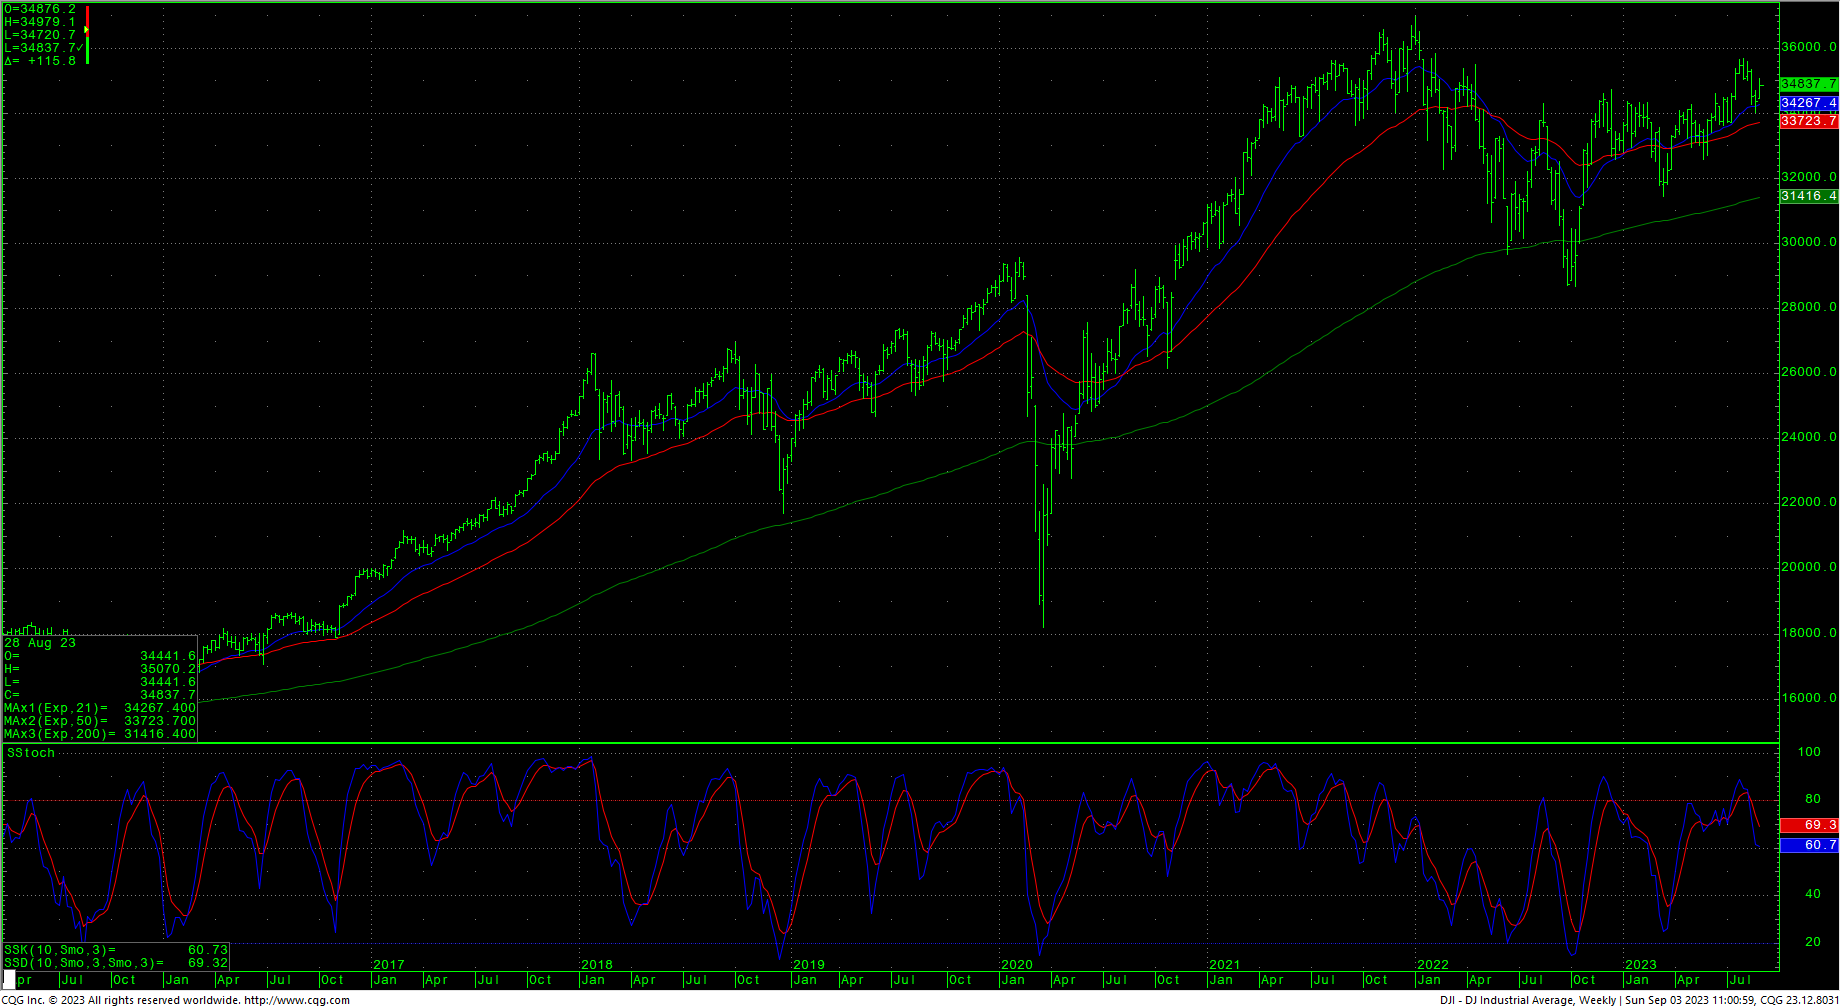
Dow Jones Industrial Average Weekly HLC
 Support
- 34672 **
- 34549 ***
- 34426/34420 ***↓
- 34132 **
- 34020/34022 *** ↓
- 33865 **
- 33767/33760 *** ↓
- 33610 *** ↓
- 33537 **
- 33400/33399 *** ↓
- 33359 ** ↓
- 33316 ** ↓
- 33187 ** ↓
- 33091 *** ↓
- 32998 *** ↓
Resistance
- 34854 *** ↑
- 34941 **
- 35048/35055 *** ↑
- 35266/35289 *** ↑
- 35354 ** ↑
- 35432 **
- 35578 ** ↑
- 35670 *** ↑
- 35800/35824 *** ↑
- 35996 ***
- 36044 *** ↑
- 36271 **
- 36390 **
- 36513 ***↑
- 36636 **
- 36934/36952 *** ↑
- 37095/37096 *** ↑
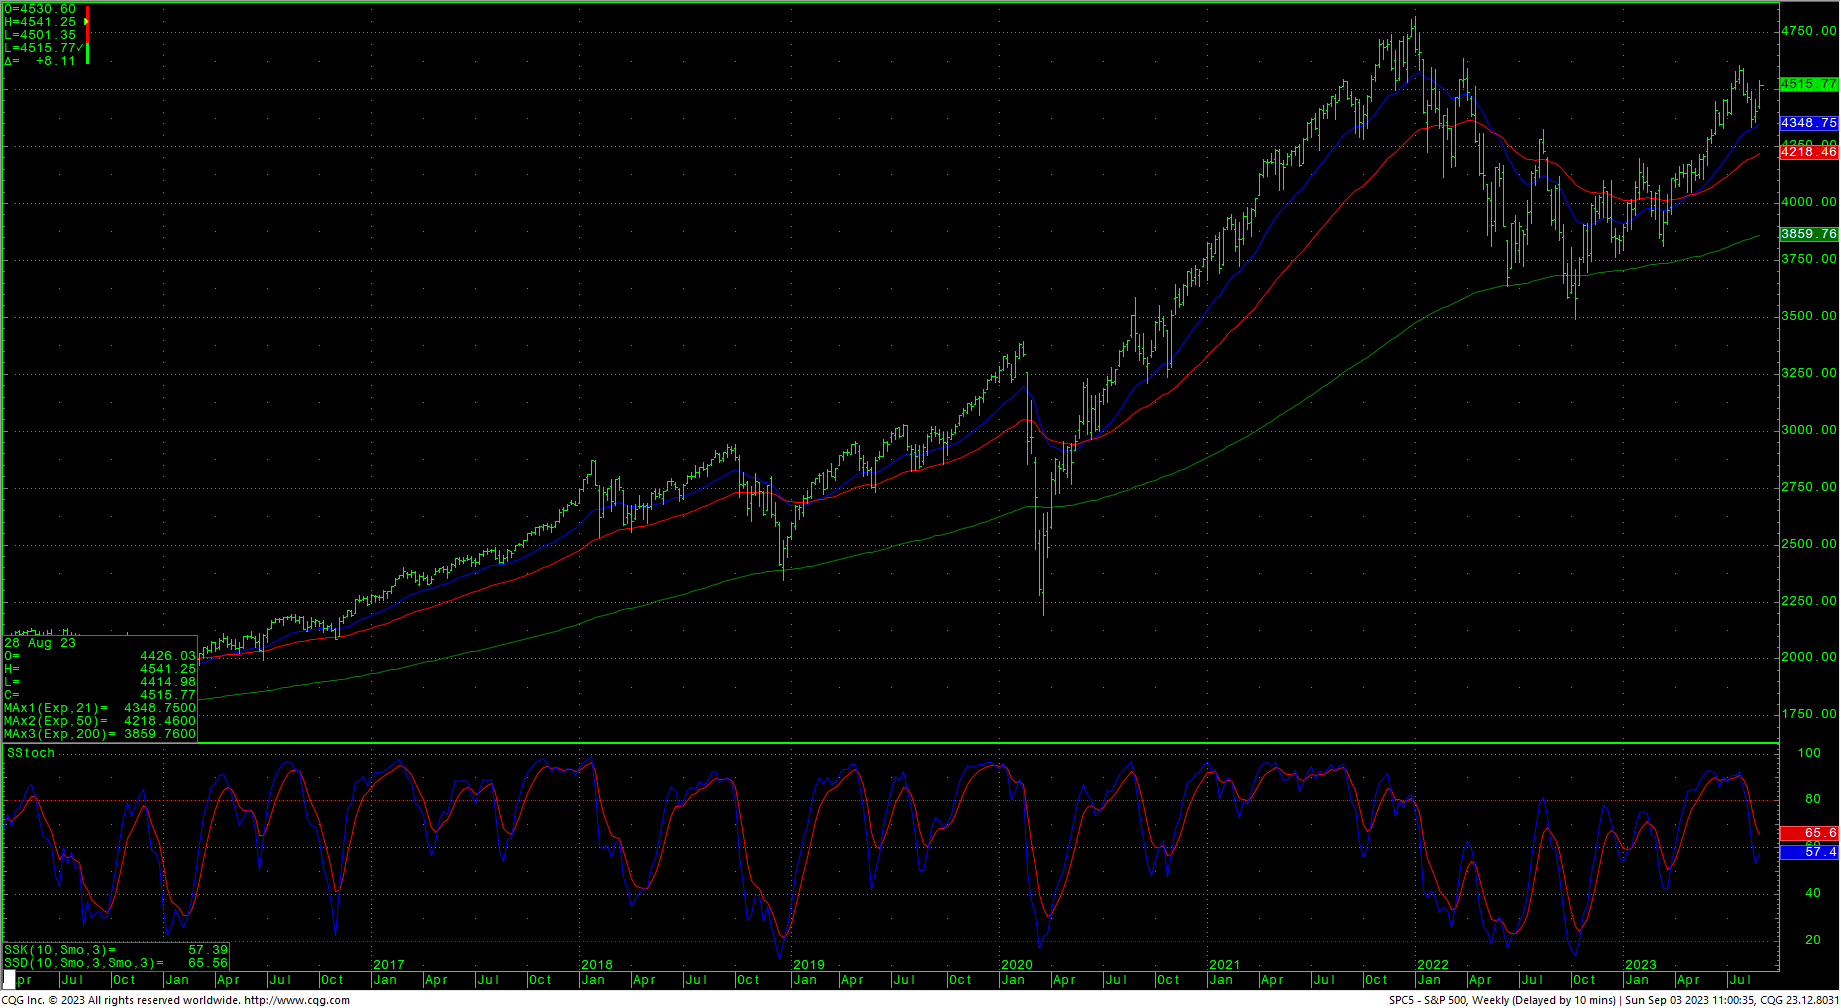
S&P 500 Cash Index
The S&P hourly is bouncing from short-term oversold conditions and remains neutral. Prices cleared, and settled above, pivotal resistance at 4503/4510. Continued closes over 4510 setup a minimal test of 4550 and 4575. Closes over 4575 are bullish for a test of the swing high at 4607. Closes over 4607 suggest a minimal test of 4637. A breakout with closes above 4637 opens potential toward 4748 and ultimately 4818. Above the record highs opens counts to 4952/5000 with potential to 5144.
Support is 4462, 4438 and near-term pivotal at 4413/4410. Closes under 4410 should test 4328. A breakdown with closes under 4328 set up a move to 4180/4177. Closes under 4177 open counts to 4049 and critical short-term support of 3917/3910. Daily closes below 3910 open counts to 3754/3750 with potential to support at 3503/3491.
S&P 500 Index Weekly HLC
 Support
- 4462 **
- 4438 ***
- 4413/4410 ***↓
- 4380 **
- 4356 **
- 4335/4328 *** ↓
- 4304 **
- 4280 **
- 4261 *** ↓
- 4180/4177 *** ↓
- 4049 *** ↓
- 3917/3910 *** ↓
- 3875 **
- 3754/3750 *** ↓
- 3625 **
- 3500/3491 *** ↓
Resistance
- 4526/4527 **
- 4541 **
- 4550 *** ↑
- 4575 *** ↑
- 4593 **
- 4607 *** ↑
- 4637 *** ↑
- 4665 **
- 4748 *** ↑
- 4818 *** ↑
- 4952 ***↑
- 5000 *** ↑
- 5072 **
- 5144 *** ↑

