
TECHNICAL ANALYSIS
Major Indices Week of October 13, 2023
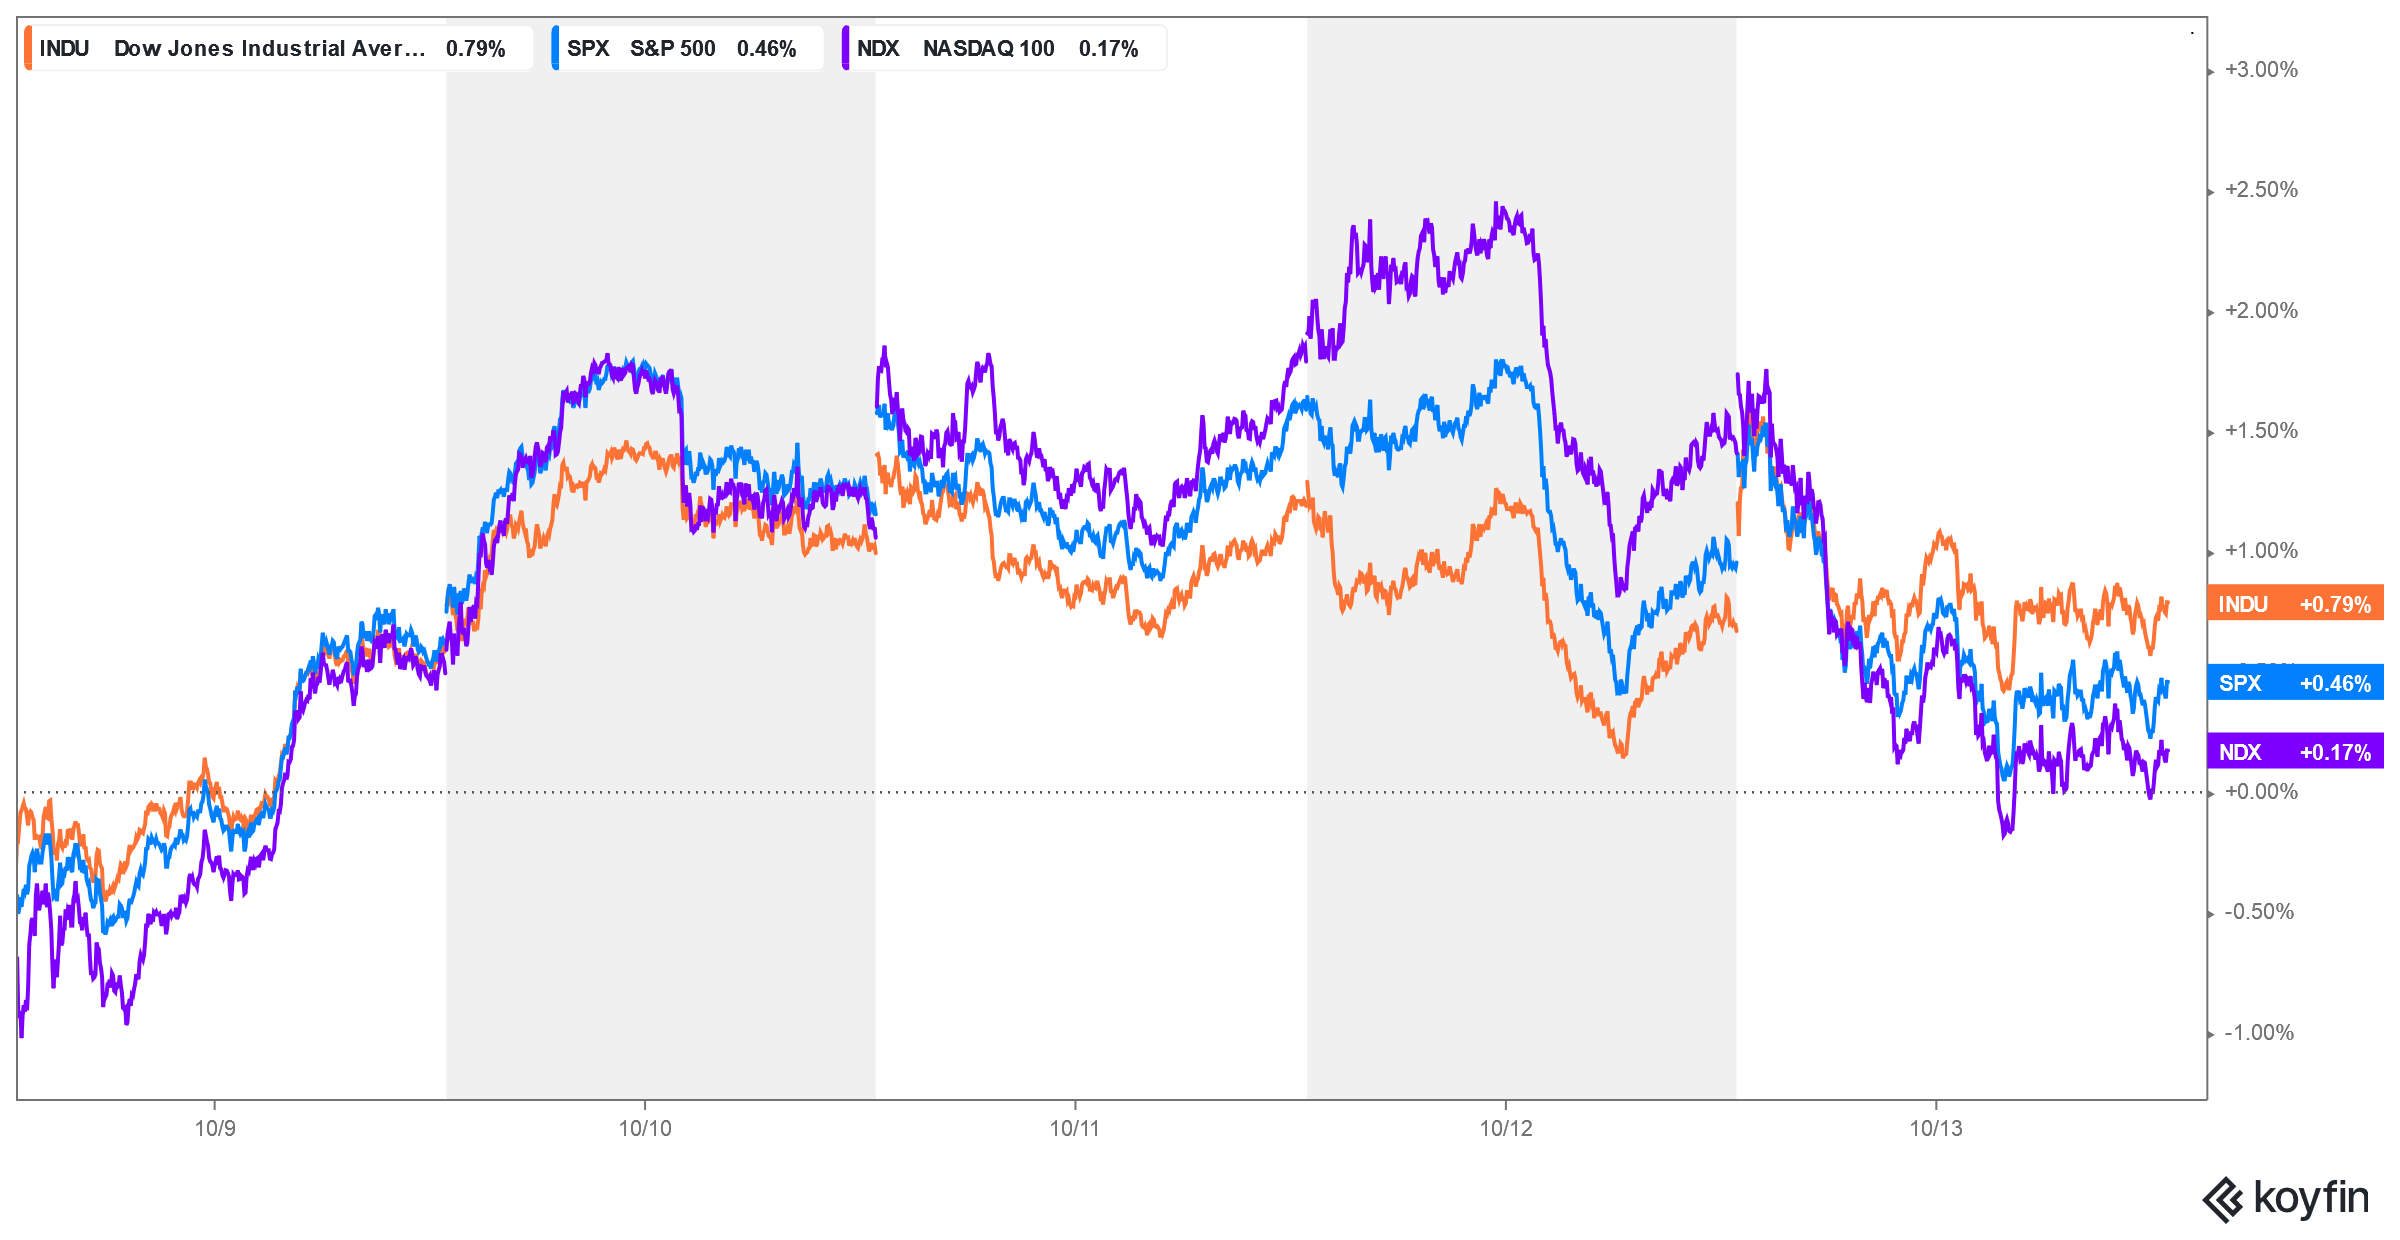 Stocks traded a tight and volatile week, dominated by geopolitical news, with blue chips and large caps eking out gains and settling in the middle of the weekly range…while tech and secondary stocks lagged. Short-term, the key now will be to see how prices move away from the strong timing of Friday. The next timing point is this Thursday and is minor.
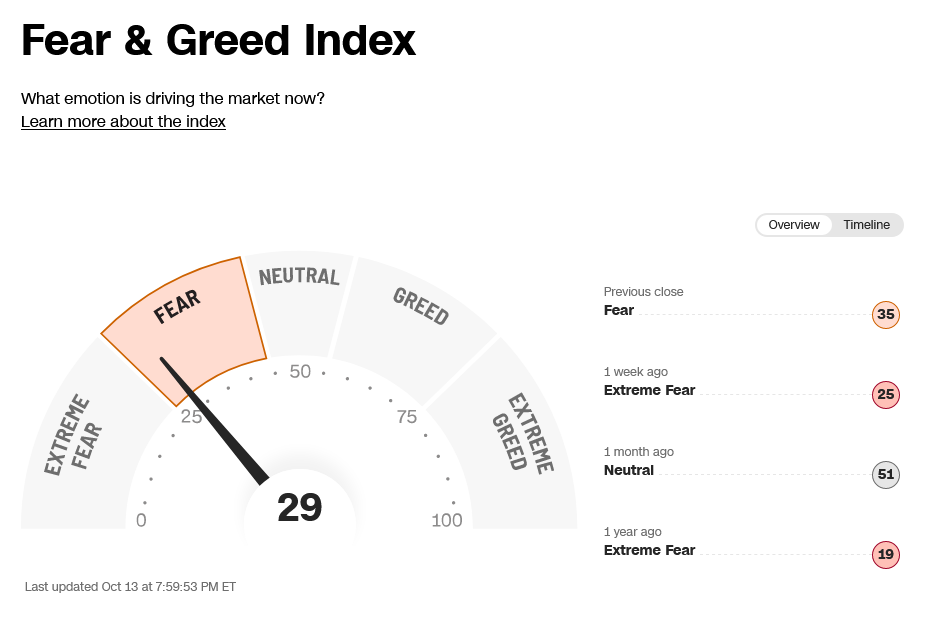
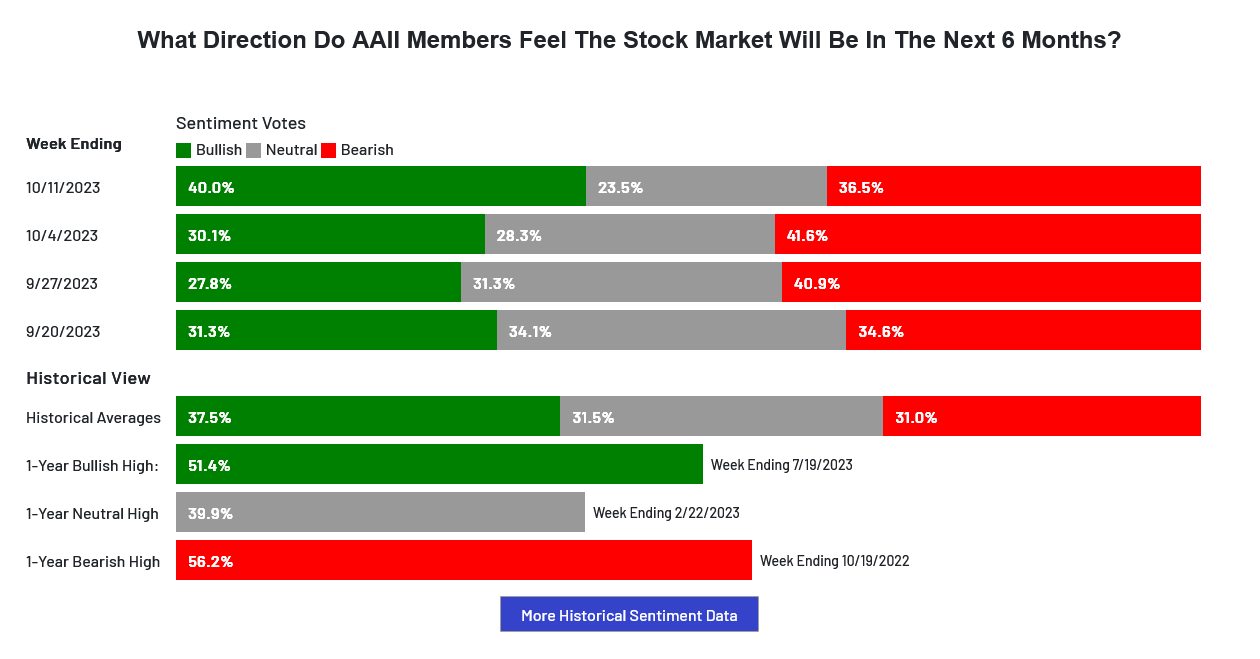
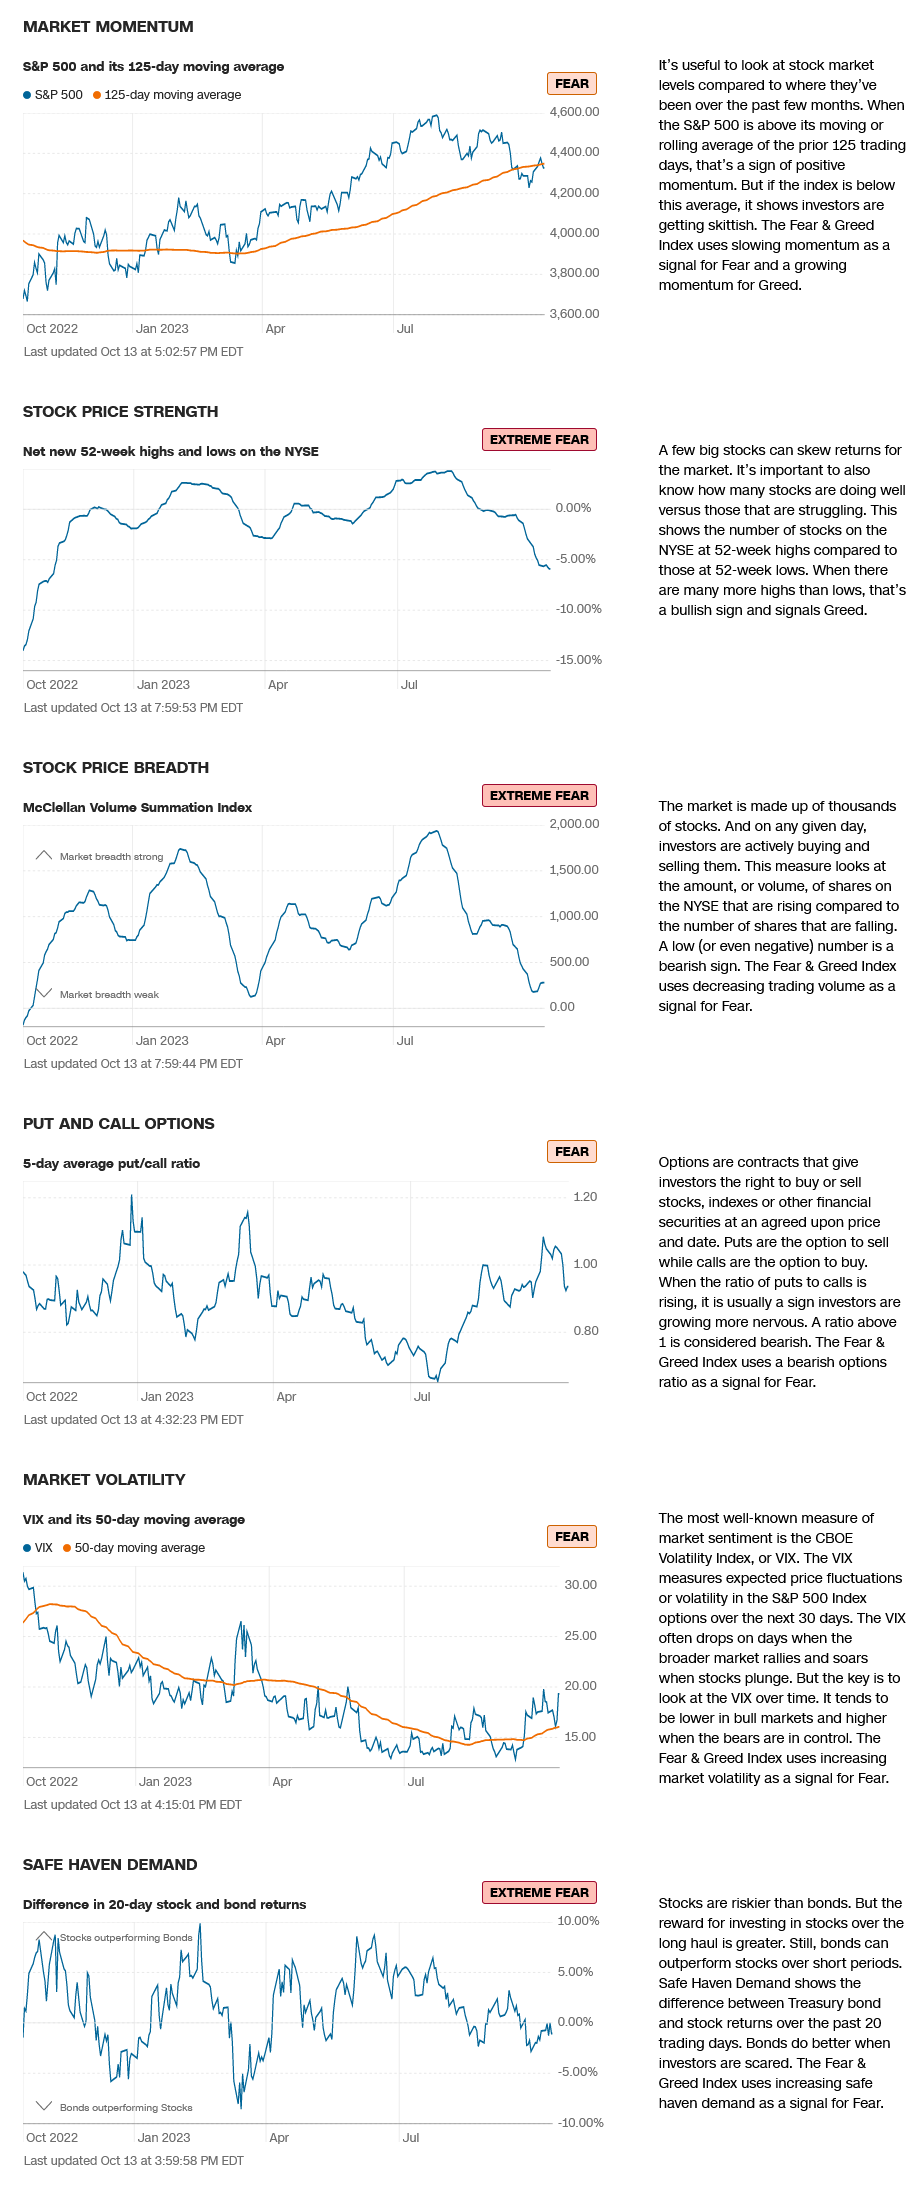
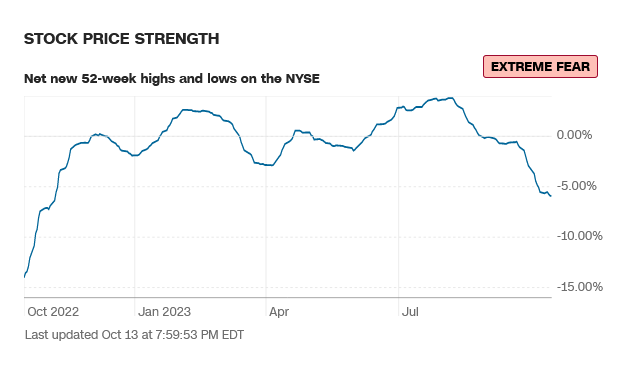
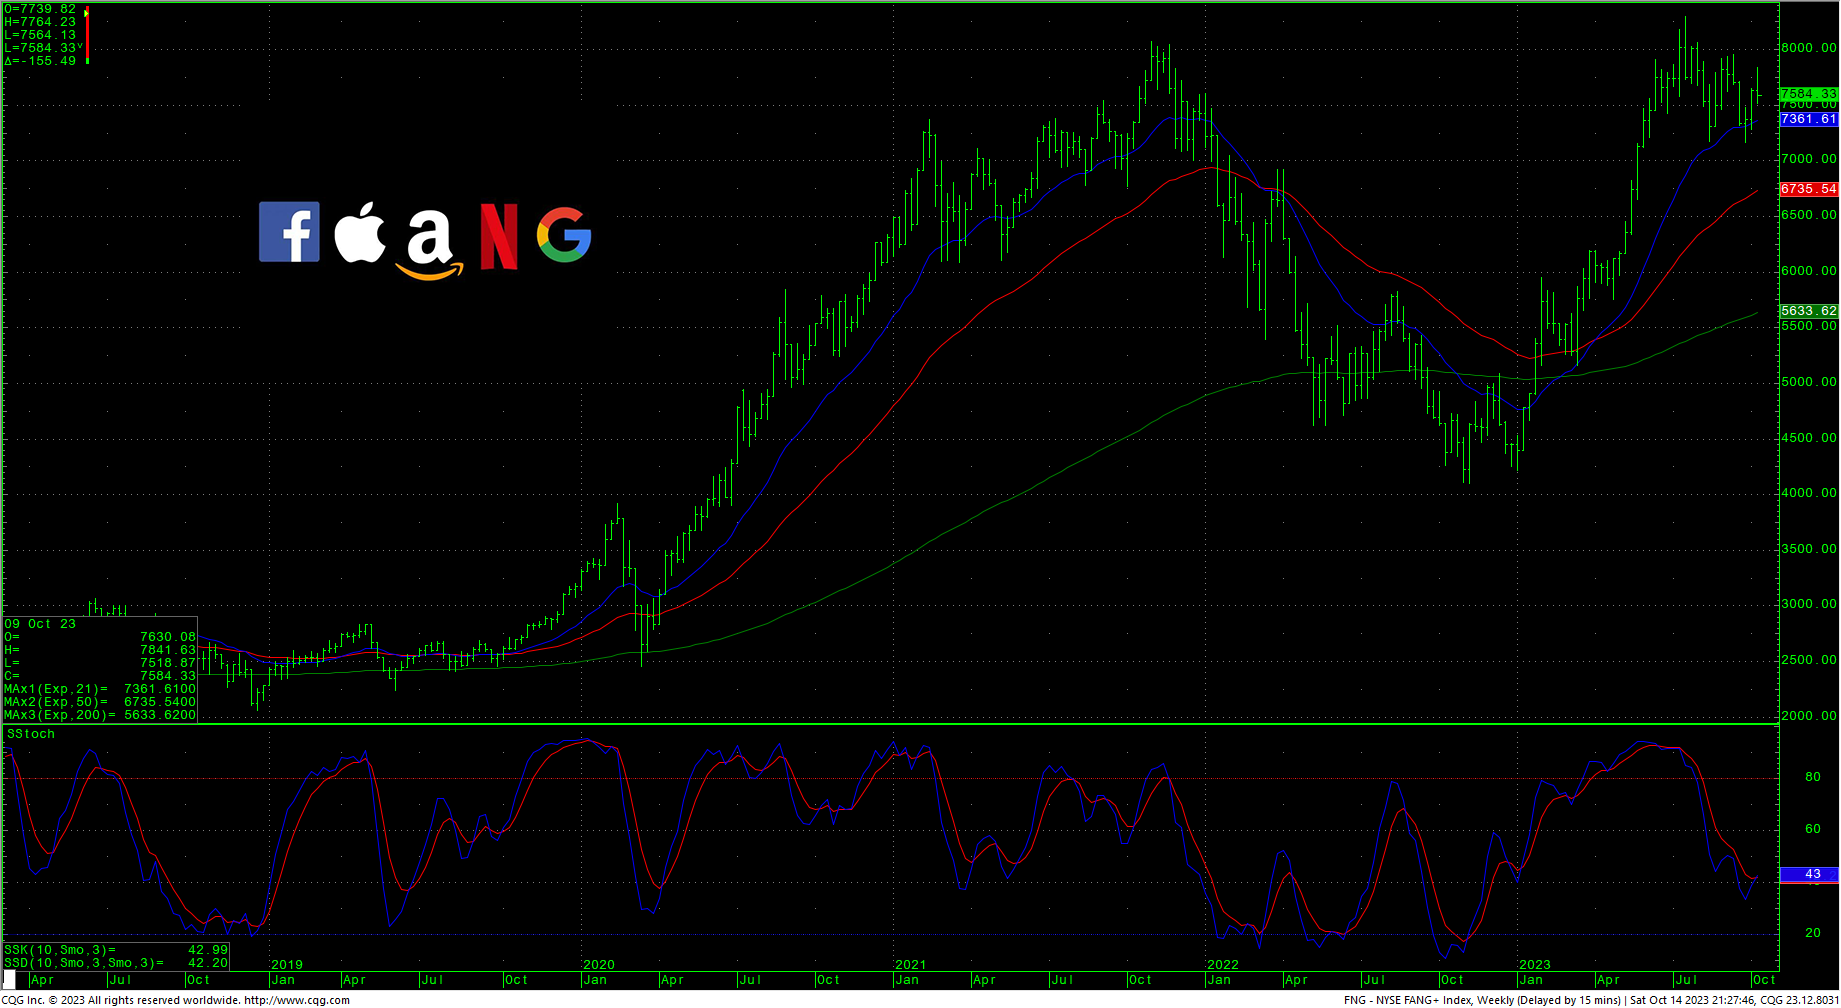
The daily charts have relieved some of the deeply oversold conditions and the hourlies are completely neutral heading into next week’s trade. Sentiment remains in FEAR with last week’s trade. Although, the AAII Sentiment Index hit a 5-week high for optimistic sentiment last week. The VIX however, traded a weekly upside reversal as it retested five month highs. The 52-week, A/D is now down to -5.91% which is a new low for 2023 and the lowest since November of 2022…indicating extreme fear. The Put/Call ratio sits at 0.94, another fear reading. The Dow closed the week up +0.79%. The S&P was up +0.45%. The Nasdaq ended the week down -0.18%, the FANG closed down -0.60% with the Russell down -1.48% , as that market is trading into the 2023 lows. Bonds spent the week higher and closed toward the upper end of the weeks range. The daily has worked off some of the deeply oversold condition and the weekly remains severely oversold. The nearby 30-year futures are testing monthly support in the 109232/108014 area.The CRB was up sharply, closing up +2.66% as crude oil rallied and gold soared. The Commitment of Traders CoT remains completely neutral.Asset managers have been doing some modest liquidation while the other major players are frozen in place.
Timing Points
- 10/19 **
- 10/22 **
- 11/02-03 *** X
CNN Fear & Greed Index
AAII Investor Sentiment Survey
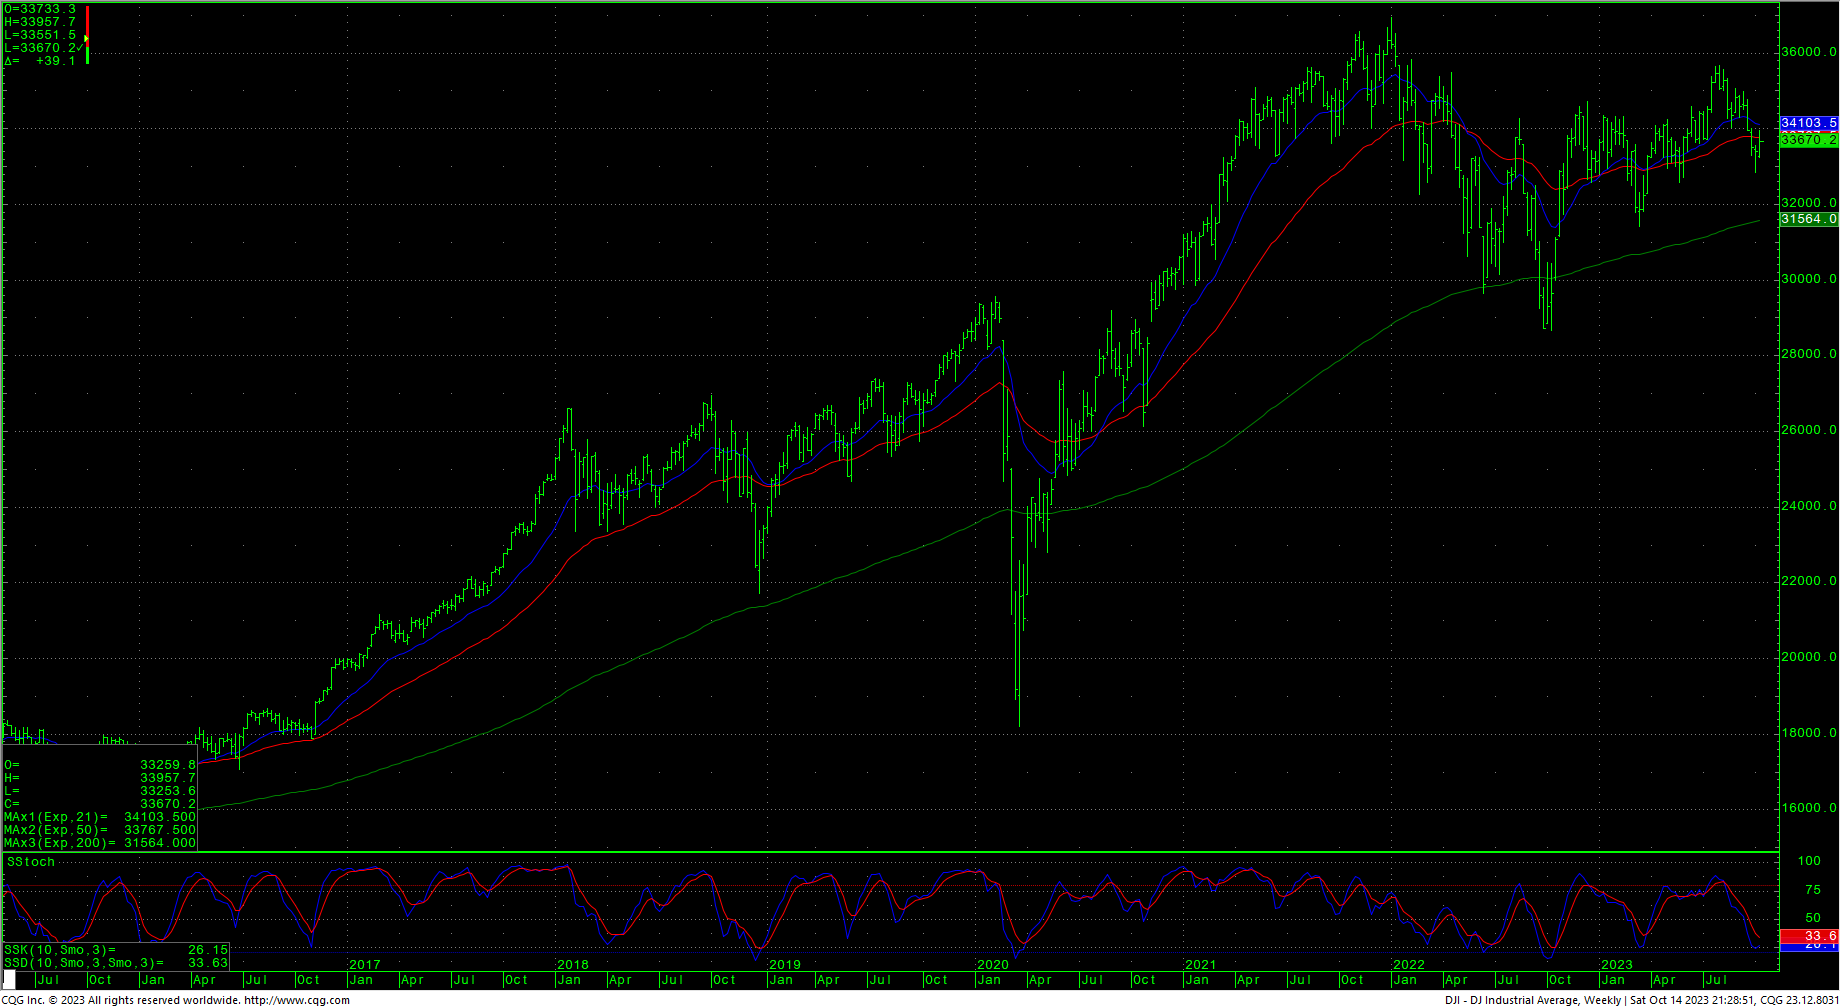
Dow Jones Industrial Average Hourly HLC
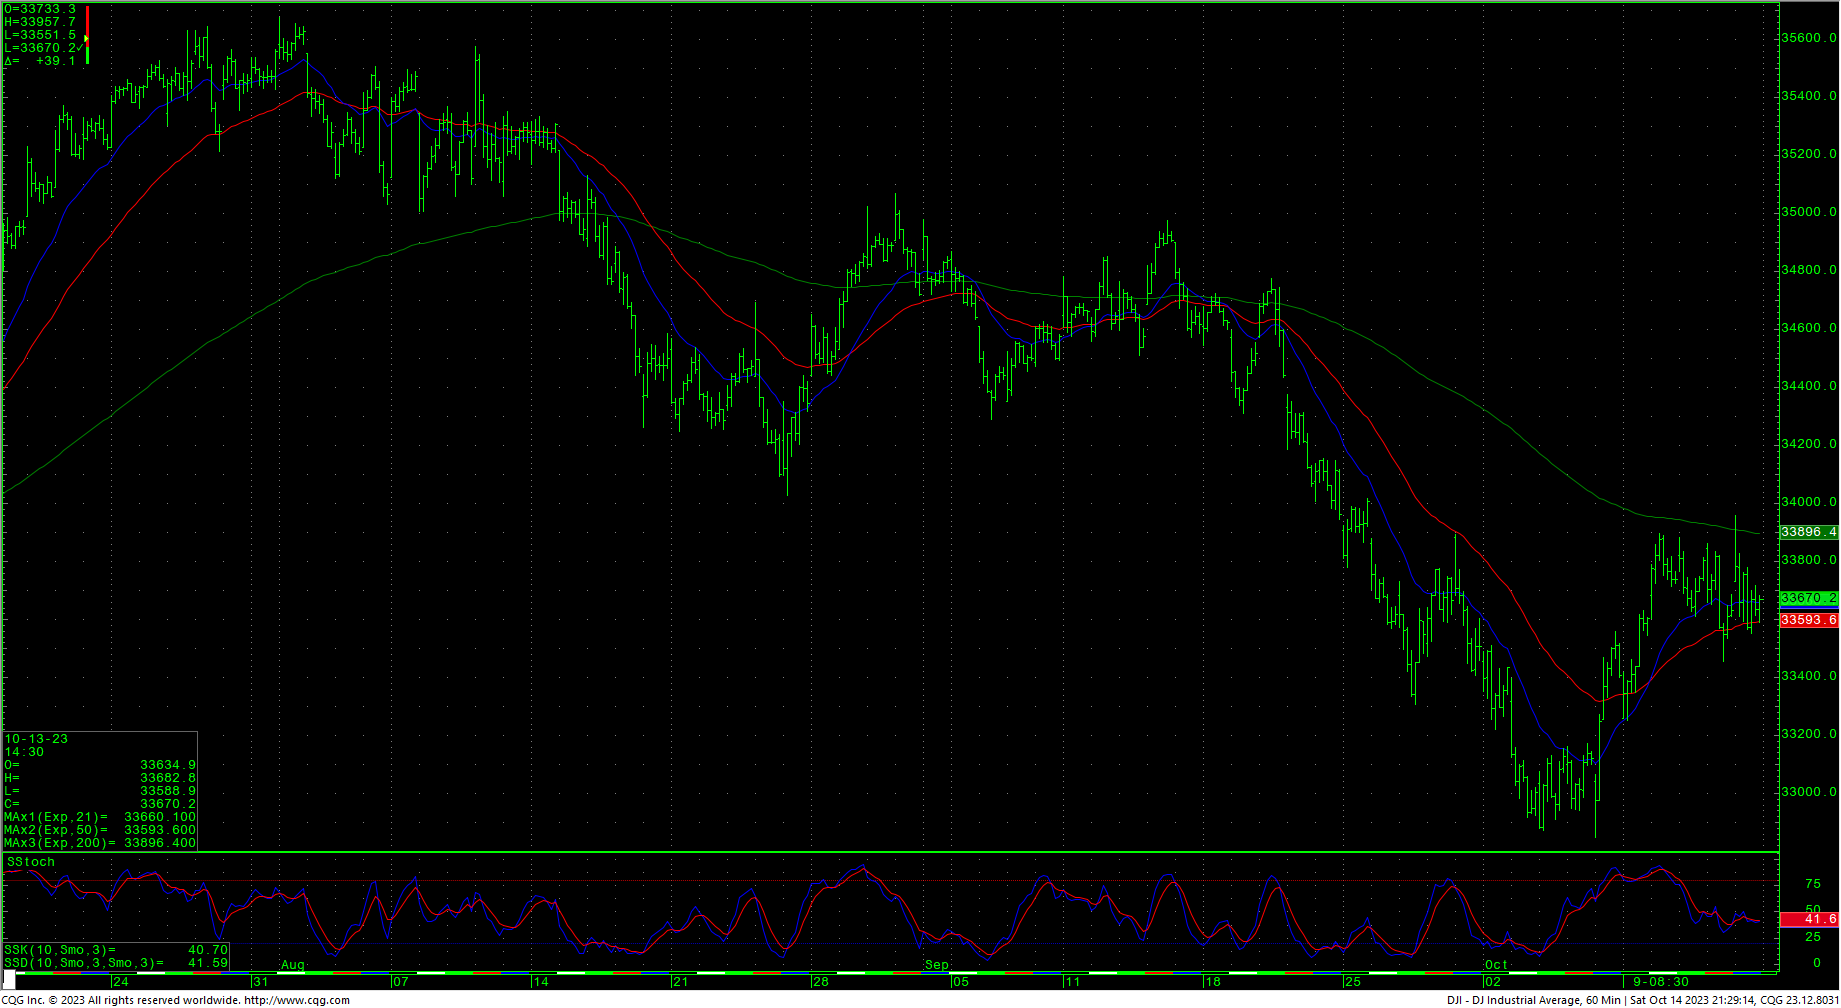 The Dow hourly is completely neutral as of Friday’s close. Last week’s action leaves most of the intermediate-term numbers the same. Short-term, support is pivotal at 33271/33265 and breaking that area should lead to a retest of critical intermediate-term support against 33053/33045 through 32998. A breakdown with daily closes below 32998 can test 32731 with support at 32586 through 32492. Support is key long-term at 32170 and a close under that area is bearish with counts into the 31341/31330 level. Closes under 31330 in the Dow will open potential to 29806 through 28660.
Resistance is still pivotal directly overhead at 33696/33700. Closes over 33700 are near-term friendly for a retest of 33958 with potential to 34220/34263. A breakout above 34263 should minimally test 34597/34605. Daily closes over 34605 suggest a test of 35010 with counts to 35070. Closes above 35070 setup a test of the trading highs at 35679 with intermediate counts to 35824 and longer-term counts into a gap area on the daily at 35996 to 36044.
Dow Jones Industrial Average Weekly HLC
Support
- 33533 **
- 33402 ***
- 33305 **
- 33271/33265 *** ↓
- 33118/33113 *** ↓
- 33053/33045 *** ↓
- 32998 *** ↓
- 32846 *** ↓
- 32764 *** ↓
- 32731 **
- 32586 *** ↓
- 32492 *** ↓
- 32432 ** ↓
- 32276 **
- 32170 *** ↓
- 32020 **
- 31805 *** ↓
Resistance
- 33696/33700 *** ↑
- 33958 ***
- 34110 **
- 34220 *** ↑
- 34263 *** ↑
- 34378 ** gap
- 34434 ** fills gap
- 34597/34605 *** ↑
- 34776 ** ↑
- 34900 **
- 35010 *** ↑
- 35070 *** ↑
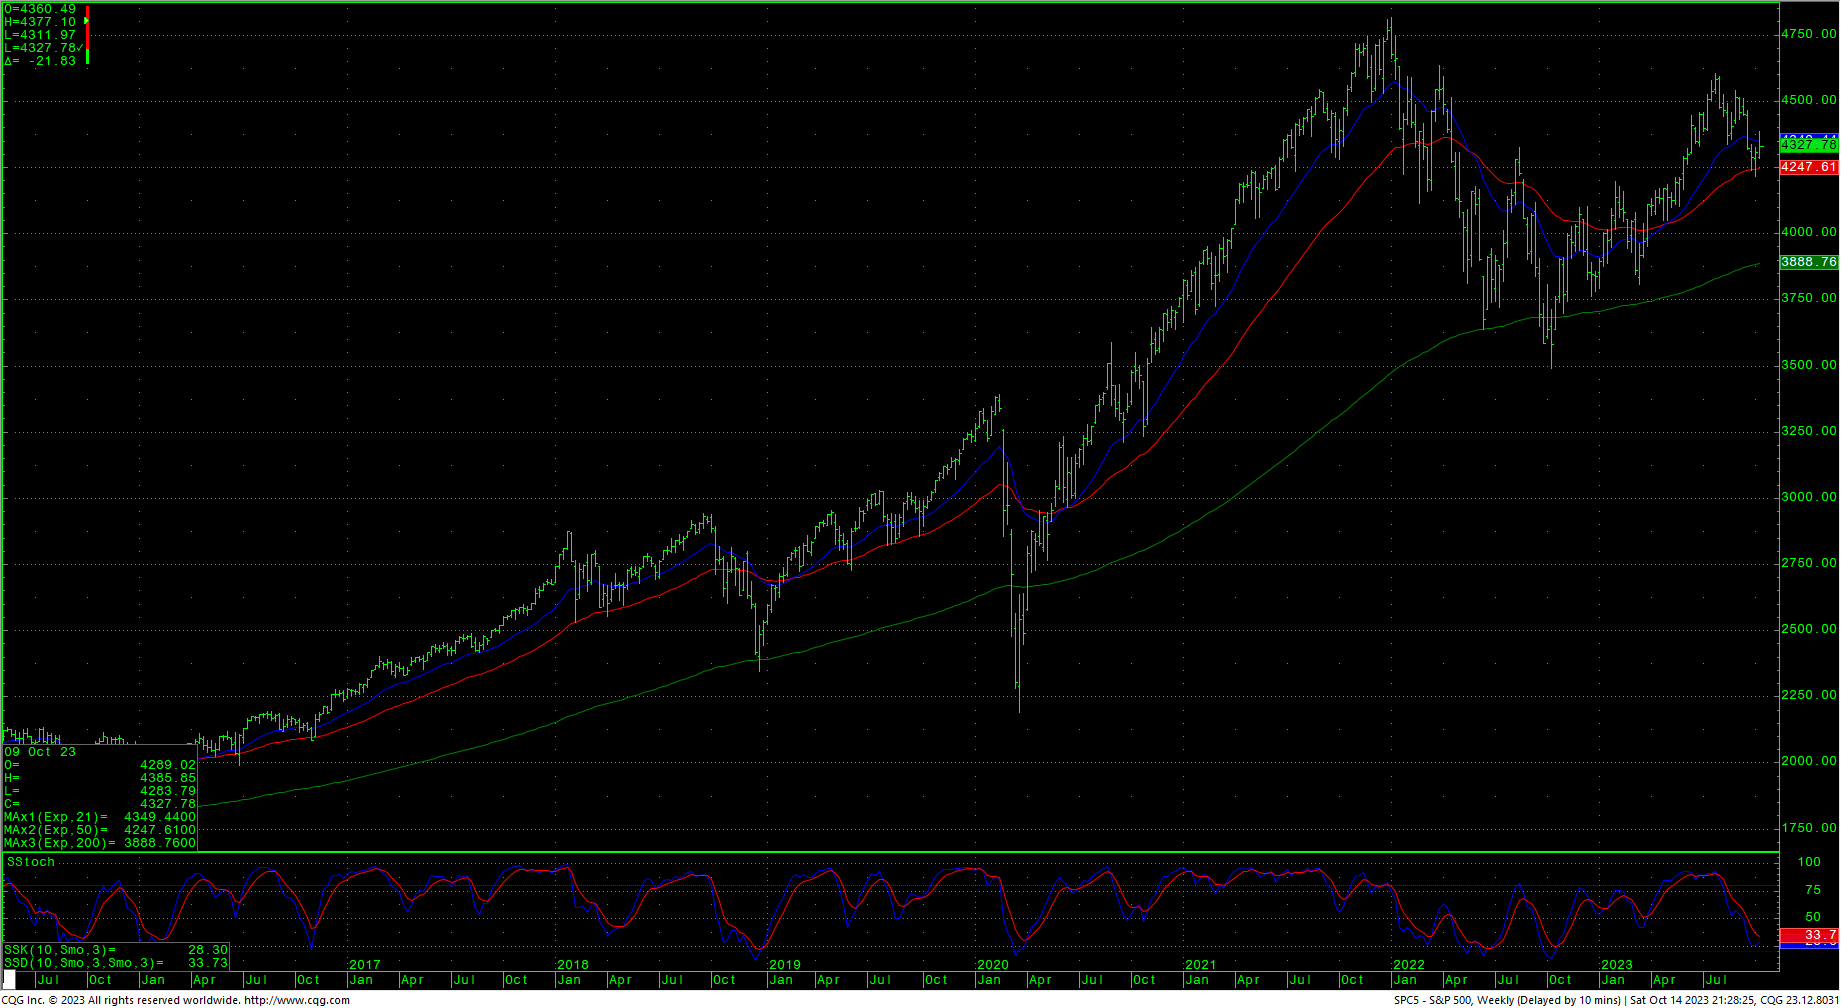
S&P 500 Cash Index
The S&P hourly is neutral to slightly oversold with Friday’s close. As with the Dow, last week’s trade leaves most of the intermediate-term numbers the same. Support is 4301 and 4281/4278 with critical intermediate-term support at 4262/4255. Daily closes under 4255 open counts to 4049 and critical long-term support of 3917/3910. Daily closes below 3910 open counts to 3754/3750 with potential to monthly support at 3503/3491.
Resistance remains at 4365, 4379, 4412/4417 and 4457/4460. A drive over 4460 should minimally test pivotal hourly resistance at 4509/4515. A breakout over 4515 is friendly and sets up a move to 4607. Closes above suggest a minimal test of 4637. A breakout with closes above 4637 opens potential toward 4748 and ultimately 4818. Above the record highs opens counts to 4952/5000 with potential to 5144.
S&P 500 Index Weekly HLC
Support
- 4321 **
- 4301 ***
- 4281/4278 *** ↓
- 4262/4255 *** ↓
- 4216 ** ↓
- 4180/4177 *** ↓
- 4049 *** ↓
- 3917/3910 *** ↓
- 3875 **
- 3754/3750 *** ↓
- 3625 **
- 3500/3491 *** ↓
Resistance
- 4365 **
- 4377/4379 ** gap
- 4385 ** ↑
- 4401 ** fills gap
- 4412/4417 *** ↑
- 4455/4460 ** ↑
- 4509/4515 *** ↑
- 4527 **
- 4541 **
- 4550 **
- 4575 *** ↑
- 4593 **
- 4607 *** ↑

