
TECHNICAL ANALYSIS (by Intraday Dynamics)
Major Indices Week of December 15, 2023

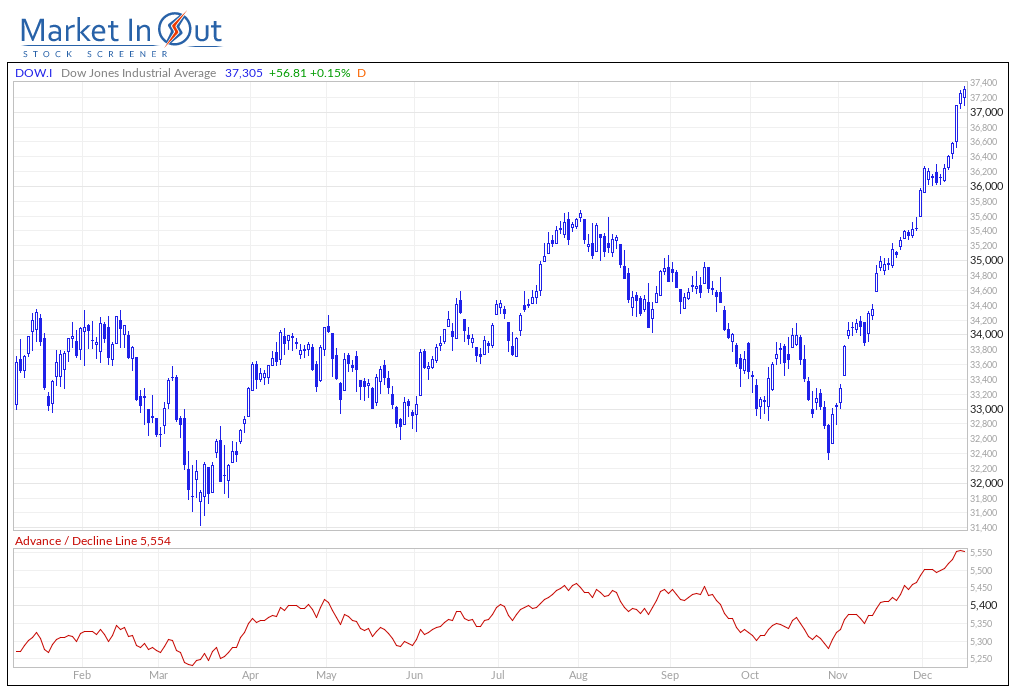
 Stocks surged higher last week with the Dow hitting all-time record highs, and most major indices setting the seventh up week in a row…for the biggest steady run in six years. The Sun also emitted the strongest solar flare in six years last week. The markets are climbing a wall of worry with the CoT showing very little participation in the rally. The number of gaps on the impulse move, the new highs for the Dow, the monthly stochastics hooking higher…all open up much higher upside objectives for price. Attention needs to be paid to the hourly now. A case can be built for a five wave move on the hourly, and it is overbought and flashing a preliminary bearish divergence. That said, Friday’s close is still short of upside targets. The reality is that the market may well still be in the very beginning of this move. Prices hit record highs in the week with very little fanfare and, instead, saw a mish-mosh of anemic explaining, Fed blah-blah-blah and CNBC talking heads looking like they were sucking on lemons. The psychology fits neatly with impulsive price action, indicating that we have not reached the FOMO stage yet. New highs for the S&P 500 will likely kick in the type of sentiment that fuels FOMO. The bottom line is that, until price and time dictate differently, it is better to just stick with “Speed” and ignore Chicken Little.
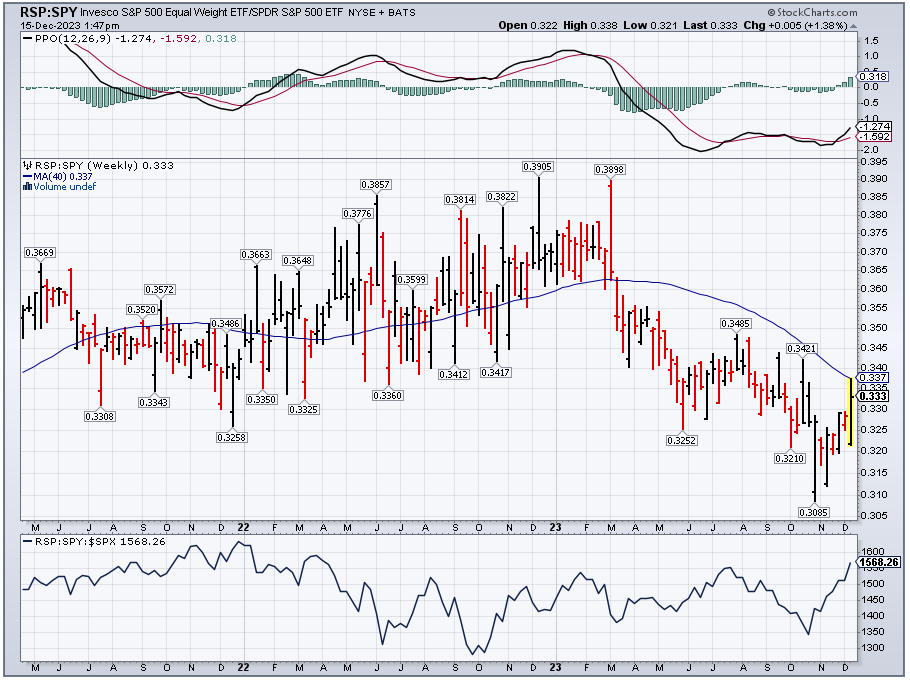
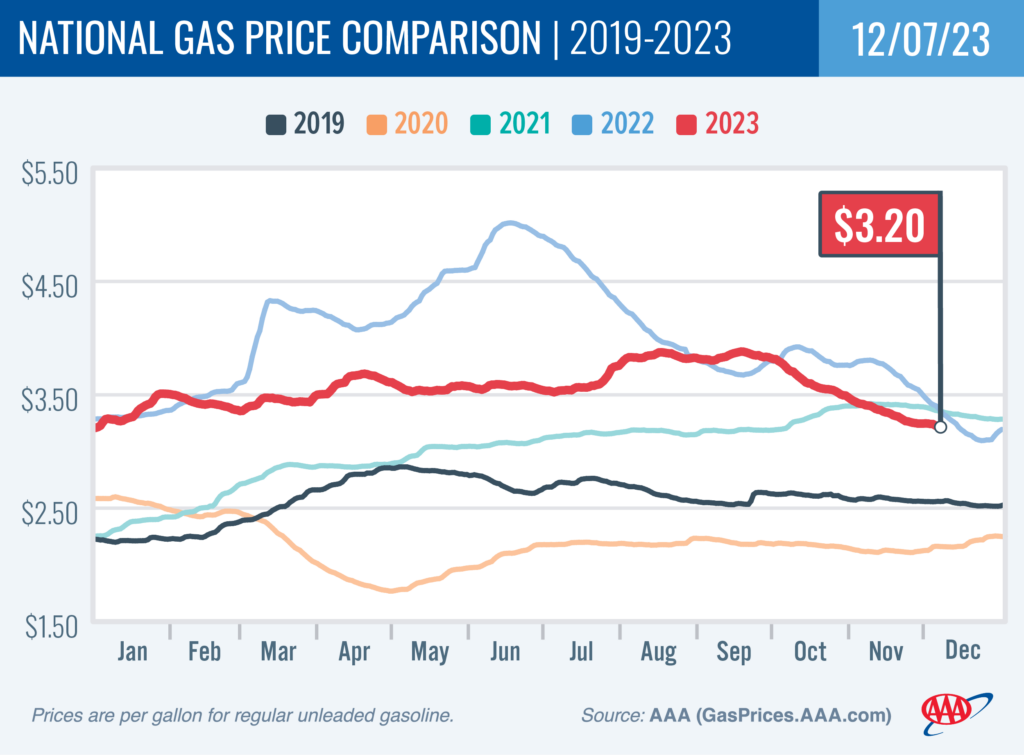
Sentiment is getting frothy and the 52-week A/D is showing some extreme greed (hitting 5554 last week). However, readings like these can stay pegged in a genuine impulse move. On the week, the secondary market continued to gain on large caps and we continue to believe that this chart has room to run as it comes off some extreme lows set this past fall. Gas prices also hit new 2023 lows last week.
RSP/SPY Weekly
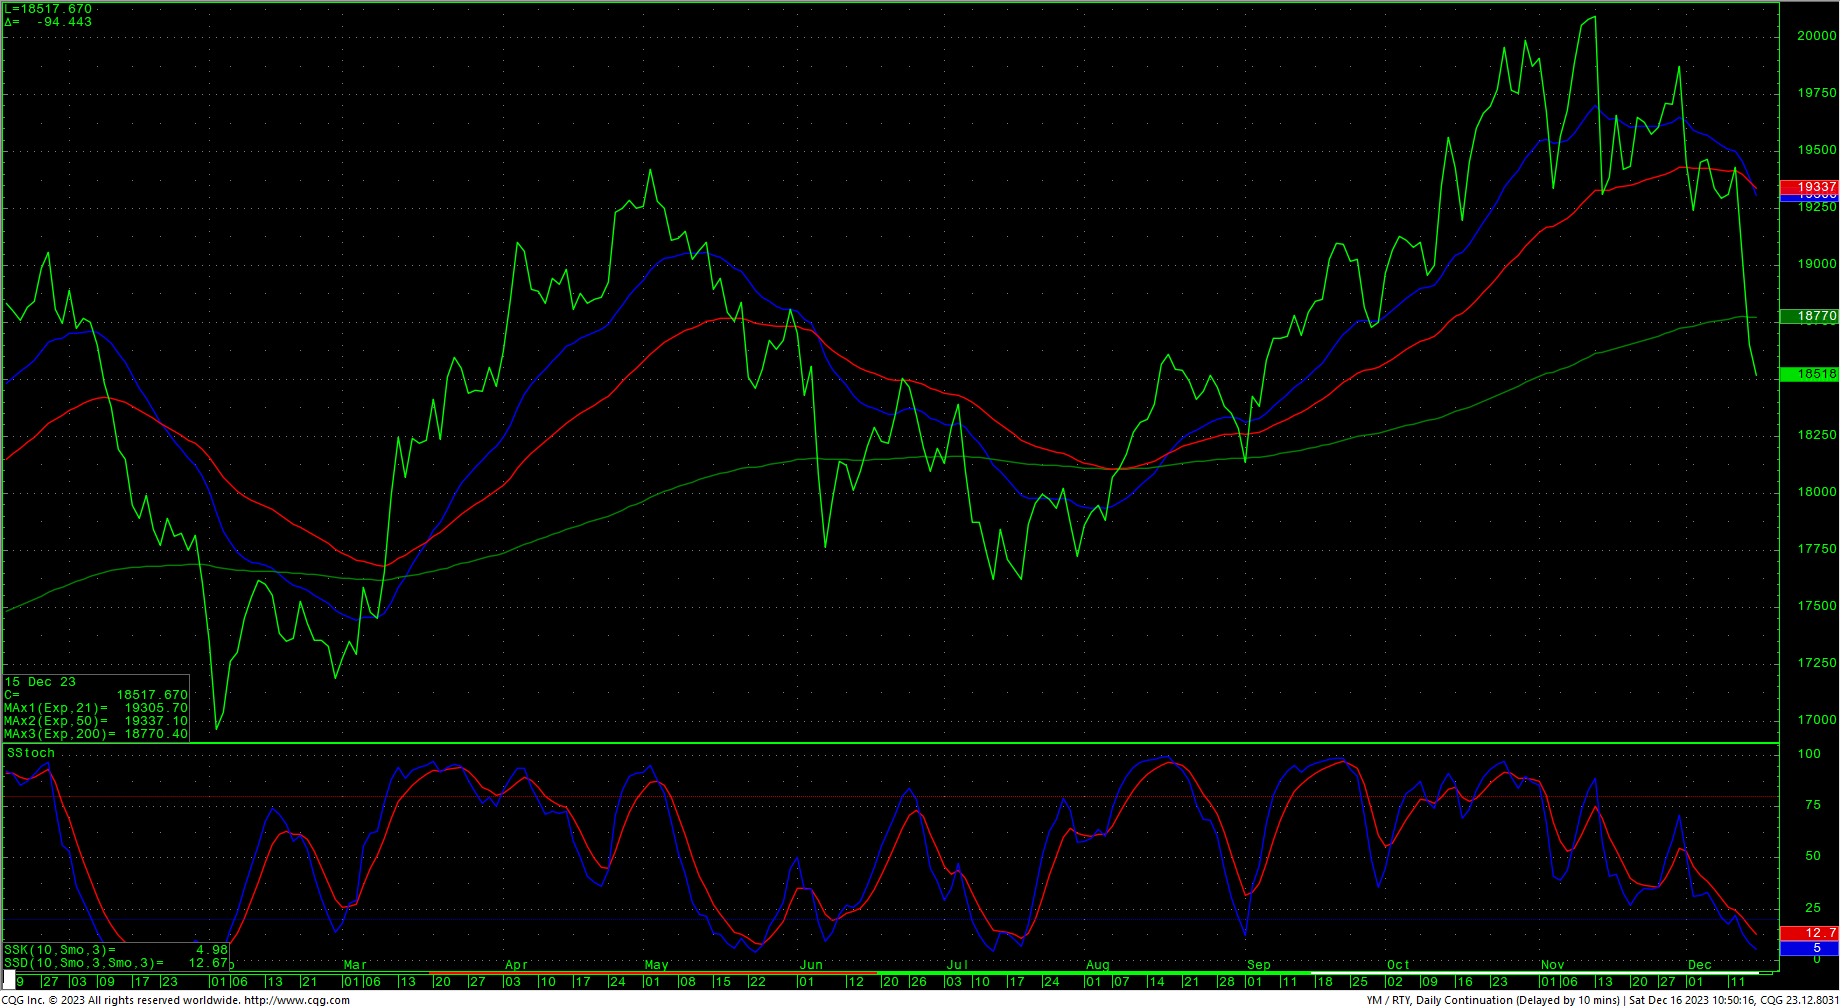
 Spot Dow Futures/Russell 2000 Futures Daily Ratio
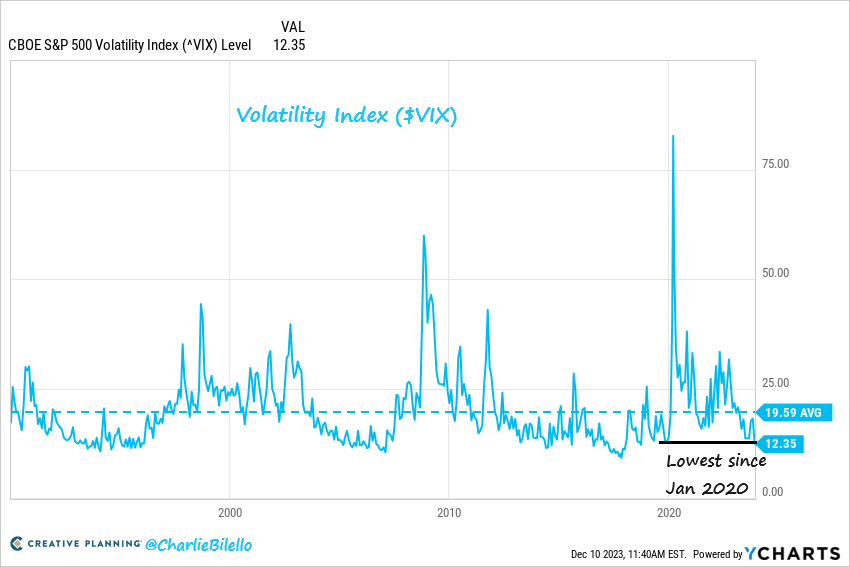
 The VIX is now at the lowest level since early 2020, just prior to the Covid crash. (Chart from Charlie Bilello)
VIX 1990-Present
 52-Week A/D Line
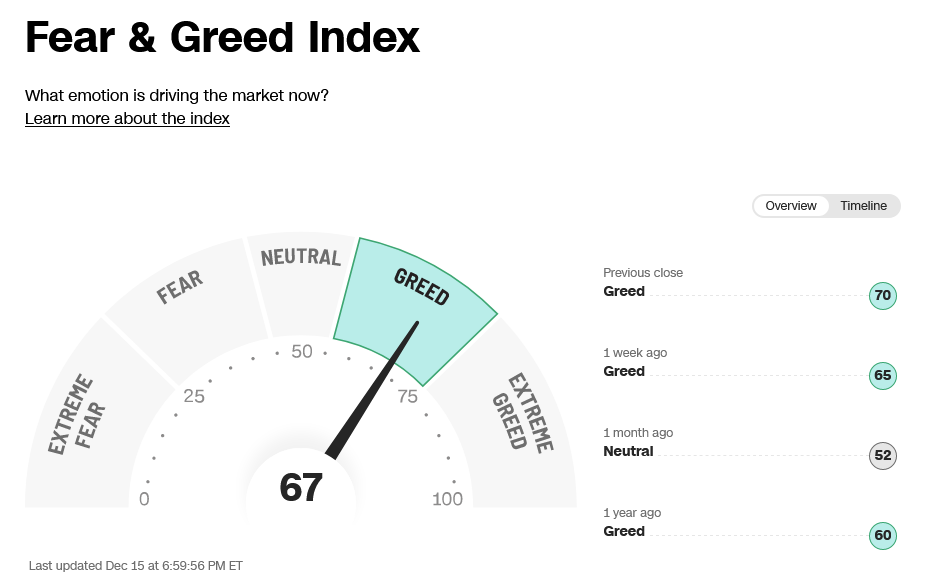
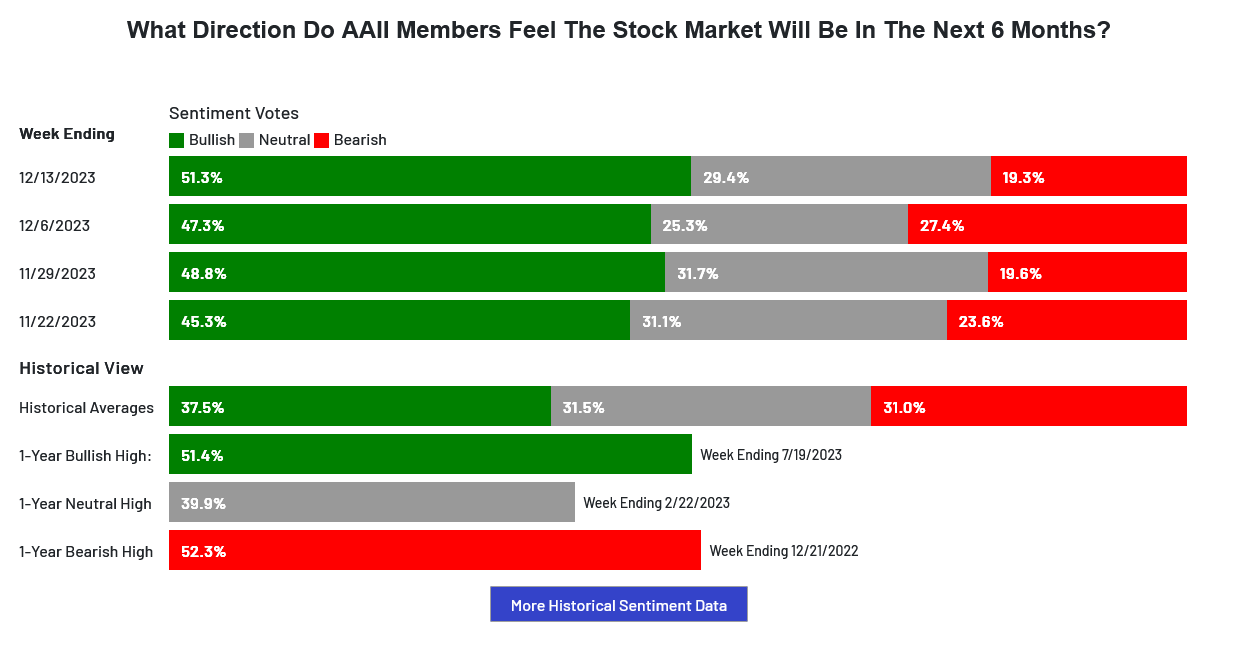
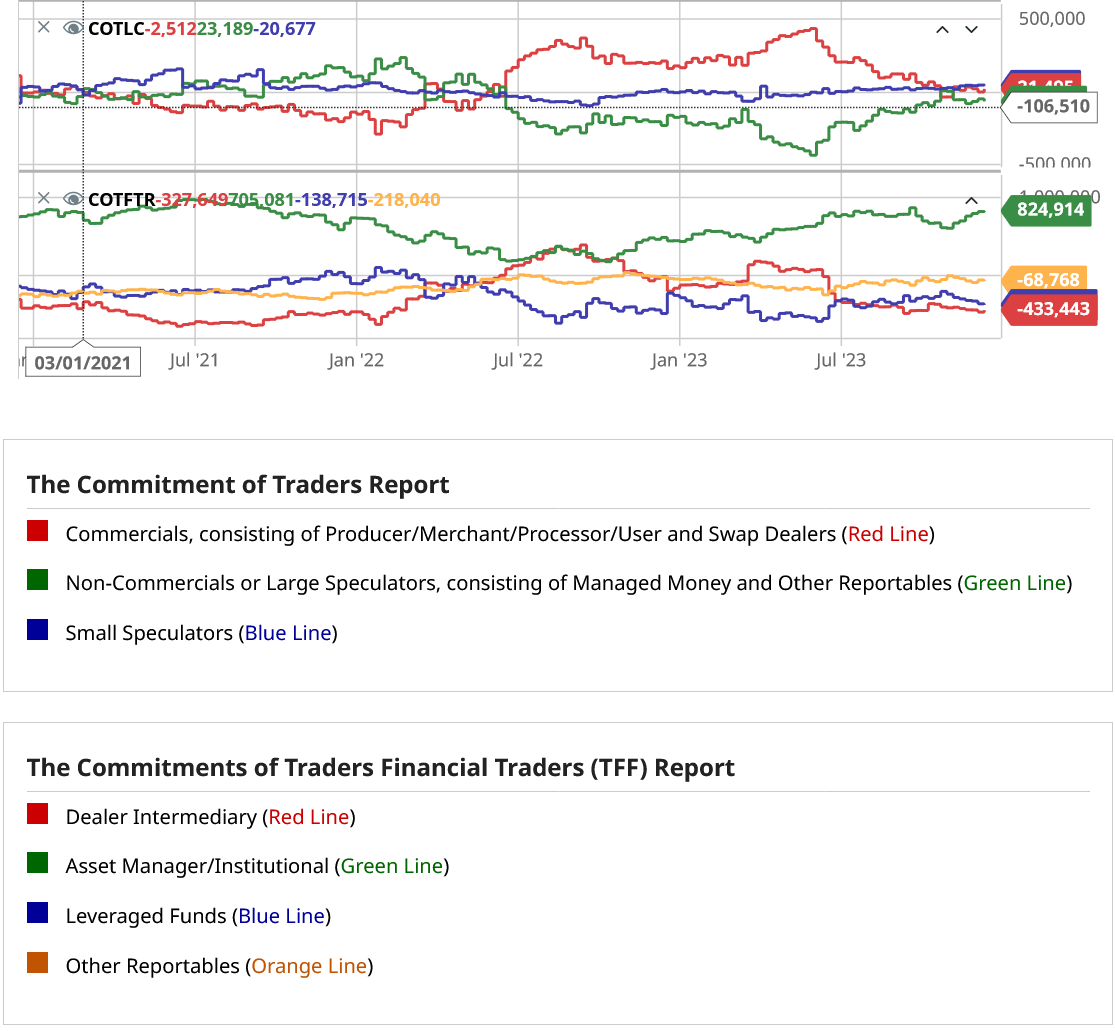
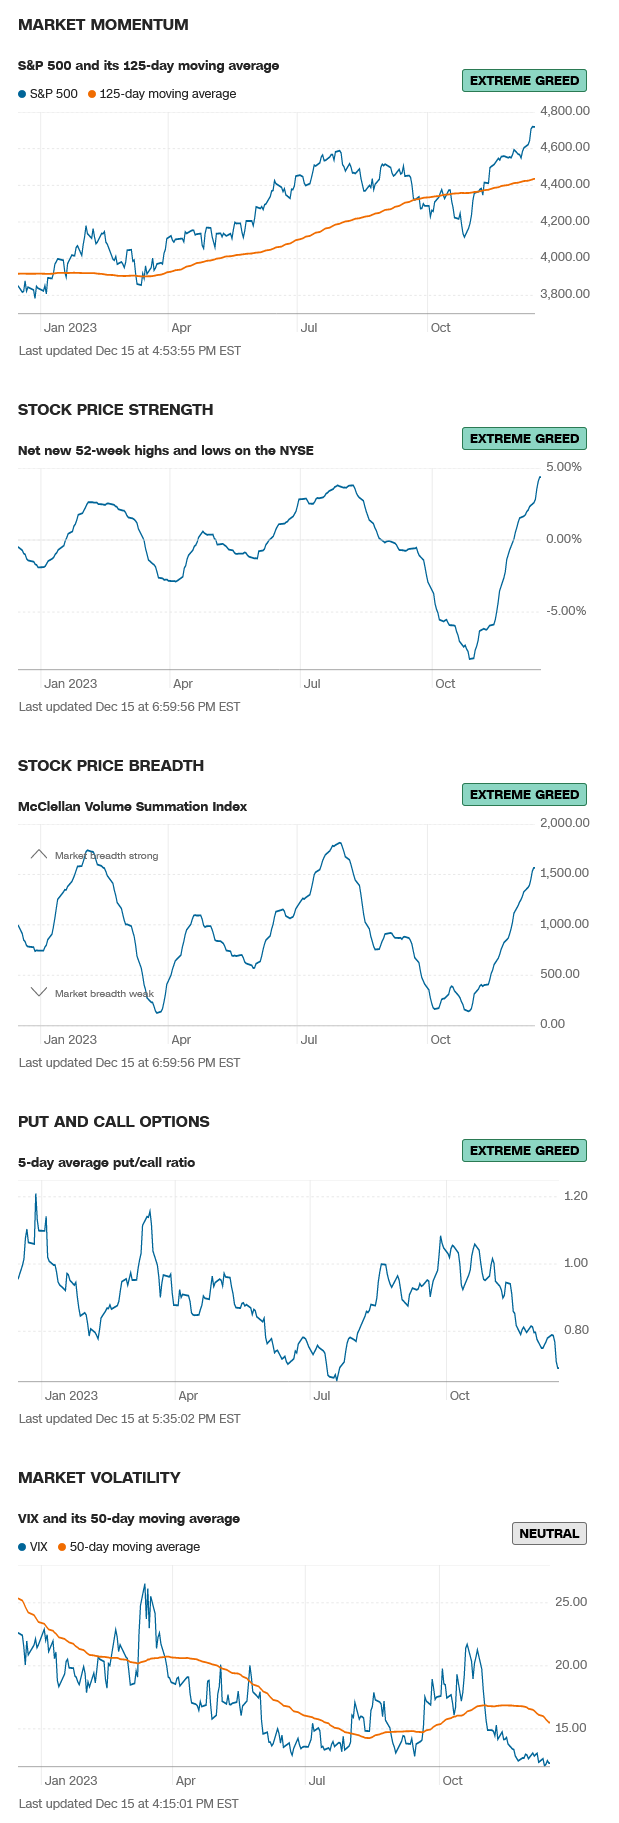
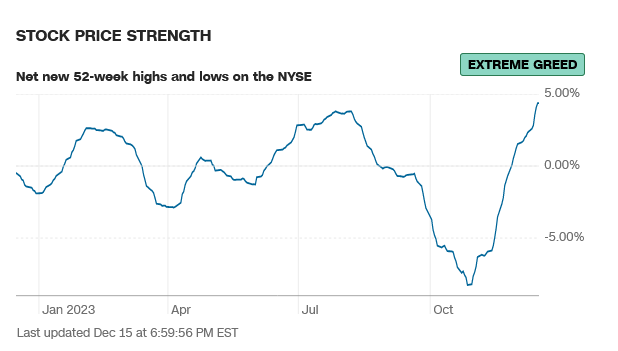
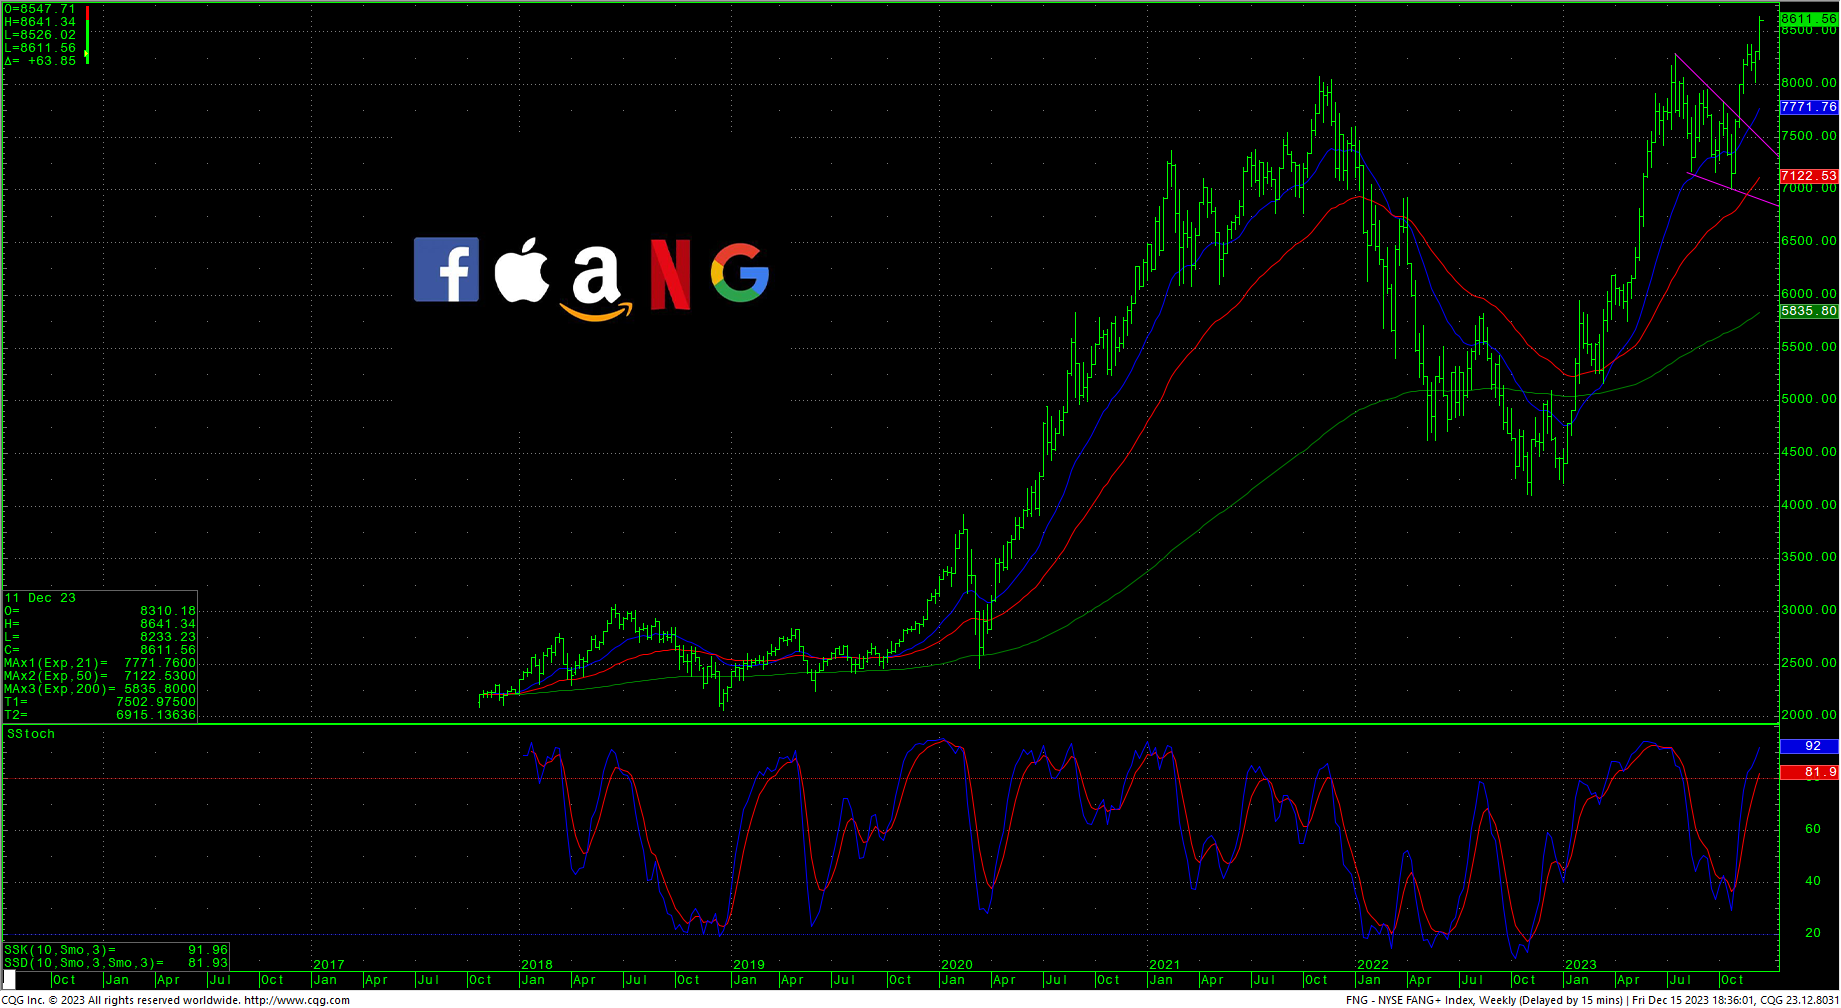
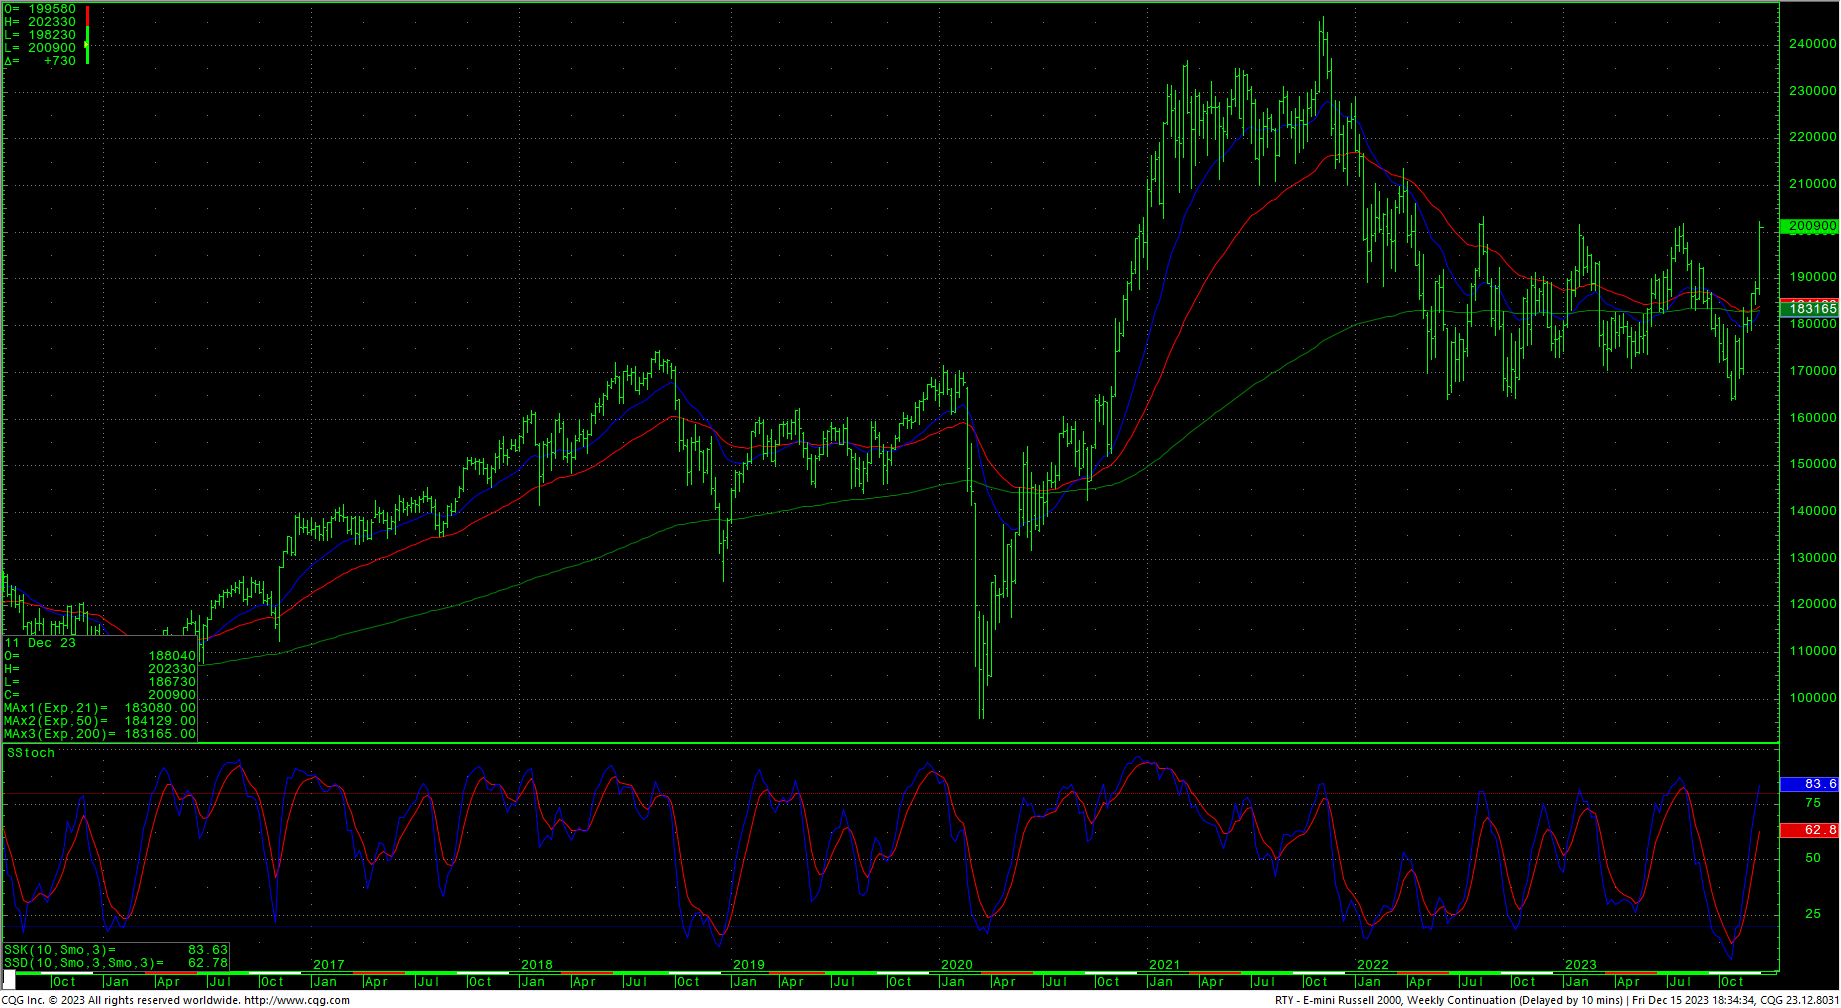
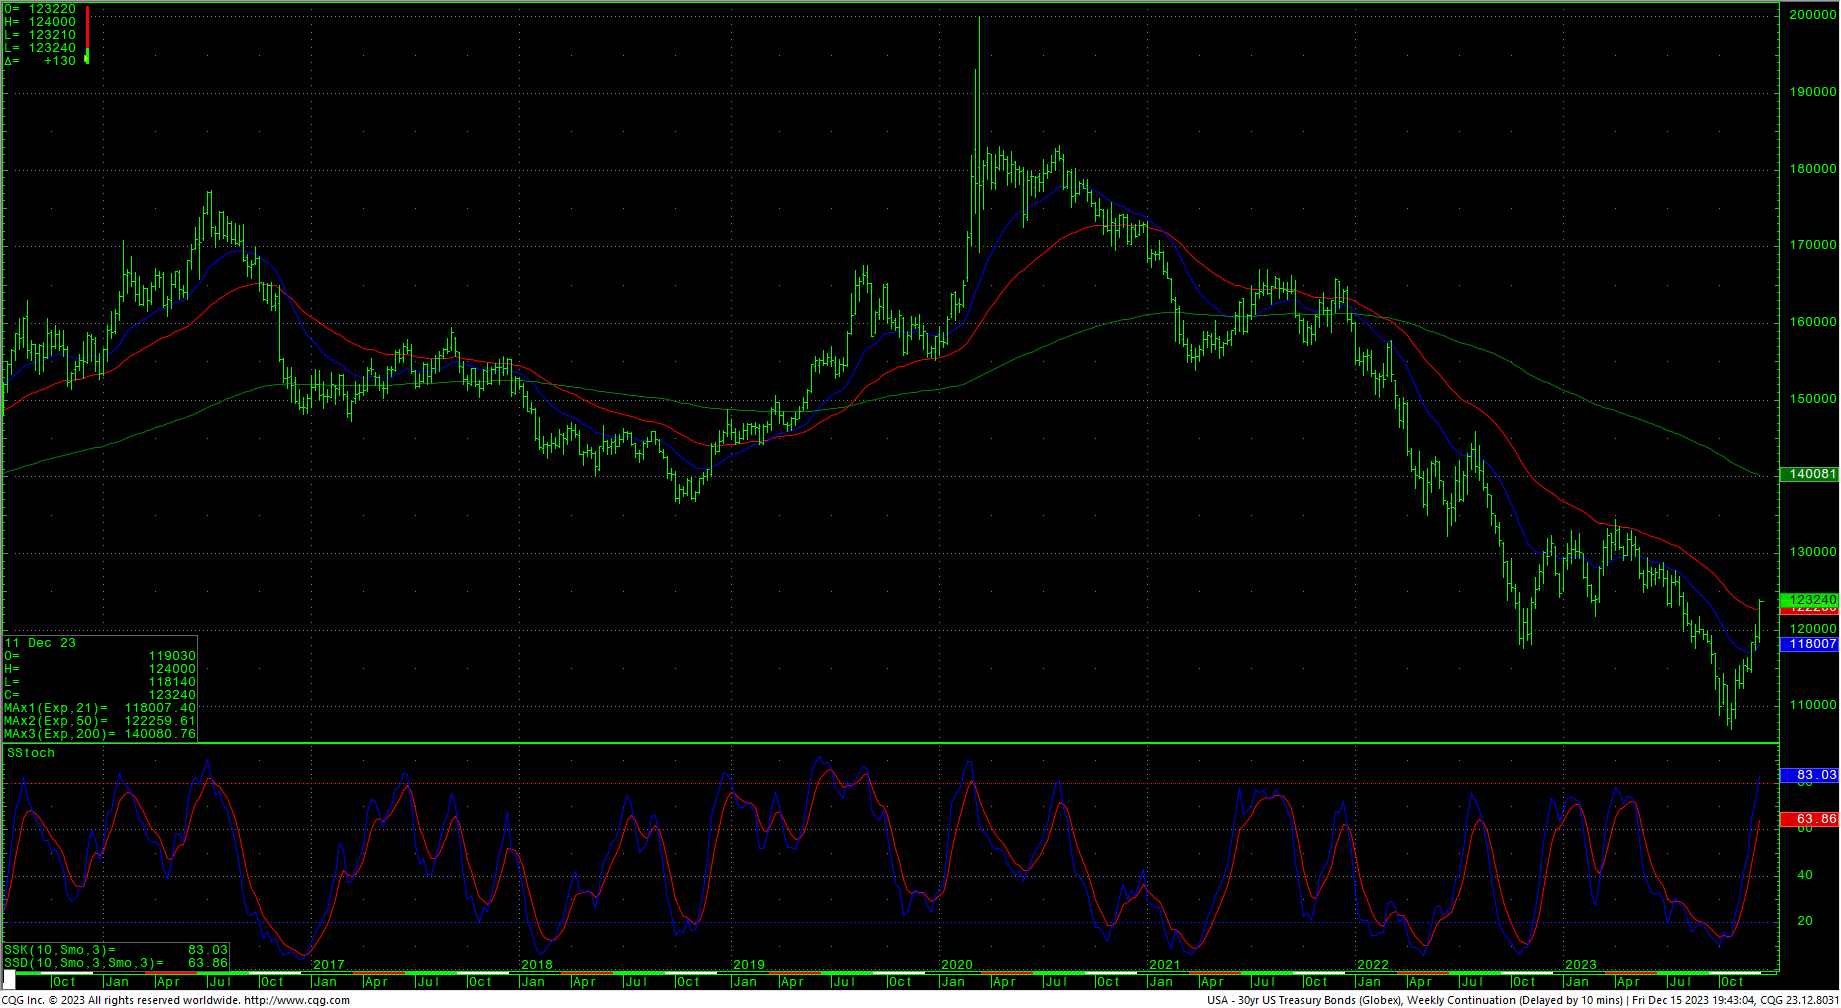
 Sentiment has moved into greed readings. Last week in the AAII, Optimism Rises to Highest Level in Five Months; Pessimism Falls to Lowest Level in Six Years. The VIX moved to the lowest weekly close since January 2020. The Put/Call ratio moved to 0.69 which reflects extreme greed. The 52-week, A/D moved higher to +4.37% which indicates extreme greed. The Dow closed the week up +2.92%. The S&P was up +2.49%. The Nasdaq ended the week up +2.85%, the FANG moved to an all-time record high close up +3.63% and the Russell closed up +5.55%. The bond market continued higher, with the 30-year futures set the highest weekly close since 24 July 2023. The CRB was up +0.6584%…crude oil closed up $0.20, the first higher close in 7 weeks while gold settled slightly higher on the week. The CoT is showing buying coming from asset managers and small speculators now while major players remain on the sidelines.
Timing Points
Tuesday’s timing did not play a major role in last week’s trade. The next critical timing point falls this Wednesday/Thursday on the 20th and 21st.
- 12/20-21 *** X possible extreme
- 12/28 **
- 01/04 **
- 01/08-09 *** X possible extreme
- 01/15 **
- 01/23-24 *** X Key week for financials
CNN Fear & Greed Index
AAII Investor Sentiment Survey
 Dow Jones Industrial Average Hourly HLC
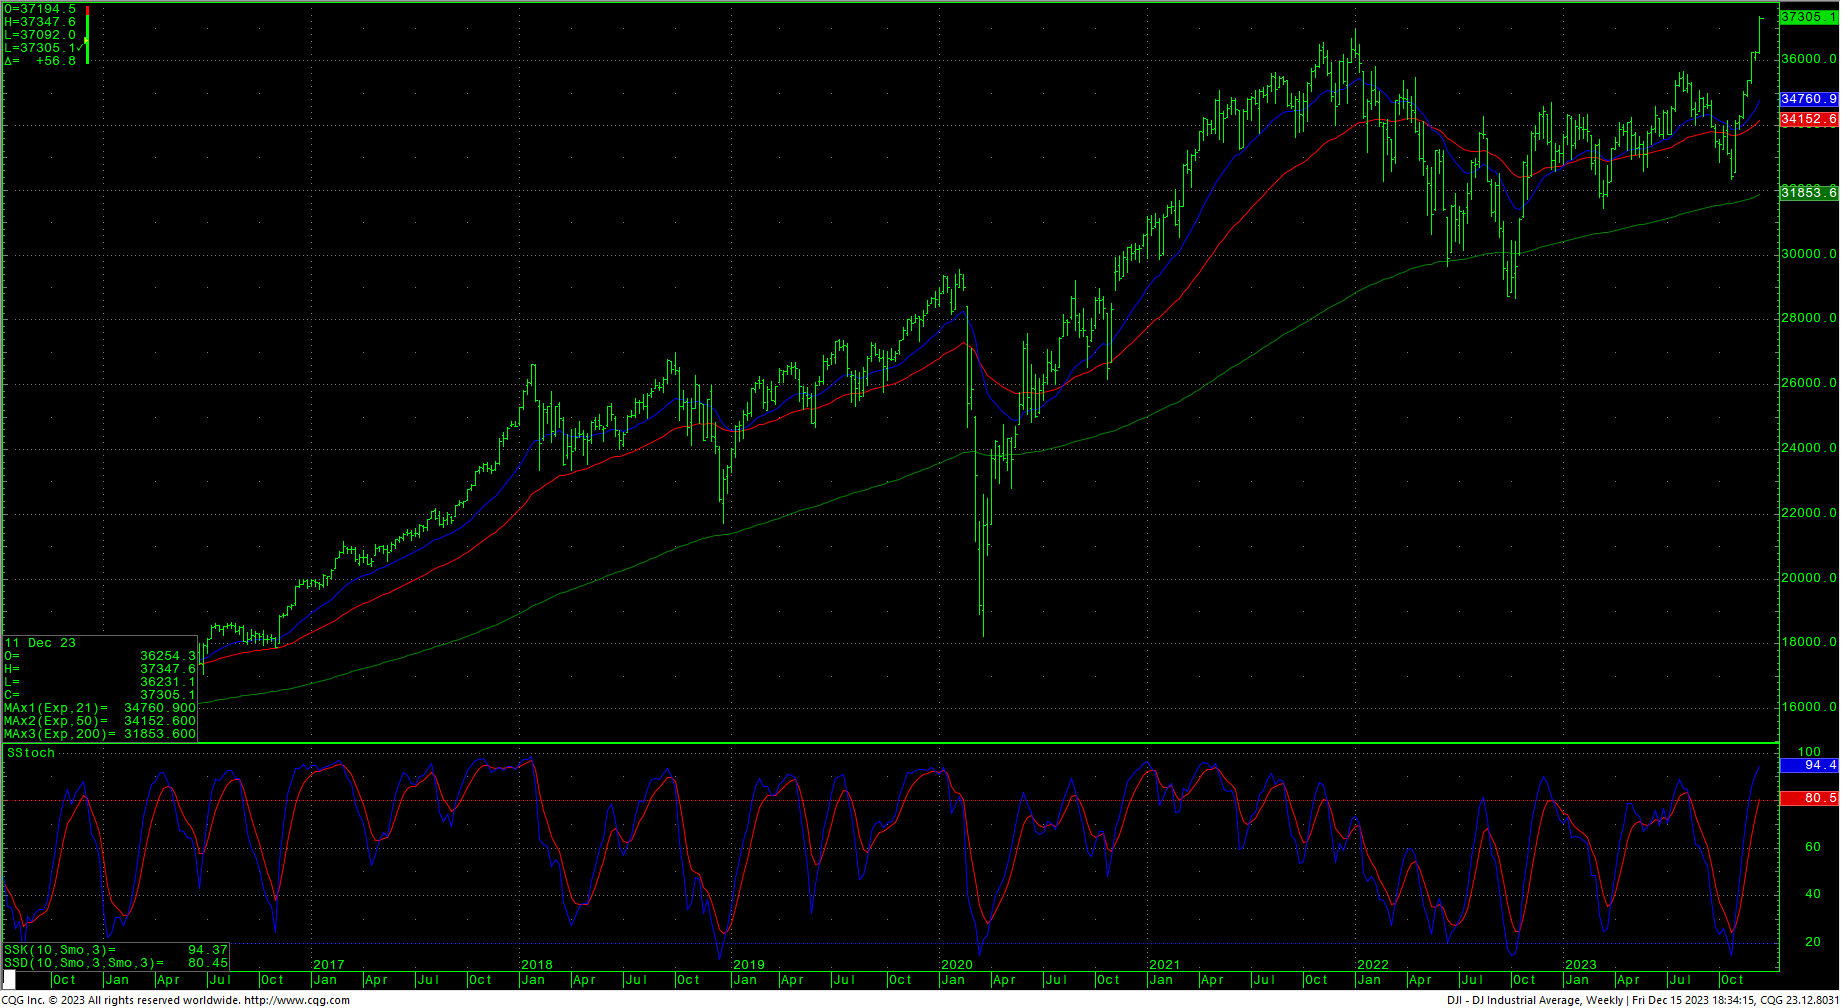
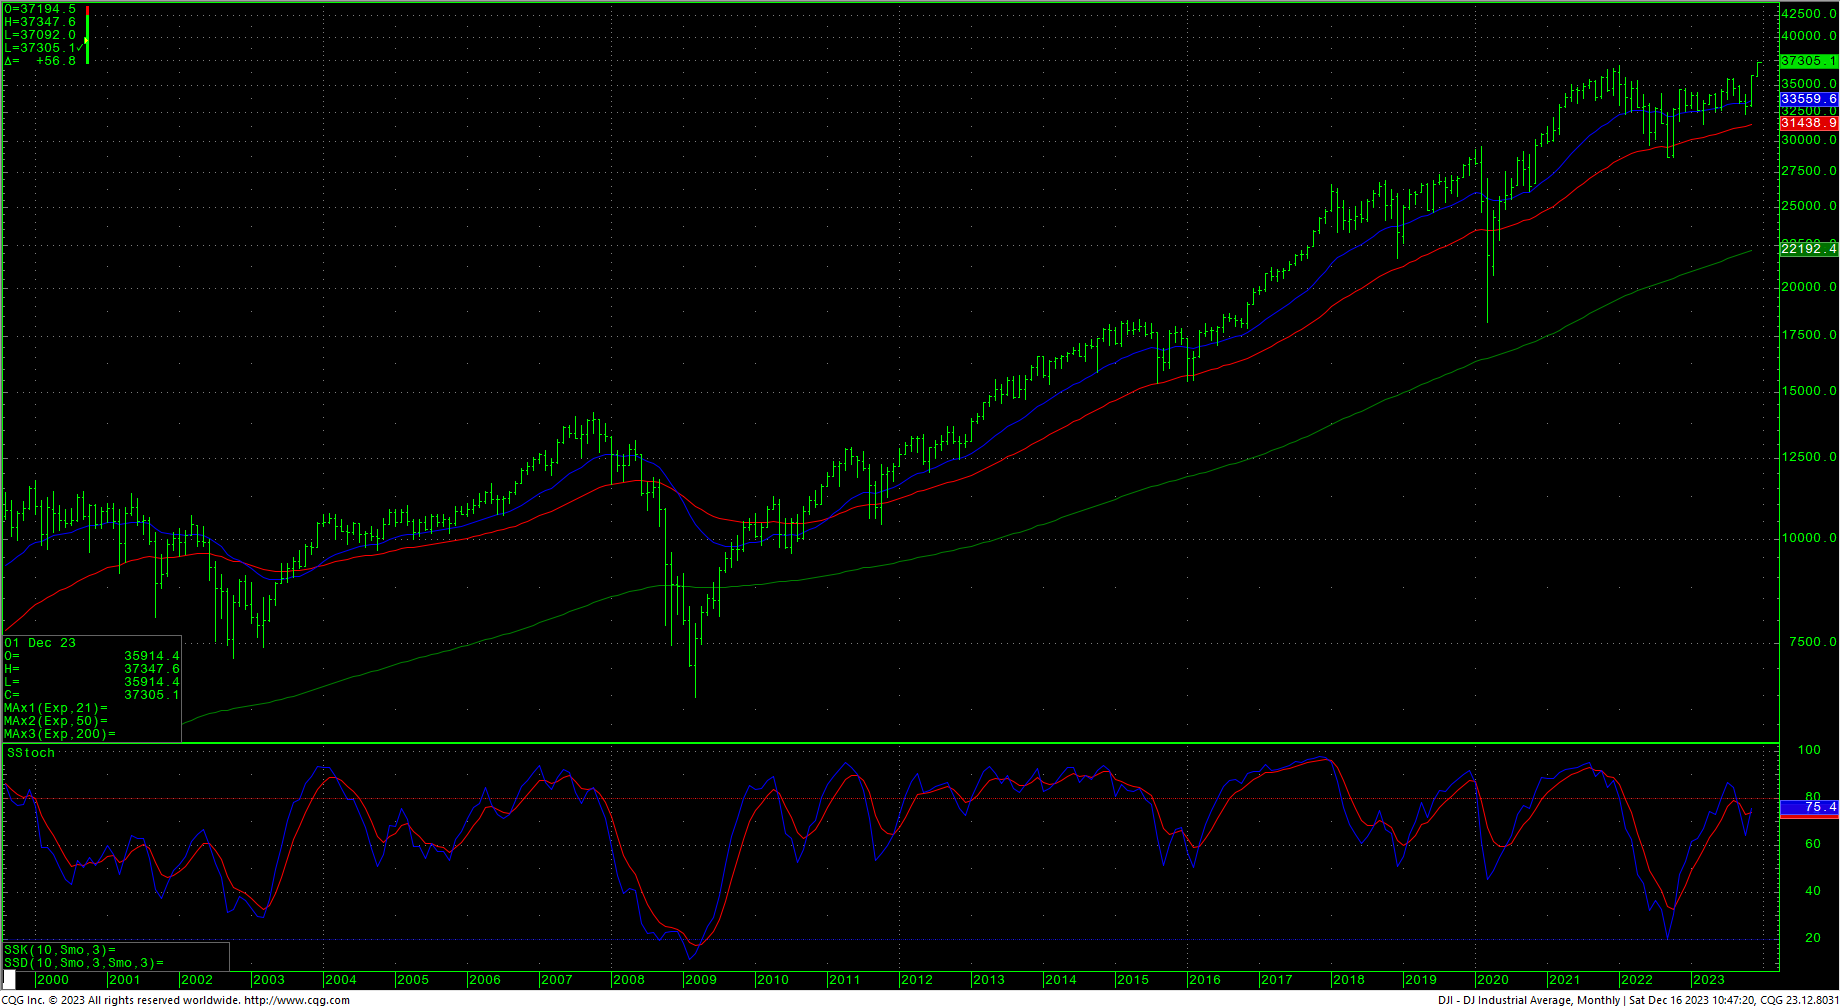
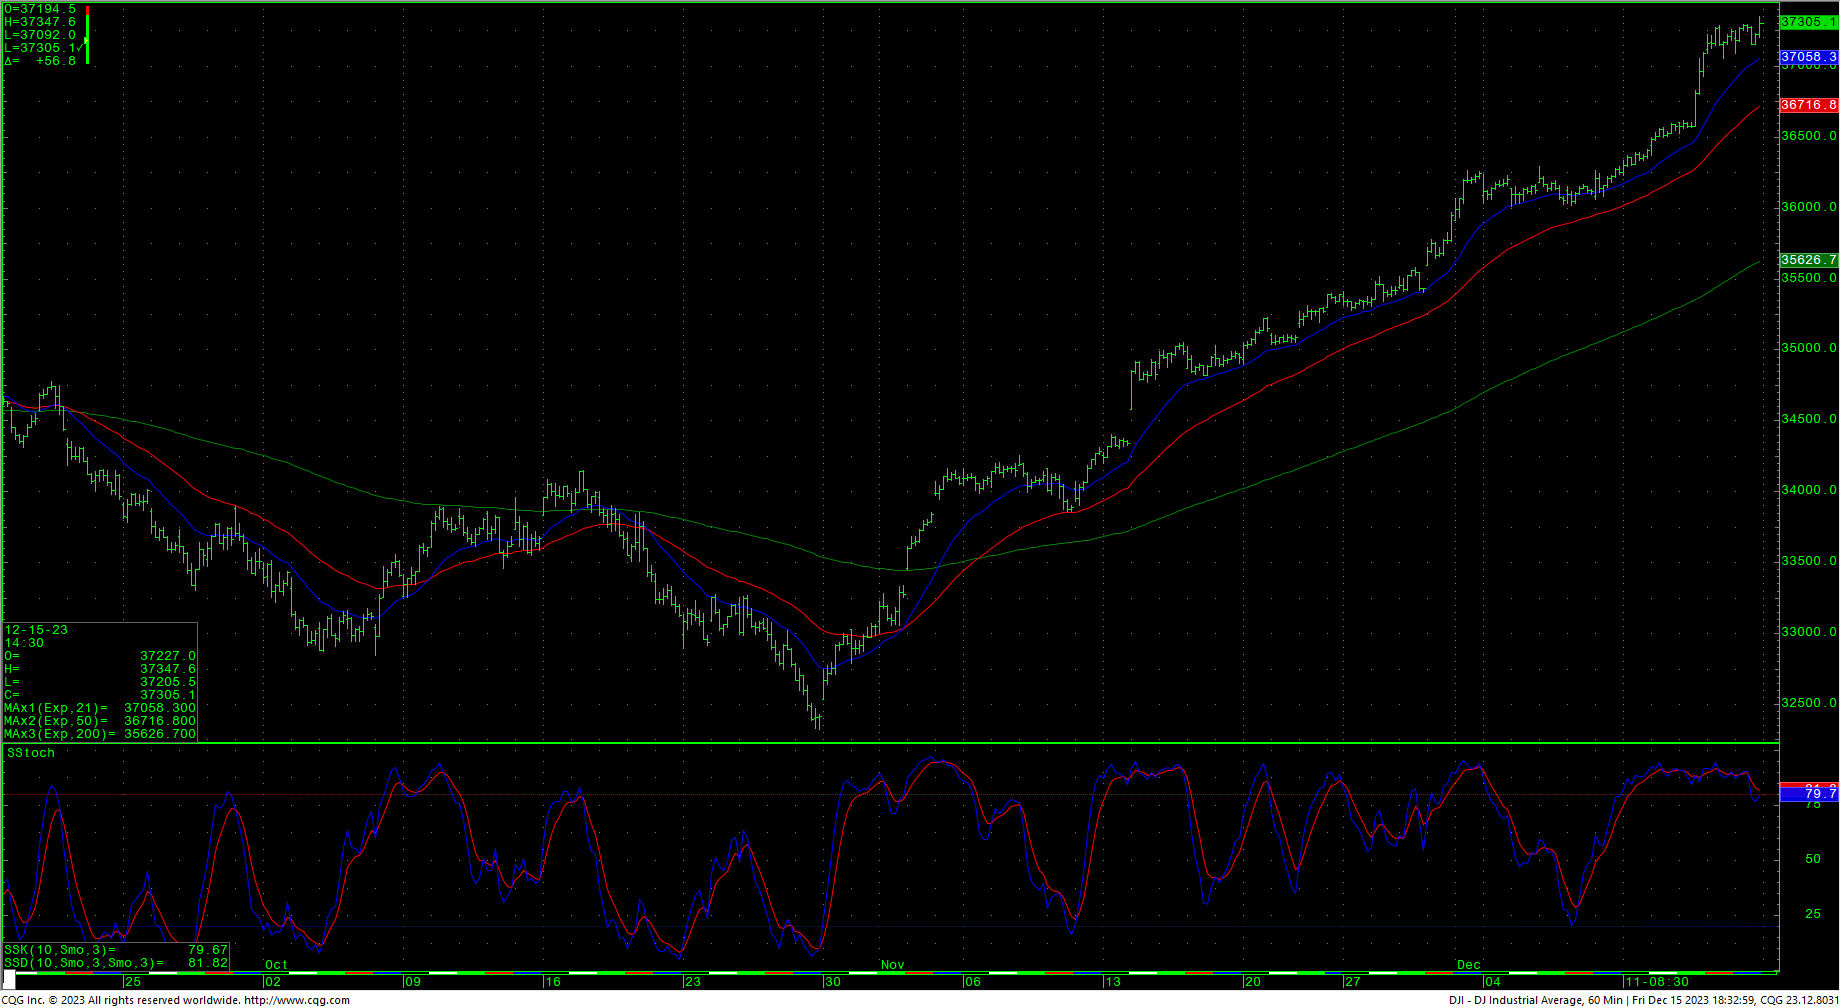 The Dow hourly is overbought with the stochastics attempting to hook higher and flashing a preliminary bearish divergence unless prices continue higher. The weekly is in a strong uptrend and the monthly stochastics are hooking back up with the new highs. Prices moved into new all-time record highs and there are upside targets of 38378.5 and 38454.7. Closes over 38454.7 suggest a move to long-term targets at 37095. Closes over 37095 offer counts to targets at 40245.4.
Support is at 36889, 36605, 36376, and 36147/36140. Closes under 36140 should test 35239 and 34837. A breakdown under 34837 suggests a move to critical short-term support of 34244/34235. Closes below 34235 setup a move to 33512. Closes under 33512 open counts to 32462 through 32327. A breakdown with closes under 32327 is bearish and opens counts into the 31565/31555 area.
Dow Jones Industrial Average Weekly HLC
 Resistance
- 37348 **
- 37384 **
- 37528 ***
- 37672 **
- 37816 **
- 37960 ***
- 38104 **
- 38248 **
- 38378.5 *** ↑ TARGET
- 38454.7 *** ↑ TARGET
- 38599 **
- 38743 ***
- 38887 **
- 39031 **
- 39175 ***
- 39319 **
- 39463 ***
- 39607 **
- 39751 **
- 39895 ***
- 40039 **
- 40245.4 *** ↑ TARGET
Support
- 37092 **
- 37051 ** ↓
- 36889 *** ↓
- 36802 **
- 36610/36605 *** ↓
- 36532 **
- 36376 *** ↓
- 36260 **
- 36147/36140 *** ↓
- 36061 **
- 35891 ** ↓
- 35752 **
- 35592 *** hourly gap
- 35435 ** fills hourly gap
- 35239 *** ↓
- 35155 ** ↓ hourly gap
- 35103 ** fills hourly gap
- 35038 ** ↓
- 34906 **
- 34818 **
- 34780 *** ↓
- 34581 ** gap ↓
- 34405 *** fills gap
S&P 500 Cash Index
S&P 500 Index Daily HLC
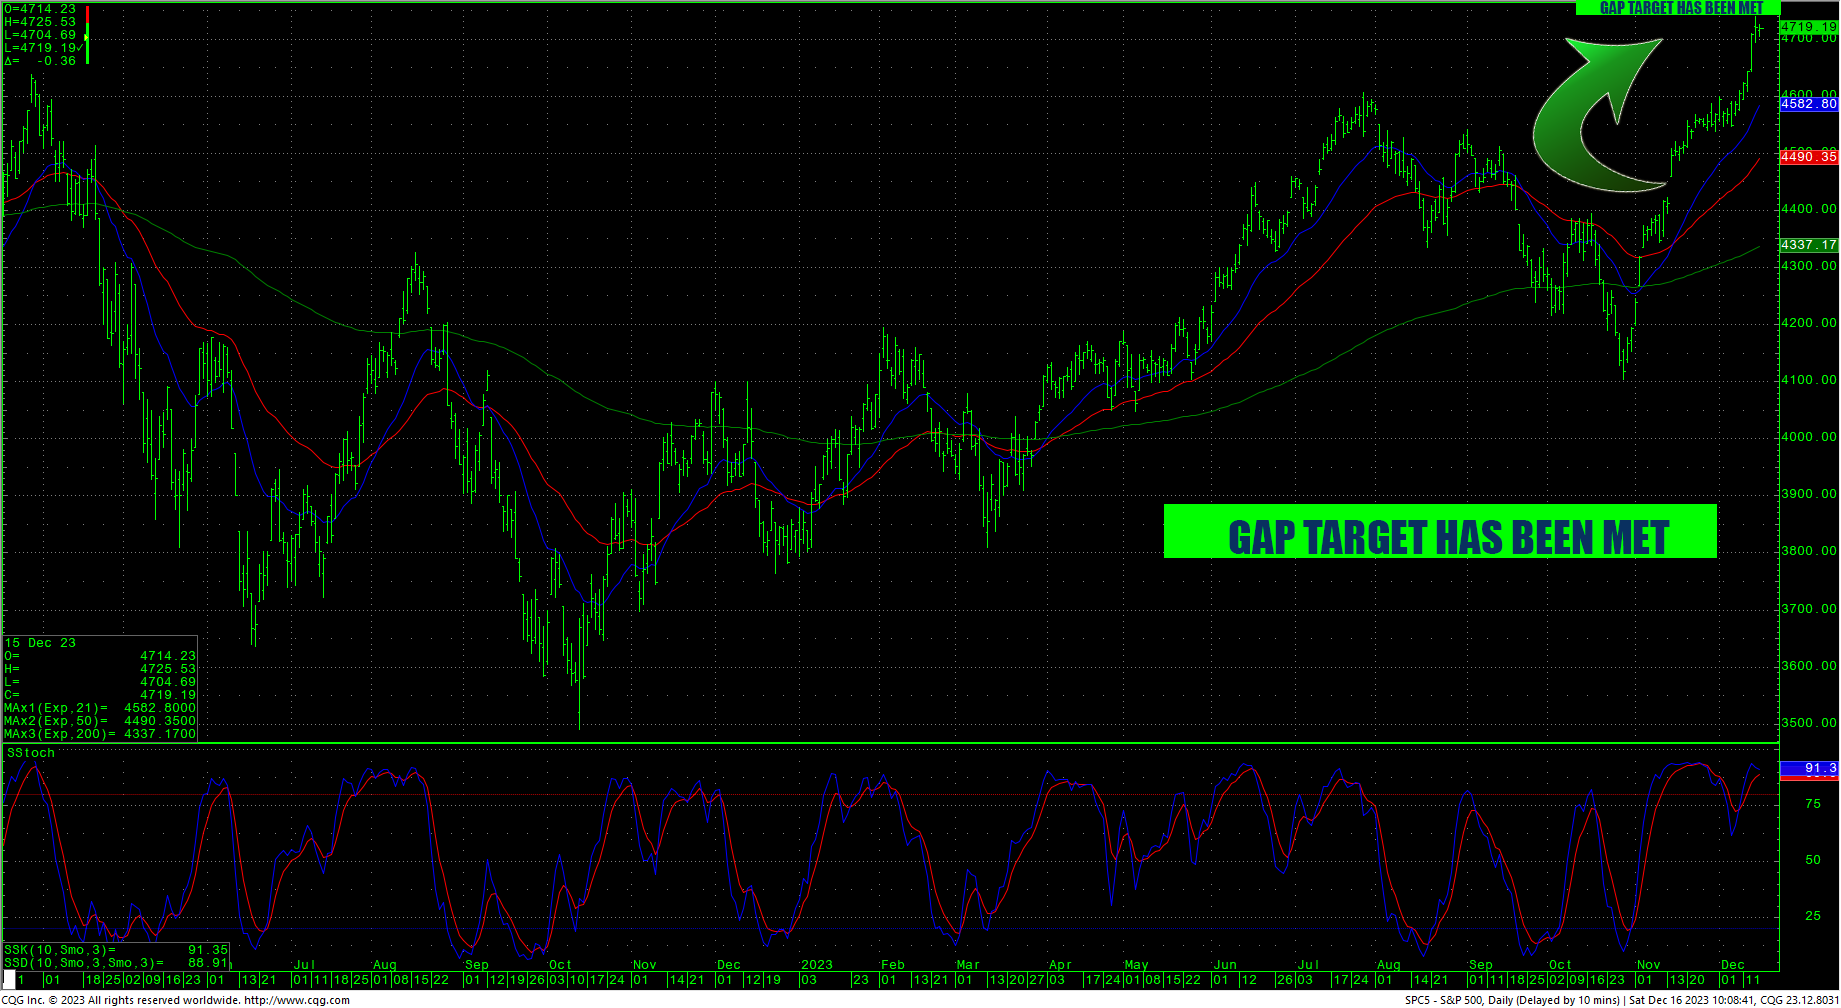 The S&P hourly is relieving overbought conditions with the congestion trade Friday that left the cash index slightly lower for the first time in seven sessions. It was the seventh straight week higher for the index and prices are just shy of the record high weekly close of 4766.18 set the week of 27 December 2021. The daily close is the highest since 12 January 2022. Both the daily and the weekly have moved into some overbought territory on the stochastics. The S&P is the last bastion for the bears as it has not moved into record highs…yet. Also, the weekly high is 4738.57, and there is a daily target of 4739.74 based on the large gap left on 14 November 2023. With this iterated, moves above 4740 should no fuel rallies toward 4748 and ultimately the current record trading high of 4818.62. Closes above the record highs opens counts to 4952/5000 with potential to 5144. Closes over 5144 set up a drive to 5288 with counts to 5432. A breakout over 5432 will open potential to the 5720 area.
Support is at 4692, 4663, 4640 and pivotal near-term at 4616/4612. A breakdown under 4612 should test 4589 with potential to 4496. Closes under 4496 should carry to 4422/4420. A breakdown under 4420 can test critical short-term support of 4345/4340. Daily closes under 4340 set up a move to 4252 with potential to support of 4103/4102. Daily closes under 4102 open counts to critical long-term support of 3917/3910.
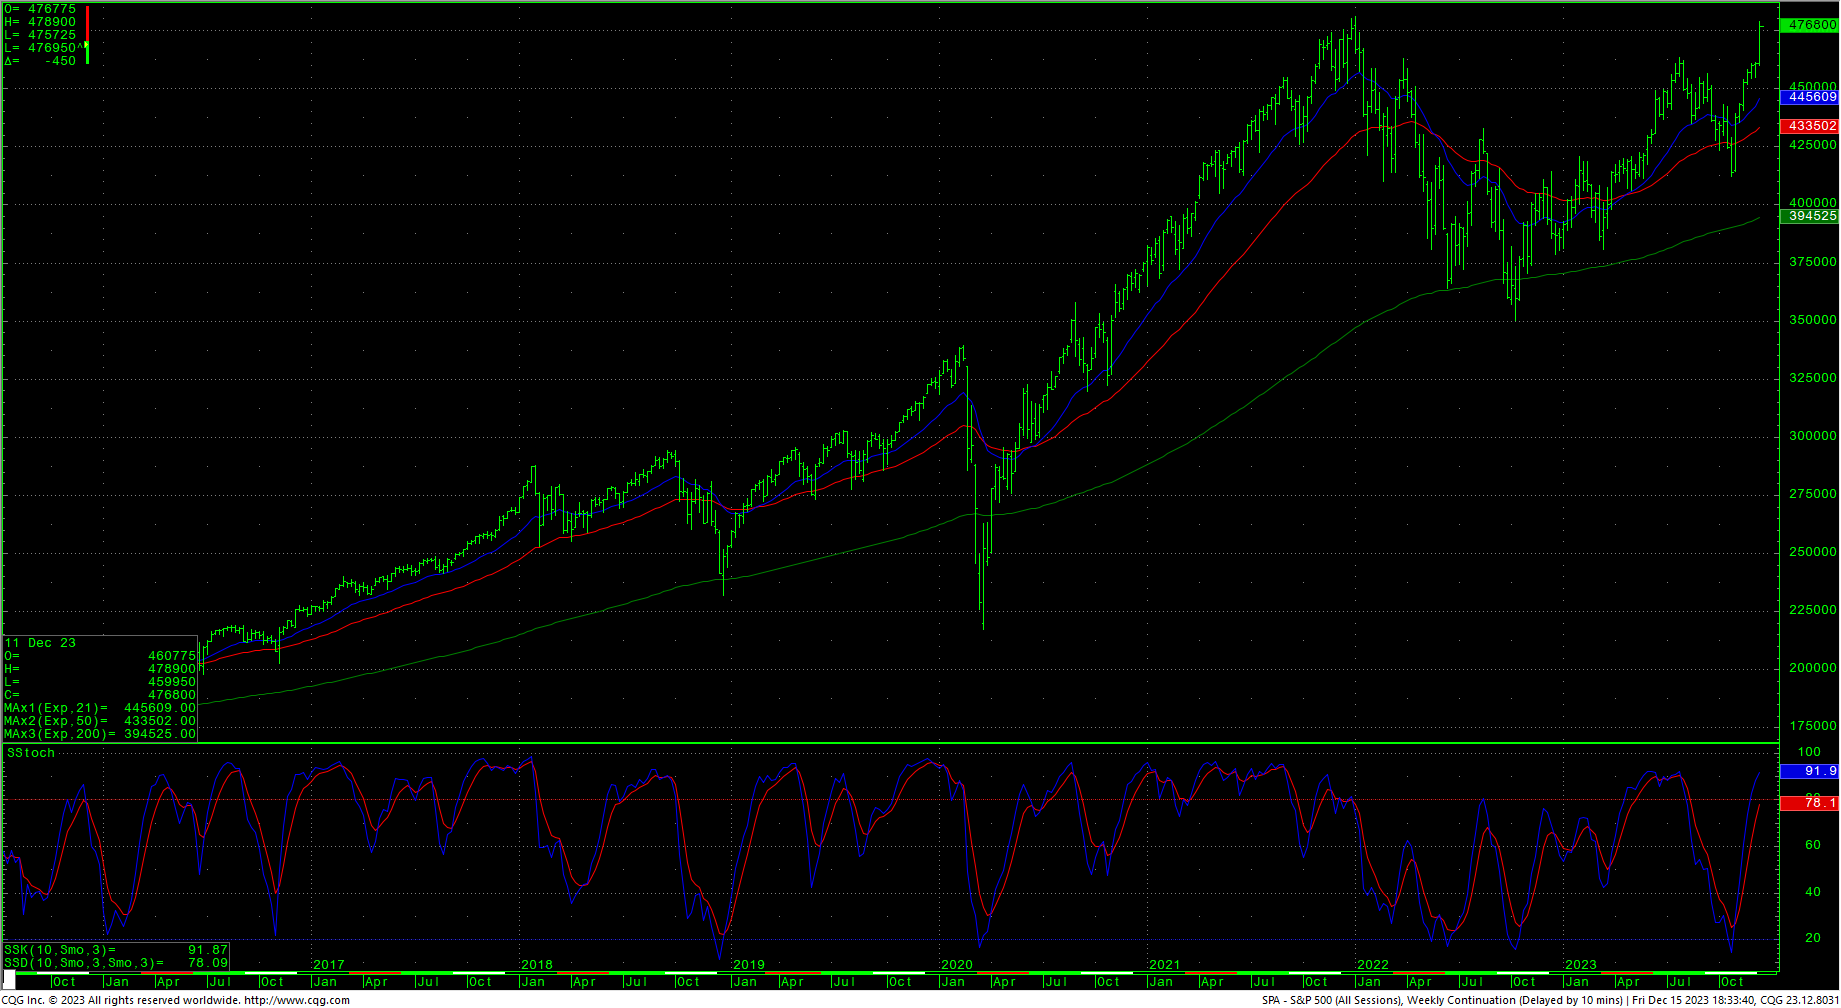
S&P 500 Index Weekly HLC
 Resistance
- 4725 **
- 4739/4740 *** ↑
- 4818 *** ↑
- 4826 **
- 4849/4850 *** ↑
- 4952 ***↑
- 5000 *** ↑
- 5072 **
- 5144 *** ↑
- 5216 **
- 5288 ***
- 5360 **
- 5432 *** ↑
- 5504 **
- 5576 ***
- 5648 **
- 5720 *** ↑
Support
- 4705 **
- 4692 ***
- 4663 *** ↓
- 4640 *** ↓
- 4616/4612 *** ↓
- 4587 **
- 4563 **
- 4533 **
- 4496 *** ↓
- 4472 **
- 4422/4420 *** ↓
- 4399 **
- 4345/4340 *** ↓
- 4334 ** gap
- 4319 ** fills gap
- 4296/4293 *** ↓
- 4270/4260 *** gap ↓
- 4238 **
- 4220 *** ↓
- 4195 *** ↓ hourly gap


