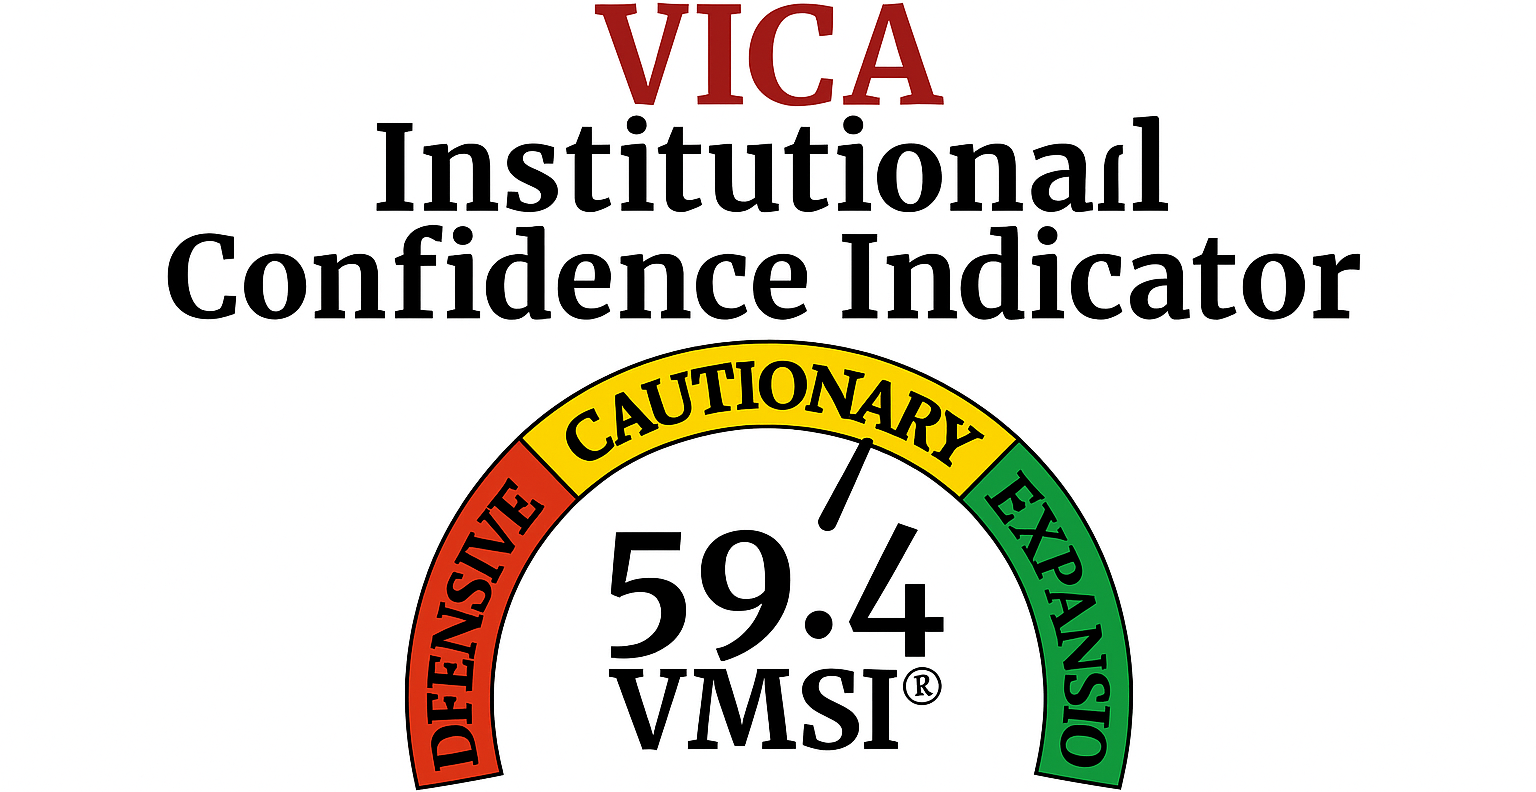
VMSI™ Institutional Market Intelligence Report — FORCE-12.2 Institutional Edition. Week Ending October 16 2025
The Calm Holds — Credit Is the Fuse
Markets remain suspended in an engineered equilibrium — a system still ruled by liquidity, but increasingly constrained by credit torque. Valuations have climbed to altitude: the Sky High Index sits at the 92nd percentile, signaling structural over-extension across equity and credit risk surfaces. Liquidity physics continue to underwrite the imbalance, yet each marginal basis-point of tightening torque erodes absorption capacity. Once the ratio falls below 0.85, compression gives way to convexity — and repricing accelerates.
Weekly Summary – Week Ending October 16 2025
The VMSI composite index eased to 59.4 (from 59.6) yet remains firmly above the continuation threshold of 58. Liquidity depth and execution capacity continue to anchor resilience, while credit friction edges higher. Volatility stays muted; beneath the surface, breadth and spreads show early tension but no fracture.
Macro Context: Leading Indicators (LEI −0.5 in August) remain soft; Consumer Confidence 94.2; CEO Confidence 48 (Q4). Inflation readings (+3.1 % core, +2.9 % headline) reinforce the “higher for longer” policy stance. Manufacturing and employment trends suggest digestion, not deterioration — a slow normalization of force, not momentum loss.
Market Tone: DJIA 45,952 · S&P 6,629 · NASDAQ 22,563 · Gold $4,344 · Crude $57.4 · 10-yr UST 3.97 % · HY 335 bps · IG 108 bps · Fear & Greed 23 (Fear). Breadth (A/D −1,953; McClellan −99) remains narrow, volatility subdued. Liquidity is constructive, but credit torque continues to tighten quietly.
Structural Takeaway: Liquidity still defines equilibrium — but credit has become the fuse. FORCE-12.2 (Mt = 0.8967 → VMSI = 59.4) confirms continuation until HY > 345 bps, the point where liquidity absorption fails and convexity seizes control.

Framing Note — FORCE-12.2 Calibration
Reference Model: Mt=ECt×Ft4×μt+Ct
Parameters:
- EC = Execution Capacity
- F = Liquidity Flow Multiplier
- μ = Convexity / Friction
- C = Crowding Torque
Calibration: Mt=0.8967⇒VMSI=59.4M
Allocator Note: FORCE-12.2 integrates Nobel-recognized microstructure elasticity and convex-response dynamics, increasing torque-sensitivity by ≈ 12 %. This enhancement enables earlier detection of non-linear stress transitions — the inflection where liquidity shifts from absorber to amplifier.
1. Liquidity & Torque Dynamics — The Physics Behind 59.4
Above 58, force exceeds dissipation — pullbacks compress rather than cascade. Execution capacity = 0.94; flow multiplier F = 1.018; friction (μ) low. Skew 27th pct., realized vol 21st pct., spreads within five-year medians.
Inertia 59.4 = digestion, not exhaustion. Breadth (A/D −960; McClellan −99); HY 335 ↑ from 330; IG 108. Continuation holds until HY > 345 bps.
Allocator Note: Stay risk-on but rotate fast; monitor HY curvature and credit torque gradient.
Structural Takeaway: Liquidity dominance holds — credit tension is tightening.

2. Lead Insight — Market Inertia Gauge
Inertia elevated at 59.4 confirms digestion not deterioration. Momentum vectors converge not decay. Breadth thinning raises rotation velocity as liquidity funnels through fewer leaders.
When Inertia > 58 and participation narrows, continuation ≈ 60 %; cycle duration ≈ 12–15 sessions (+1.2 % average follow-through). Vol 21st pct., skew 27th, ETF liquidity +3 % w/w — liquidity absorbing friction faster than credit transmits stress.
Allocator Note:Maintain high-liquidity exposure; rebalance 10–15 sessions; fade over-crowded defensives.
Structural Takeaway: Positive, rotational inertia — liquidity stable, energy compressive.

4. Component Deep Dive — Week-over-Week Changes

Signal:Liquidity and momentum advancing in tandem — FORCE-12 axis aligned.
Allocator Note: Add on shallow pullbacks; favor quality beta and liquidity zones; maintain convex hedges via gold and duration.
Structural Takeaway: Liquidity spine intact; stress channels dormant; continuation bias persists until HY > 345 bps or breadth < 50 %.
5. Sector Rotation & Positioning

Signal: Growth + cyclicals (Tech, Comms, Industrials, Financials) dominate rotational torque; defensives lag.
Allocator Note: Overweight growth / cyclicals; underweight defensives; ride liquidity-led continuation until breadth < 50 % or HY > 345 bps.

6. Sentiment Overview — Institutional Positioning & Market Psychology

Signal: Institutional capital stabilizing but rotating defensively; retail hesitancy persists. The asymmetry between conviction (institutional) and caution (retail) remains the hidden liquidity engine of continuation.
Allocator Note: IRSR > 1.3× confirms structural tailwind for allocators aligned with institutional flow zones. Fade retail-driven volatility spikes; lean into liquidity density where participation thins but torque persists.
Structural Takeaway: The institutional bid continues to anchor persistence, while retail caution preserves upside convexity. Liquidity still flows through strong hands — the mechanical advantage of the FORCE-12.2 regime.

7. Predictive Outlook
Base Case (55%) — Liquidity-Led Continuation FORCE-12.2 trajectory = 59.4 → 60.0 → 60.8 (4 wks). Liquidity and execution capacity continue to offset credit torque. Historical analogs imply +2–4 % S&P follow-through.
Alt Case (30%) — Credit Bleed / Not Break HY 340–355 bps · Breadth < 55 % · CPI > 3.3 % · VMSI ≈ 57–58 zone. Liquidity begins to lose absorption efficiency; torque builds under the surface.
Extreme Case (15%) — Convexity Event HY > 365 bps · CRE stress + VIX > 24 · VMSI < 56 = fracture. BDF (+0.11) = mildly positive bias → historical S&P +2–3 % over 3 months.
Signal Continuation holds until credit breaks. The system remains compressive — not yet reflexive.
Allocator Note Stay long the liquidity base case, but tighten hedges on credit exposure. Pair beta with convex overlays to preserve asymmetry through the torque phase.
Structural Takeaway Energy balance intact — shocks still absorbed, not magnified. Liquidity remains the system’s cushion; credit defines its fuse.

8. Macro Signals Snapshot

Signal: Macro conditions remain structurally stable but forward-looking indicators confirm deceleration.
Allocator Note: Maintain moderate risk while MCSI > 0.70; tilt toward quality duration and IG carry.
Structural Takeaway: Macro system evolving from liquidity-led resilience to credit-constrained persistence — the pre-convex phase.

9. Strategic Layers — Multi-Lens Analysis (FORCE-12.2 Structural Integration)

Signal: Multi-lens reinforcement remains intact — flows, quant, and global liquidity continue to offset macro softening. The lone divergence is credit torque, now the hinge variable between continuation and curvature. The liquidity engine still runs, but the fuel mix is changing: less velocity, more structure.
Allocator Note: With CAVS > 0.82, exposures remain scalable — but discipline is mandatory. Position within liquidity depth, not sentiment comfort. Scale risk asymmetrically — add on stress, trim on euphoria. Protect convexity through gold, quality duration, and credit overlays.
Structural Takeaway: Cross-lens alignment still anchors inertia and keeps continuation viable. Yet widening credit spreads and fading breadth mark the hinge of fragility in an otherwise resilient system. FORCE-12.2 identifies this as the compression-to-convexity threshold — liquidity still commands the present, but torque is quietly buying the future.

10. Institutional Opportunities
The Krummholz Force Risk/Reward Indicator (KFRRI) continues to register structural asymmetry, though convexity rotation is accelerating. Liquidity still underwrites convex payoffs across all major asset classes, yet risk/reward dynamics are tilting decisively toward quality credit and cyclicals, while high-yield credit defines the fragility frontier.

Signal: Cross-asset asymmetry remains investable — but the convexity vector has rotated toward Industrials, Financials, and IG credit. High-yield widening is the first crack in the equilibrium — the hinge where liquidity dominance yields to credit torque.
Allocator Note: Scale risk with overlays, not exposure. Treat HY as the fragility barometer. Concentrate convex capture in Industrials, Financials, IG credit, and gold. Maintain duration and volatility hedges as systemic pressure valves.
Structural Takeaway: Liquidity still keeps convexity alive, but the fulcrum has shifted. Quality credit and cyclicals now anchor structure — while HY defines the fragility boundary. This is the late-compression phase of the FORCE-12.2 cycle — where persistence remains investable, but only through discipline, precision, and structural asymmetry.

Final Word — Compression Has Replaced Conviction
Liquidity still sustains the surface, but no longer expands the cycle. What once represented market resilience now functions as a stabilizer of structure — it absorbs stress but generates no new momentum. Each incremental flow extends time, not trajectory.
Credit torque has begun to erode the gap between liquidity depth and real risk capacity. Efficiency is decaying while valuations remain static, a signature of mechanical rather than organic equilibrium. Late-cycle dynamics are in motion, though volatility has yet to register them.
This is the shift from liquidity-led extension to credit-defined compression — a market where stability is transient and adaptation, not optimism, preserves capital.
Why We Built VMSI™
VMSI doesn’t chase price — it measures the physics keeping markets in motion.
Legacy models look at price; sentiment models chase mood. Neither could explain why institutional persistence kept turning shallow pullbacks into accelerants. That blind spot left allocators reacting instead of anticipating.
VMSI™ closes that gap. Rooted in first principles of physics — inertia, force, convexity, and friction — it converts market structure into measurable dynamics. Backtests and live validation show a > 20 % reduction in false reversal signals compared to legacy factor models.
This isn’t a sentiment gauge. It’s a structural compass. When VMSI reads above anchor levels, allocators can quantify persistence, not guess it. That edge is what turns consolidation phases into opportunity windows instead of exit triggers.
Positioning Note: Whether you’re managing institutional portfolios or private wealth, VMSI provides the discipline to stay constructive when surface sentiment falters. It gives decision-makers clarity on when to lean in — and when to defend.
Disclaimer: For informational purposes only — not investment advice or a solicitation. Views are as of publication and may change. Past performance is not indicative of future results.
© 2025 VICA Partners — VMSI Economic Physics Model


