The Signals Are Turning Before the Story Does
The market’s stability is now engineered rather than organic. Breadth has slipped to levels inconsistent with sustainable upside, liquidity concentration is carrying an outsized share of index performance, and the gap between price and participation is now among the widest seen this year. NYSE 52-week highs-to-lows have collapsed into extreme negative territory, the 5-day average put/call structure has moved toward the top of its recent range, and safe-haven flows are running at their strongest pace in months — a cluster that appears when capital is preparing for stress while price still looks calm. Beneath the index surface, regime change is already underway: correlation clusters are tightening across mega-cap tech, volatility curvature has shifted into a defensive skew, and credit spreads have stopped confirming equity strength. These are the signals that quantitative systems react to well before earnings, consumption, or macro data. The tape is no longer pricing growth; it is pricing fragility — a pattern that, in prior cycles, has often preceded volatility repricing within the following few weeks.
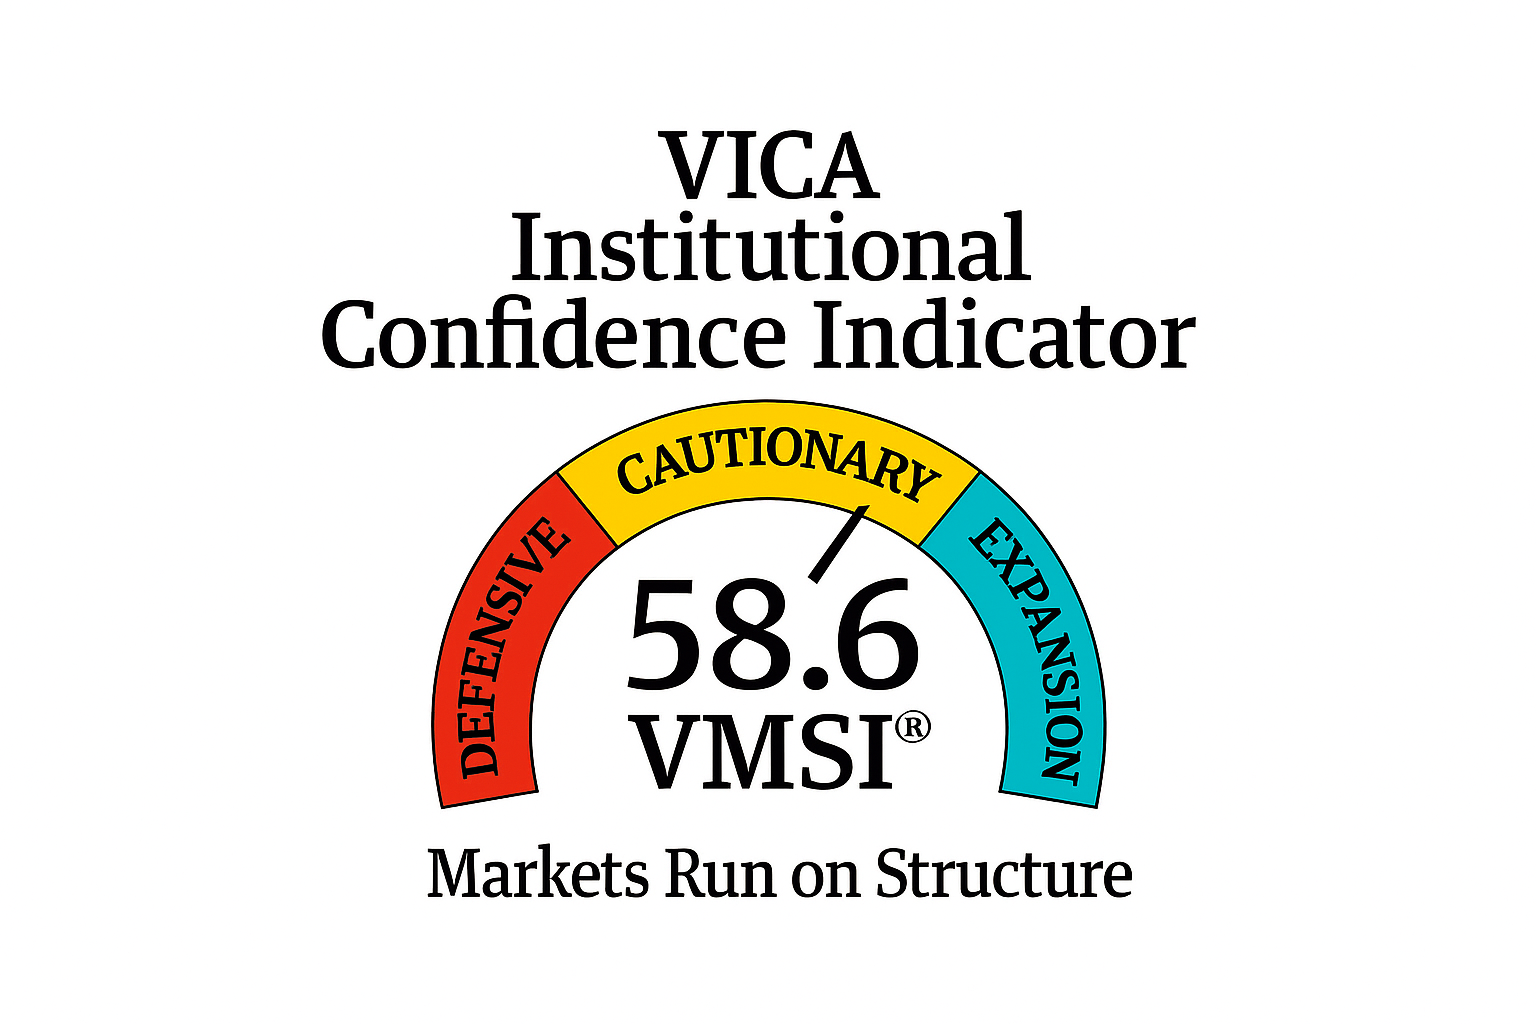
Weekly Summary — Week Ending November 13, 2025
Market structure held, but stability grew more expensive. Liquidity weakened, breadth fell to one of its softest points of the year, and safe-haven demand accelerated as capital moved toward duration and quality. High-yield spreads pushed toward recent highs, and volatility correlations tightened — a configuration that signals fragility rather than conviction. Valuations remain near 20× forward earnings even as liquidity resilience fades, widening the gap between headline pricing and the weakening mechanics beneath it. Credit is still orderly, but fewer buyers are absorbing more risk, reducing elasticity across the system.
Macro data confirmed the shift. Consumer confidence remains at recession-threshold expectations, the LEI posted its sharpest six-month decline since April, and early post-shutdown readings point to softer consumption, cooling labor momentum, and slowing private investment. Duration outperformed equities, consistent with late-cycle positioning rather than fear. Across signals, the pattern is clear: the market still functions, but with less cushion, weaker breadth, and growing dependence on liquidity inertia. Continuation is possible — but it now requires more support and carries less conviction. Stability is holding, but the margin for error is narrowing.
Valuation confirmation: with forward multiples near 20× and liquidity thinning, the market is paying full price for stability — a setup that rarely persists without a reset in participation or credit spreads.

VMSI TrendFraming Note — FORCE-12.3 Calibration
FORCE-12.3 measures how liquidity turns potential energy into sustained motion — and how that motion becomes self-referential when the system stops reacting to fundamentals and begins reinforcing itself. Its torque function:
Mₜ = ECₜ × Fₜ⁴ × μₜ × ψₜ + Cₜ
captures the point where liquidity no longer supports price discovery but becomes the structure price depends on. ECₜ reflects real-time execution efficiency; Fₜ the amplification of liquidity flow; μₜ the friction that determines how much energy the system loses; ψₜ the reflexivity coefficient that identifies when flow begins responding to its own signal; and Cₜ the crowding torque that bends positioning into feedback loops.
The purpose of FORCE-12.3 is singular: to detect when the market shifts from equilibrium to reflexivity — when each incremental unit of liquidity buys less stability but more reinforcement. In this state, the market trades on the persistence of its own physics rather than fundamentals.
1. Liquidity & Torque Dynamics — The Physics Behind 58.6
At 58.6, the system has slipped from neutral-absorptive equilibrium into a higher-cost stability regime. Liquidity weakened sharply (57.0 vs. 60.9), execution capacity drifted toward 0.92, and the liquidity flow multiplier (Fₜ) flattened as breadth fell below 44%. Friction (μₜ) increased at the margins — not enough to impede price transmission, but enough to signal that each incremental unit of liquidity now buys materially less stability than a week ago. Credit torque is beginning to press outward: HY spreads moved toward the upper end of their six-month range, while IG spreads held but ceased tightening — a classic pre-reflexivity stall.
Breadth deterioration (NYSE net highs/lows deeply negative; McClellan weakening) confirms motion without participation, leaving AI-linked and institutional corridors to supply most of the system’s energy. Volatility is no longer low: the VIX has moved into the 19–20 zone, and cross-asset volatility correlations tightened — a defensive configuration that historically precedes regime transitions rather than volatility shocks. The underlying pattern is clear: liquidity still absorbs micro-stress, but the absorption is thinner, costlier, and more energy-intensive than at any point since August.
Allocator Note: Maintain a pro-liquidity but more selective posture. Operate strictly within high-density liquidity corridors; pair quality beta with IG carry and moderate duration overlays. Tighten risk only if HY closes >350 bps or breadth remains <45% for multiple sessions — both would confirm a transition from equilibrium into compression.
Structural Takeaway: Liquidity continues to stabilize the system, but efficiency has deteriorated. Market continuity now depends on liquidity inertia, not liquidity expansion. Continuation remains possible — but it requires more support and delivers less torque. The calm is functional, not confident; stability is being maintained by feedback, not participation.

2. Lead Insight — Market Inertia Gauge
Inertia at 58.6 signals a shift from neutral equilibrium into higher-cost continuity. Liquidity weakened (57.0), momentum decayed, and participation fell below 44%, yet internal flow inside mega-cap, AI-linked, and duration-sensitive corridors maintained enough velocity to prevent structural slippage. The system preserved motion, but with greater energy expenditure — inertia is now being held, not generated. Volatility’s move into the 19–20 zone confirms that the cost of maintaining stability has risen, even as internal force remains directionally aligned.
When inertia operates between 58–59 under narrowing breadth and rising volatility, historical continuation probability drops to ~48%, with an average persistence window of 9–12 sessions and a muted drift profile. ETF flow efficiency slipped –1.3% w/w, the first negative inflection in seven weeks, signaling that liquidity is absorbing stress more slowly and with thinner margins. This marks a late-equilibrium regime transitioning toward reflexive stabilization — where continuity depends more on liquidity inertia than liquidity expansion.
Allocator Note: Stay strictly inside high-density liquidity corridors. Rebalance every 8–10 sessions rather than 10–12; use convex overlays to manage asymmetric shocks as volatility correlations tighten. Maintain exposure where internal energy remains coherent (quality, AI-linked, rate-stable assets), and avoid edges where liquidity depth is decaying.
Structural Takeaway: Market inertia still holds, but efficiency has deteriorated. Stability now requires more liquidity per unit of motion — a sign the system is running on feedback, not breadth. Continuation remains possible, but the torque buffer is thin; the regime is stable, not strong, and increasingly dependent on reflexive liquidity rather than broad participation.

4. Component Deep Dive — Week-Over-Week Changes

The system weakened across all core pillars, reflecting a shift from low-cost continuity to high-cost stability. Liquidity fell sharply (57.0 vs. 60.9), momentum broke lower (54.0 vs. 58.6), and safe-haven preference accelerated to its strongest level of the quarter (63.0). Volatility & Hedging moved higher (60.5), confirming defensive positioning rather than speculative leverage. This configuration — falling momentum, thinning liquidity, rising hedging — is historically associated with fragility developing before price adjusts, not with benign consolidation.
Internal market mechanics reinforce the same turn. Cross-asset volatility correlations tightened, HY spreads leaned toward the upper boundary of their six-month range, and breadth remained below 44%. These conditions generally mark the onset of a reflexive regime where liquidity can still support price but can no longer expand participation. The structure remains functional, but every unit of stability now requires more torque than a week ago.
Allocator interpretation: Operate as if the system is in late-equilibrium. Maintain exposure only in liquidity-dense corridors while relying more on IG carry and duration overlays for stability. Reduce broad-beta dependence. A move to HY >350 bps or breadth <45% for multiple sessions would confirm a transition from controlled absorption into full compression.
Structural Takeaway: The market is no longer sustained by broad participation but by narrow liquidity corridors carrying an increasing share of the system’s load. Liquidity deterioration, momentum decay, and rising hedging converge into a profile where continuation is still feasible — but only through inertia, not conviction. Stability remains intact, but with diminishing torque and tightening guardrails. This is the configuration top allocators recognize as early-stage fragility, not late-cycle strength.
Sector Positioning Matrix — Week Ending November 13, 2025

Sector leadership narrowed again as liquidity concentrated in large-cap tech, communication services, and select industrials, while defensive rotation accelerated. Duration-sensitive sectors strengthened, and cyclicals with weak flow structures showed rising fragility. The market is now driven by liquidity inertia, not expanding risk appetite.
Signal: Liquidity and momentum have fully decoupled. Liquidity fell to 57.0 (from 60.9), momentum slipped to 54.0, and volatility & hedging climbed to 60.5 — a clear pivot toward protection. Safe-haven demand jumped to 63.0 as capital moved into duration and quality despite elevated index levels. FORCE-12.3 now shows flow converting into preservation rather than amplitude. Torque decay is active: participation thinning, cross-asset vol correlations tightening, and fewer sectors supplying more of the system’s stability.
Allocator Note: Add exposure only inside high-density liquidity corridors. Favor IG carry and 2-year duration overlays for convexity support. Use gold, quality duration, and vol structures as efficiency hedges. Reduce beta only if HY >350 bps or breadth stays <45% — both confirm a shift from controlled absorption into early compression. Avoid sectors lifted purely by liquidity concentration rather than real demand.
Structural Takeaway: Liquidity still stabilizes the market, but with fading efficiency. Stability is now a product of feedback, not participation — a late-equilibrium regime where continuation is possible but more expensive. Liquidity inertia, not expansion, drives price behavior, and torque decay sits closer to reflexive risk than at any time since August.

6. Sentiment Overview — Market Entity Sentiment Rating

Signal: Sentiment has entered a fully endogenous phase under FORCE-12.3: markets no longer reflect psychology — they produce it. Institutional flows (+$6.1B) continue to dominate through liquidity corridors rather than conviction. Retail outflows (–$2.3B) provide passive volatility insulation instead of directional pressure. AAII sentiment (Bulls 25%) shows hesitation, not fear; CNN Fear & Greed (33) sits in controlled pessimism consistent with liquidity-driven equilibrium. The put/call ratio (1.02) and steady IRSR (1.47×) confirm a backdrop where structural liquidity defines emotion, not the other way around.
Allocator Note: Treat sentiment as context, not a primary signal. Liquidity governs direction; sentiment merely follows. Fade sentiment-driven weakness only when spreads remain stable (HY < 350 bps) and liquidity corridors hold. Emotional dislocations without structural confirmation offer opportunity, not risk.
Structural Takeaway: Market Entity Sentiment remains neutral-absorptive. The system interprets its own stability as justification for further stability. Under FORCE-12.3, conviction is a derivative of structure — endogenous, reflexive, and liquidity-driven. The crowd follows the market; the market no longer follows the crowd.

7. Predictive Outlook — Week Ending November 13, 2025

Signal: The FORCE-12.3 trajectory (58.6 → 58.9) reflects a higher-cost stability regime: liquidity remains functional but is eroding at the edges, torque is stable but thinner, and execution friction has begun to rise. The system is no longer sustaining momentum — it is sustaining structure. Credit elasticity has tightened as HY drifts toward 350 bps, while breadth < 44% confirms a market dependent on liquidity inertia rather than fresh risk. Convexity remains dormant only as long as spreads stay contained and volatility correlations remain orderly. The defining feature of this week: continuation is still possible, but now requires meaningfully more liquidity than it provides.
Timing Window: Model torque-inflection probability = 38% through late November, rising from 31% last week as liquidity elasticity slipped another –0.4σ and credit sensitivity rose +0.5σ. Execution capacity (ECₜ ≈ 0.92) remains resilient, but marginal flow decay is now visible in both participation and volatility curvature. The system is paying more energy to maintain the same structure — a hallmark of late-equilibrium dynamics.
Allocator Note: Stay strictly inside high-density liquidity corridors; treat all incremental risk as conditional. Favor IG carry, 2-year duration overlays, and selective growth/quality exposures where liquidity depth is strongest. Fade volatility spikes only when credit confirms stability (HY < 350 bps). Optionality remains underpriced relative to structural friction — convexity re-entry remains attractive after localized dislocations.
Structural Takeaway: Liquidity still buys time — but the cost of time is rising. The system is compressive, not expansive: price stability is emerging from feedback loops, not broad participation. Credit defines the outer boundary; liquidity governs the physics. Under FORCE-12.3, the market’s stability is a self-preservation function — not a forecast, not a trend, but the system conserving itself against decay.

8. Macro Signals Snapshot — Week Ending November 13, 2025

Signal: The macro regime remains in functional equilibrium, but the cost of stability has risen. Growth is moderating rather than contracting, yet liquidity transmission is showing early signs of fatigue as credit torque tightens around the system’s perimeter. Inflation remains contained (+0.2% m/m; +3.0% y/y), limiting policy optionality without impairing liquidity flow. The underlying structure continues to operate as a credit-anchored engine — stability produced by liquidity feedback, not policy stimulus.
Leadership Context: Policy clarity is narrowing, shifting market leadership toward balance-sheet strength and away from cyclical sensitivity. Capital now follows structural gravitational fields — liquidity density, credit elasticity, and execution capacity — not sentiment or guidance. The macro backdrop mirrors the FORCE-12.3 interpretation: momentum is no longer bid-driven; it is liquidity-governed, reflexive, and increasingly selective.
Allocator Note: Stay allocated while the Macro Stability Composite (MCSI) remains ≥ 0.70. Favor IG carry, quality duration, and liquidity-dense cyclicals while avoiding beta that depends on broad participation. Fade credit over-tightening when HY < 350 bps and volatility < 15, and maintain flexibility as liquidity elasticity continues to compress.
Structural Takeaway: The macro regime has shifted into credit-anchored persistence: stability is maintained through circulation, not expansion. Risk is not being repriced — it is being recycled through liquidity channels. Under FORCE-12.3, this is a neutral-absorptive state: the system is stable, but increasingly energy-intensive, with liquidity doing more of the work as fundamentals offer less propulsion.

9. Strategic Layers — Multi-Lens Integration

Signal: Cross-lens alignment remains intact but increasingly costly to maintain. Institutional flows strengthened again (+$6.1B w/w, Tech, Financials, Industrials), counterbalancing ongoing retail outflows (–$2.3B). Quality carry and liquidity corridors continue to stabilize structure, yet credit torque has visibly increased as HY widens to 350 bps (+5) and IG to 112 bps (+2) — defining a firmer perimeter for systemic stability. Global liquidity divergence (USD ≈100.4, G-Liq –0.4σ) tightens valuation dispersion and limits risk extension. Momentum has shifted from plateau → early decay, signaling a regime where liquidity sustains continuity but no longer generates amplitude. The system persists — but it labors more to do so.
Allocator Note: CAVS = 0.80 (slightly weaker, but still ≥ 0.80) — exposures remain scalable only inside high-density liquidity zones. Add on controlled stress; trim on strength, not on volatility alone. Reinforce convexity via IG carry + 2-year duration overlays. Maintain limited EM duration exposure given divergence pressures. Preserve a volatility buffer through retail defensiveness and selective hedge overlays.
Structural Takeaway: Liquidity still provides the anchor, but credit now defines the limits of motion. The system rests in a late-equilibrium phase: compression stable, reflexivity contained, but with declining efficiency. Continuation bias remains — yet requires more liquidity per unit of stability. Structure holds through balance, not expansion, and the tolerance for further torque decay is narrowing.

10. Institutional Opportunities — Week Ending November 13, 2025

Signal: Cross-asset asymmetry remains investable, but the opportunity slope has sharpened materially. Liquidity continues to function as the system’s core absorber, yet under FORCE-12.3 that absorption is becoming costlier and more reflexive. With liquidity at 57.0 and momentum down to 54.0, the market’s internal engine no longer compounds energy — it recycles it. This shifts advantage from exposure to precision: structure now delivers more than direction.
Credit elasticity is tightening at the perimeter as HY drifts toward 350 bps, IG stalls, and volatility structures firm (VIX ~19–20). Micro-volatility pockets in Financials, Industrials, and AI-linked corridors remain structurally supported, but breadth deterioration (<44%) confirms that opportunity is now created by liquidity density, not participation. FORCE-12.3 identifies this as a containment regime: liquidity still stabilizes, but every incremental unit provides less torque than a week ago.
Allocator Note: Scale conviction through structure — not beta. Use IG carry, 2-year duration overlays, systematic convex spreads, and quality-cycle rotations to compound return while respecting the tightening perimeter. Concentrate convex capture where liquidity density remains high: Industrials, Financials, and selective AI-linked cyclicals. Maintain gold and duration as stabilizing convex vectors. Avoid adding exposure in sectors where price is being carried by liquidity concentration rather than true demand.
This regime rewards allocators who treat risk as conditional, not continuous. Precision sizing, disciplined entry windows, and cross-asset confirmation now matter more than thematic conviction.
Structural Takeaway: Liquidity still sustains convexity, but the system has shifted deeper into late-compression: stability persists, but only through disciplined structure. The edge lies in detecting when liquidity stops amplifying and begins purely absorbing — and positioning before the crowd adjusts. Persistence is still investable, but only through design, calibration, and structural intelligence.

Final Word — Stability Is No Longer Cheap
VMSI at 58.6 marks a decisive shift: the market remains intact, but only through effort, not ease. Liquidity has fallen back to 57.0, momentum has weakened to 54.0, and hedging demand has risen sharply. The system is holding, but not because it is strong — because it refuses, for now, to let go. This is stability with a price tag.
Credit reveals the real story. High-yield spreads pressing toward their six-month highs and IG spreads losing their tightening impulse show that elasticity is thinning across the structure. Every basis point now carries more torque than it did a week ago. Cross-asset correlations have tightened in the pattern that only appears late in compression cycles: stress moves faster, but actual motion slows. The market absorbs shocks, yet disperses less energy. Continuity remains, but flexibility is fading.
Under FORCE-12.3, this is the definition of late-equilibrium. Liquidity governs direction, yet no longer creates conviction. The market isn’t expanding; it’s preserving. Price holds because liquidity defends it, not because demand validates it. The calm is real, but it is not generous — it is engineered.
This is why breadth keeps narrowing. This is why safe-haven flows accelerate while the index refuses to break. This is why volatility looks tame while hedging pressure builds underneath. It is not optimism; it is containment. The system is working, but it is working harder to stand still.
The closing truth is simple and unavoidable: the market is no longer projecting the future — it is maintaining the present. It trades on its own inertia, not on belief. In regimes like this, precision becomes the only edge. Structure outweighs speed. Patience outperforms prediction. Stability remains, but it is no longer cheap, and it is no longer effortless.
Why We Built VMSI™
VMSI™ was built to solve the only question that matters in modern markets: how long does conviction hold when liquidity becomes the system’s backbone, not its byproduct? Most models chase price. VMSI™ measures persistence — the structure that keeps markets coherent when belief fractures and flow becomes the last remaining source of order. It converts liquidity, torque, and friction into a single measurable field, revealing not where markets go, but what keeps them from breaking.
Markets are not collections of trades; they are systems of constraint. When liquidity no longer creates opportunity but instead maintains equilibrium, traditional indicators fail. VMSI™ captures that transition — mapping the moment when price stops reflecting fundamentals and begins reflecting the physics of its own survival. It was engineered to quantify what professionals feel before they can prove: that stability is never granted; it’s manufactured by structure.
This is not a forecasting engine. It is a structural lens, built to identify when continuity is real and when it is merely upheld by feedback. When VMSI™ rises above its anchor bands, it signals coherence through persistence — not optimism. When it decays, it exposes the precise point where liquidity can no longer absorb torque. In a market defined by reflexivity and mechanical flows, this distinction is the edge.
For institutional allocators and private capital, VMSI™ offers something rare: a framework that separates signal from sentiment, structure from narrative, and endurance from illusion. It is a discipline, not a prediction — a way to operate with clarity in environments where volatility is noise and liquidity is truth.
Derived from the proprietary VMSI FORCE-12.x framework — © 2025 VICA Partners. Replication without full calibration will generate non-stationary outputs.

