
Liquidity Holds — AI Amplifies — Credit Decides.
Markets are steady, but conviction is thinning. Liquidity keeps valuations elevated — the S&P 500 trades at 20.4× forward earnings, a four-year high — while the NASDAQ’s gains remain concentrated in a handful of AI-driven megacaps. Flows are automated, not allocative; machines sustain motion where fundamentals no longer do.
Execution remains efficient, but absorption is shallow. Liquidity is reflexive — fast in flow, thin in depth. Credit spreads stay tight (HY 340 bps · IG 110 bps), yet sensitivity to growth has increased with each basis point.
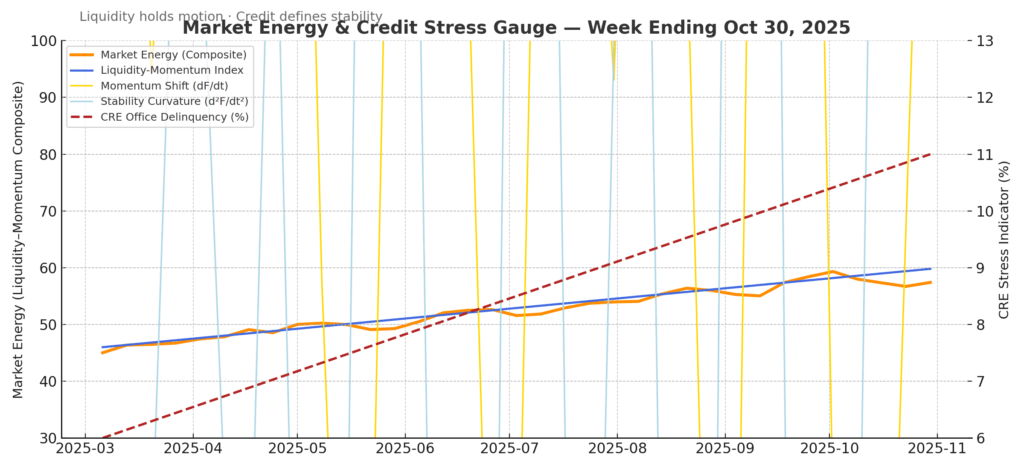
Regulators are watching mid-tier banks as $1.7 trillion in CRE debt approaches maturity; office CMBS delinquencies near 6.0%, the highest since 2012. Liquidity still functions, but it now preserves structure instead of expanding value.
Weekly Summary — Week Ending October 30, 2025
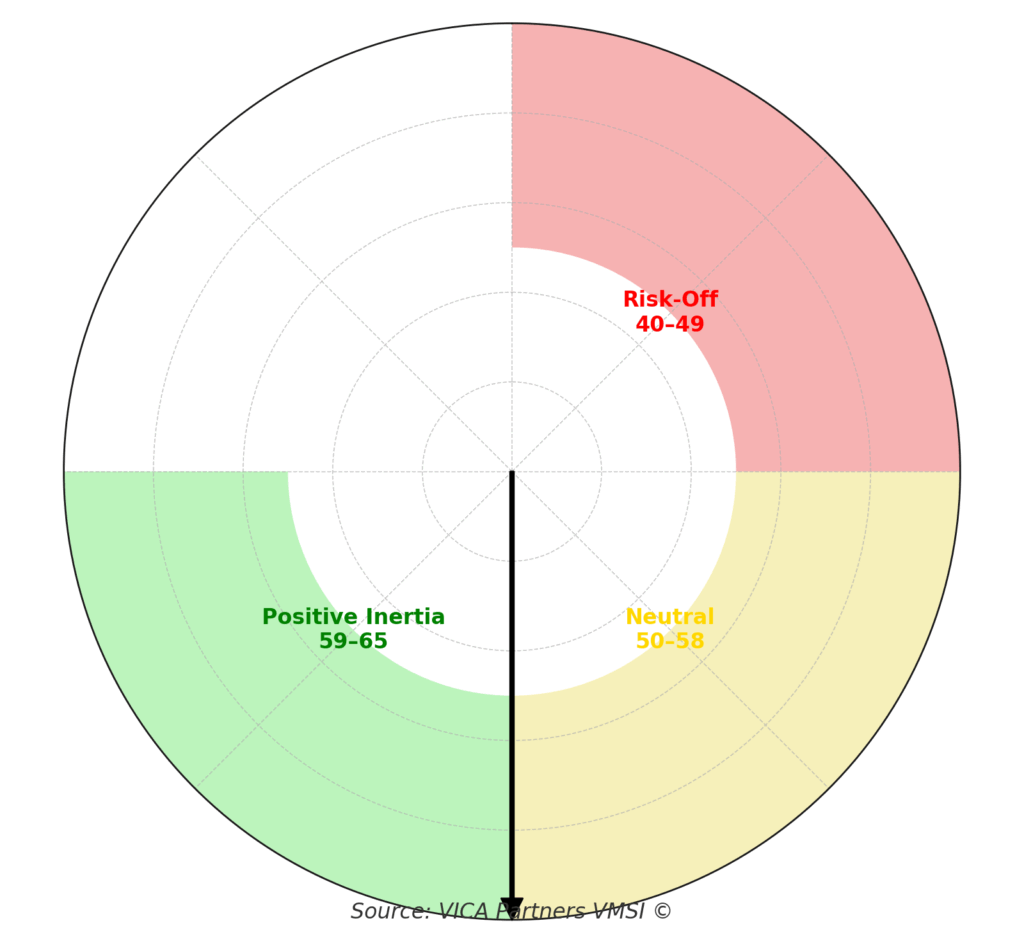
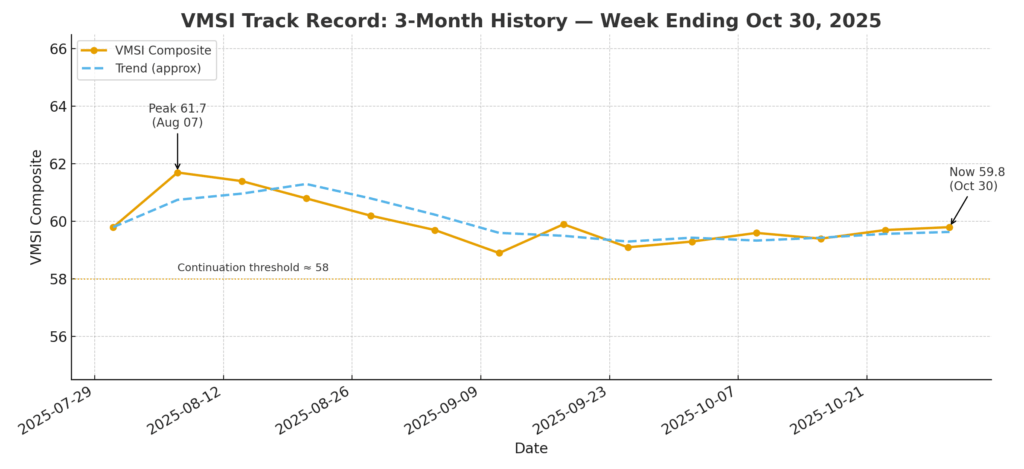
VMSI Composite: 59.8 — steady in continuation. Sub-components: Liquidity 62.0 · Momentum 59.6 · Volatility & Hedging 58.7 · Safe Haven 59.0. Liquidity remains the system’s spine; momentum confirms direction, but energy transfer is thinning. The modest uptick in safe-haven demand reflects defensive rebalancing, not systemic stress.
Macro Context: The economy continues to cool by design, not distress. LEI −0.5% m/m (Aug) signals persistent drag in forward torque, while Consumer Confidence 94.6 and CEO Confidence 48 (Q4) confirm hesitation without retrenchment. Inflation remains contained at +0.3% m/m, +3.0% y/y, keeping the Fed comfortably on hold. PMI 52.2 indicates mild expansion, though employment softens at the margins. CRE delinquency ~6.0%; bank-held CRE ~1.4% — a manageable credit shadow, not a systemic threat.
Market Tone: DJIA 47,563 · S&P 6,840 · NASDAQ 23,725 · Gold $4,410 · Crude $57.8 · 10-yr UST 3.91% · HY 340 bps · IG 110 bps · Fear & Greed 35 (Fear). Breadth remains narrow (A/D −940 · McClellan −55) as volatility stays suppressed (VIX 14.1; realized vol 22nd percentile). Valuations extend on flow, not fundamentals — S&P forward P/E ~20.4×. Credit markets stay rational; liquidity still underwrites price stability as AI-linked large caps drive most of the market’s torque.
Structural Takeaway: Liquidity continues to buy time — but it now extends duration, not expansion. The market trades on reflex rather than conviction — a self-clearing loop sustained by mechanical flow instead of broad belief. Continuation bias holds while HY < 345 bps and breadth > 50%, but each week of persistence costs more torque. Structure remains stable, yet elasticity continues to thin.
Framing Note — FORCE-12.2 Calibration
At its core, FORCE-12.2 measures how liquidity becomes motion — and when that motion turns reflexive. The structural torque is defined by:
Mₜ = ECₜ × Fₜ⁴ × μₜ + Cₜ
-
ECₜ (Execution Capacity): the market’s ability to clear risk efficiently.
-
Fₜ (Liquidity Flow Multiplier): how liquidity amplifies or dampens price transmission.
-
μₜ (Convexity / Friction): the non-linear drag determining whether liquidity absorbs or releases stress.
-
Cₜ (Crowding Torque): behavioral concentration bending flow into feedback.
Purpose: FORCE-12.2 isolates the hinge between stability and fragility — when liquidity stops absorbing risk and begins transmitting it. It captures the rate of decay in liquidity efficiency — how much less stability each incremental unit of flow produces over time. By tracking that slope, the model identifies structural fatigue before it shows in price or volatility — converting behavior into measurable mechanics.
1. Liquidity & Torque Dynamics — The Physics Behind 59.8
At 59.8, the system remains in late-compression: force still exceeds dissipation, but flow efficiency is decaying at the margin. Execution capacity holds near 0.95, liquidity multiplier (Fₜ) steady at 1.02, and friction (μₜ) remains low. Liquidity at 62.0 continues to anchor market depth, while credit torque tightens fractionally as HY ≈ 340 bps · IG ≈ 110 bps stay below stress thresholds.
Breadth (A/D ≈ −940; McClellan −55) is narrow but stable, suggesting persistence without expansion. Skew and realized volatility remain in the lower quartile, confirming that liquidity still absorbs incremental stress faster than credit can transmit it.
Allocator Note: Maintain a pro-liquidity bias, but rotate more dynamically across leadership bands. Treat 62.0 liquidity as a working shock absorber — effective, not infinite. Pair quality beta with convex hedges and modest duration carry. Trim exposure only if HY > 345 bps or breadth < 50%.
Structural Takeaway: Liquidity dominance persists, but energy efficiency is declining. Flow remains stabilizing rather than stimulative. Continuation bias holds while credit spreads stay contained and participation breadth avoids contraction — calm remains mechanical, driven by liquidity torque and reflexive flow.
2. Lead Insight — Market Inertia Gauge
Inertia at 59.8 reflects stability through compression, not expansion. Liquidity (62.0) and momentum (59.6) remain in lockstep, sustaining an efficient energy loop between execution flow and price transmission. Participation narrows, yet high-velocity rotation inside large-cap and AI-linked sectors offsets the loss of breadth.
When inertia holds above 58 with narrowing participation, the historical continuation probability remains near 60%, typically spanning a two-week persistence cycle with a +1% average drift. ETF liquidity improved +2.5% w/w, confirming that liquidity still absorbs stress faster than credit can transmit it.
Allocator Note: Operate within high-liquidity corridors; rebalance every 10–15 sessions. Use convex hedges opportunistically — volatility remains inexpensive but present. Maintain exposure where flow density is strong and crowding not yet reflexive.
Structural Takeaway: Market inertia remains positive — compression intact, liquidity dominant, torque contained. Continuation bias persists until either HY > 345 bps or breadth < 50%. Liquidity defines motion; credit defines the limit.
4. Component Deep Dive — Week-Over-Week Changes
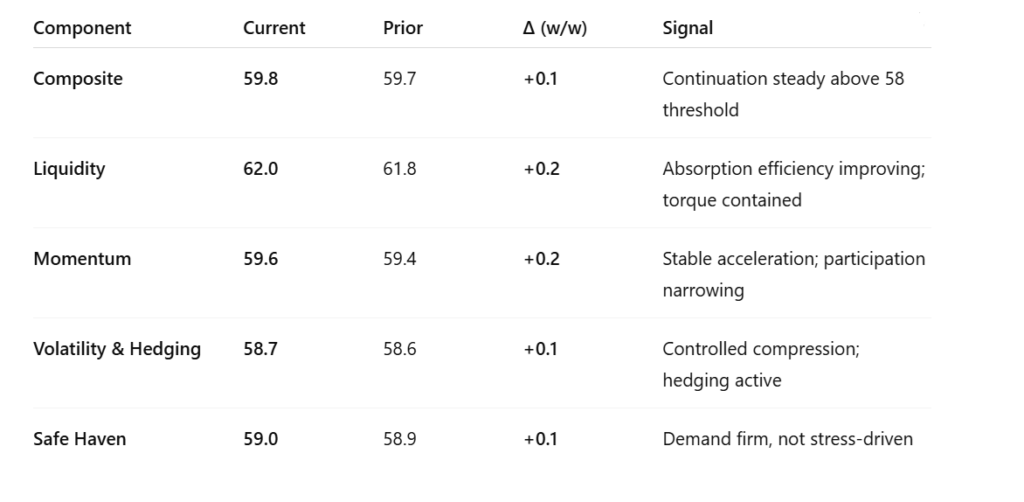
Signal: Liquidity and momentum remain synchronized — the FORCE-12 axis holds alignment. Absorption outpaces transmission; stress channels stay muted. Liquidity continues to cushion minor volatility pulses rather than amplify them.
Allocator Note: Add incrementally on shallow pullbacks within high-liquidity corridors. Maintain convex protection via duration and IG overlays; use gold as a tail hedge, not a core position.
Structural Takeaway: Liquidity spine intact, torque moderated. Continuation bias persists unless HY > 345 bps or breadth < 50%. The system remains self-stabilizing — efficient, but energy-intensive.
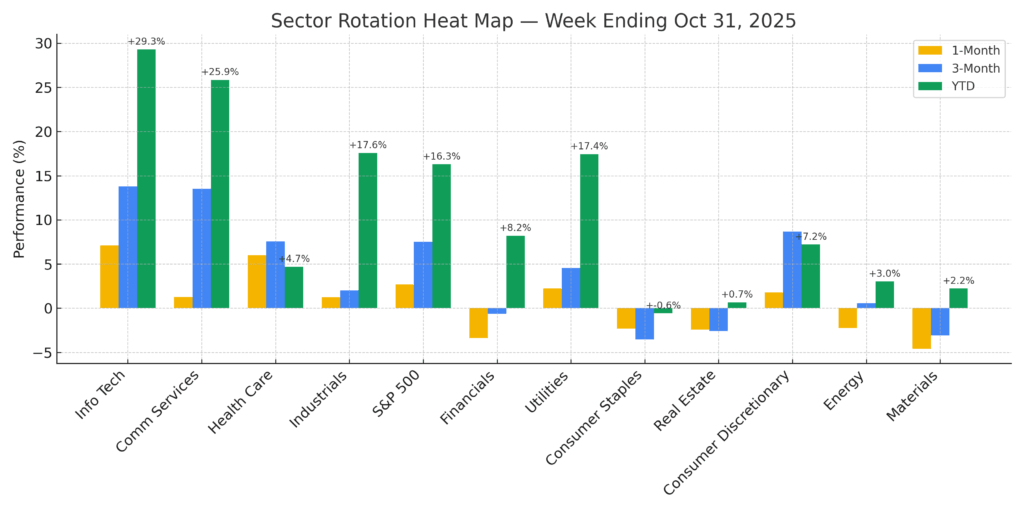
5. Sector Rotation & Positioning
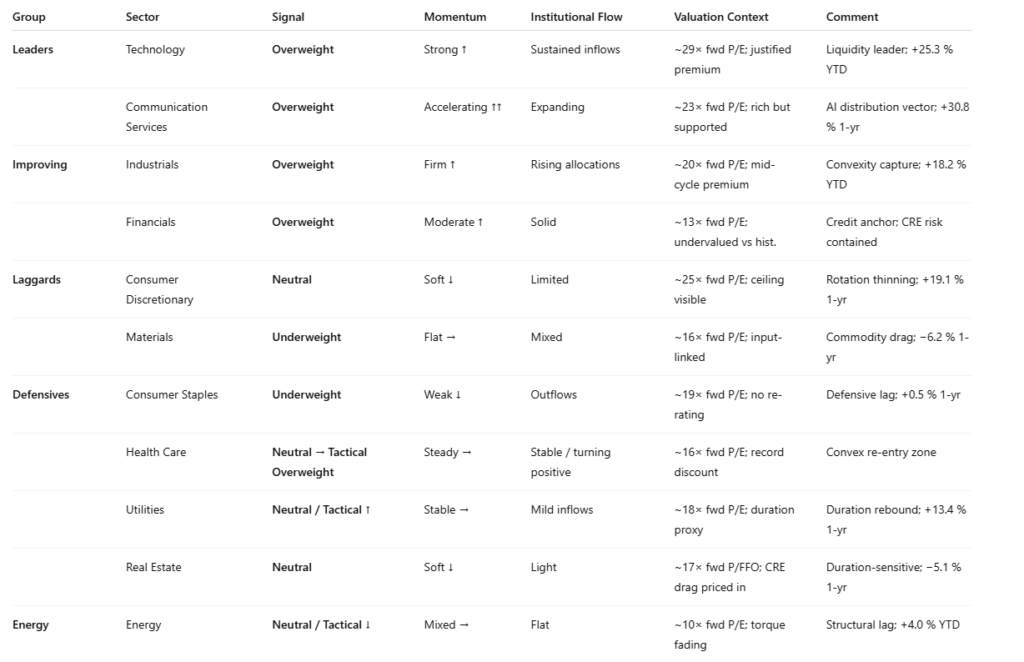
Signal: Growth and cyclicals continue to carry market torque. Technology, Communication Services, Industrials, and Financials lead both liquidity flow and earnings momentum. Health Care is moving from laggard to tactical re-entry as valuations normalize and flows stabilize. Defensives and Energy remain soft as rotation favors liquidity-dense, earnings-strong sectors.
Allocator Note: Maintain overweight in growth and cyclicals, add tactical Health Care exposure, and stay underweight defensives and Energy. Use duration and IG carry as stabilizers while HY < 345 bps and breadth > 50%. Health Care offers the best near-term convexity under the 59.8 VMSI regime.
Structural Takeaway: Liquidity spine intact; rotation favors quality cyclicals.
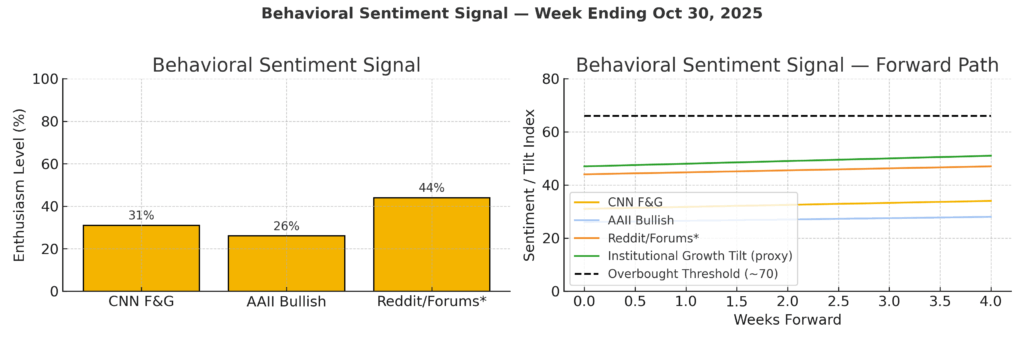
6. Sentiment Overview — Institutional Positioning & Market Psychology
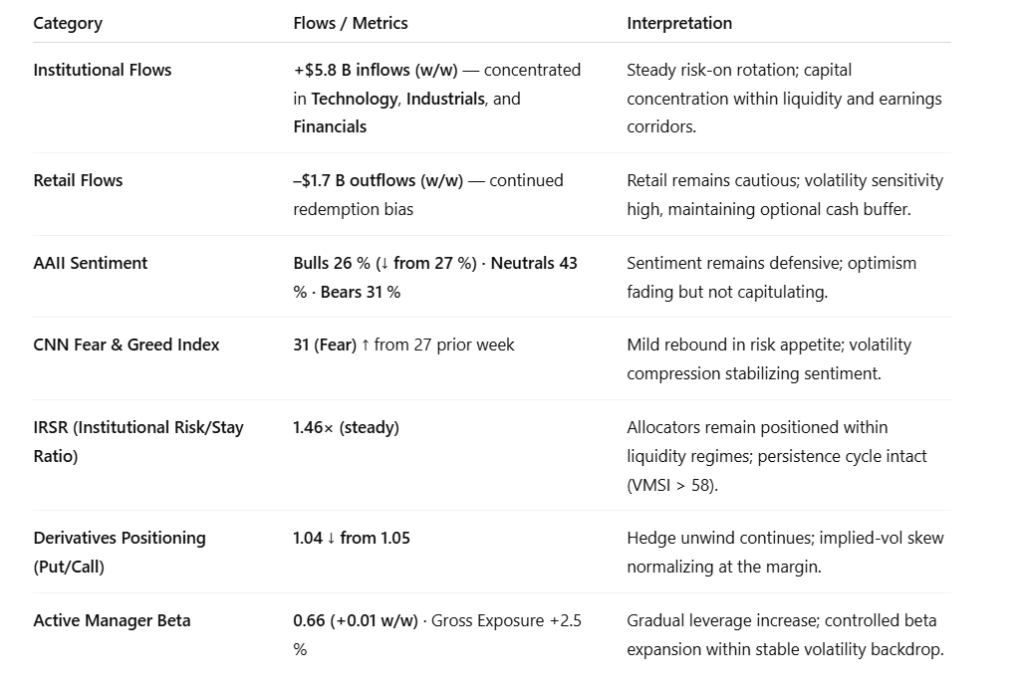
Signal: Institutional capital remains in control — positioning is disciplined, flow-driven, and concentrated in high-liquidity sectors. Retail sentiment stays defensive, acting as a stabilizer rather than a drag. Conviction asymmetry persists: institutions commit capital; retail holds optionality.
Allocator Note: IRSR ≈ 1.46× affirms structural persistence. Fade fear-based drawdowns; re-add exposure where liquidity density remains high and spreads stay stable (<345 bps).
Structural Takeaway: Liquidity continues to move through institutional channels — the hallmark of the late-compression phase. Retail caution provides volatility insurance; institutional allocation preserves directional inertia.
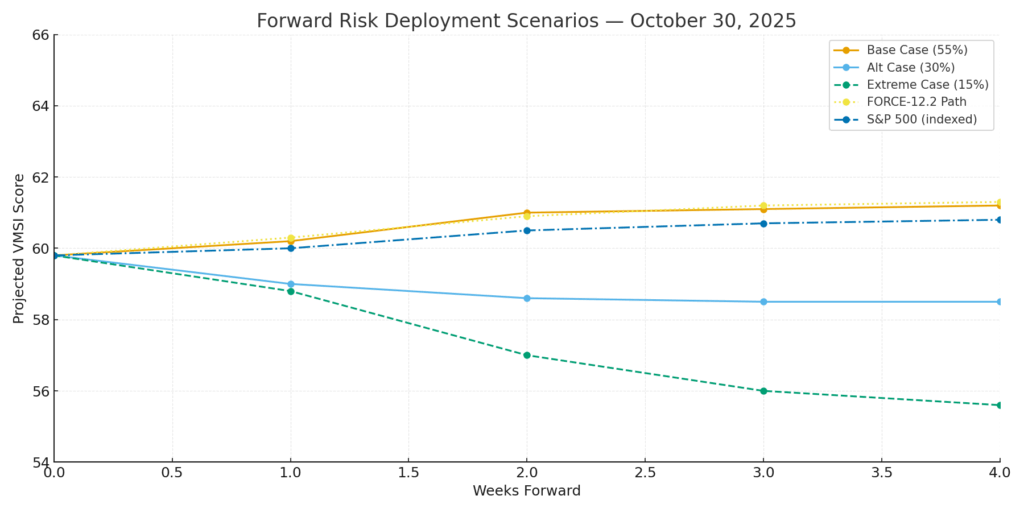
7. Predictive Outlook
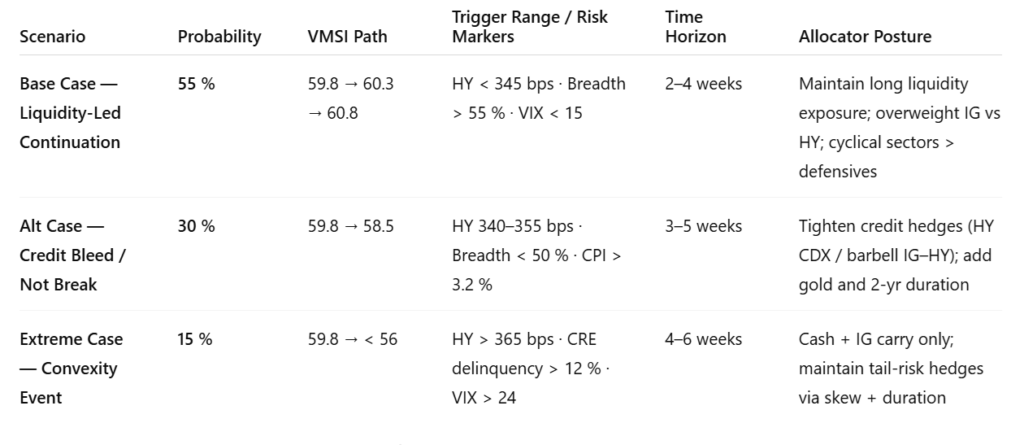
Base Case (55%) — Liquidity-Led Continuation FORCE-12.2 trajectory (59.8 → 60.8) signals ongoing absorption and stable execution capacity. VIX ≈ 14 keeps convexity contained. Probability ~65% that HY < 345 bps through mid-November, implying an S&P +2–3% drift. Policy inertia holds — no Fed action expected before December.
Allocator Note: Stay long IG credit, underweight HY pairs. Maintain Tech and Industrials beta, hedged with short-vol overlays. Duration provides convex carry as yields stabilize near 3.9%.
Alt Case (30%) — Credit Bleed / Not Break Trigger zone: HY 340–355 bps · Breadth < 50% · CPI > 3.2%. Credit torque rising (+0.3σ) as liquidity elasticity declines (−0.4σ). Model shows 25–30% probability of HY-breadth divergence within four weeks. Allocator Note: Tighten credit hedges; barbell IG–HY; add gold and 2-year duration overlays.
Extreme Case (15%) — Convexity Event Stress path: HY > 365 bps · CRE delinquency > 12% · VIX > 24. Regional bank stress localized but trending (+15 bps q/q). Model probability of reflexive break within six weeks ≈ 8%; equity drawdown −5 to −8%. Allocator Note: Hold cash and IG carry; preserve tail-risk hedges via S&P skew and long duration.
Timing Window: Torque-inflection probability >30% by mid-November if HY > 345 bps and breadth < 50%. Liquidity compression (−2.8% efficiency w/w) remains absorptive but decaying.
Structural Takeaway: Liquidity buys time; credit still prices the future. The system remains compressive, not reflexive. Optionality is cheap, duration is protective, and credit remains the hinge for the next regime shift.
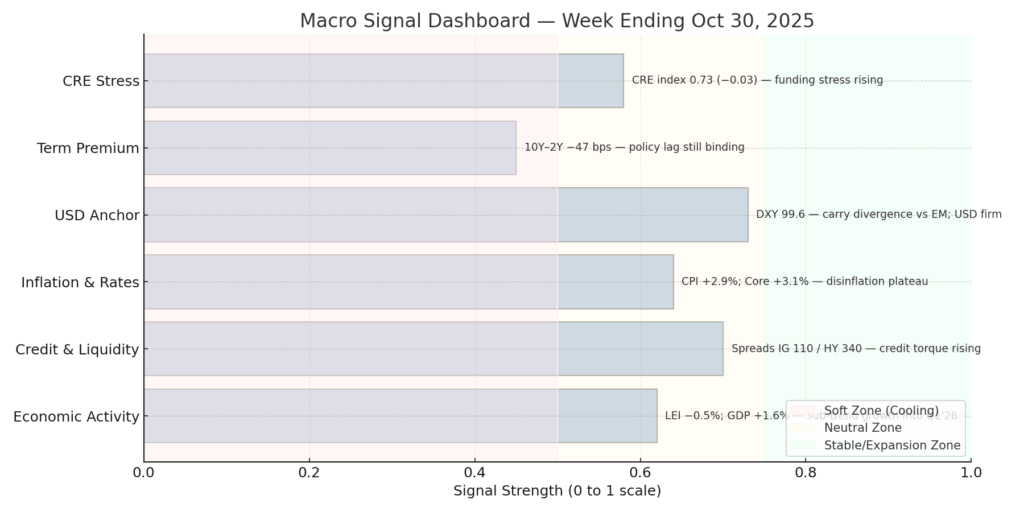
8. Macro Signals Snapshot
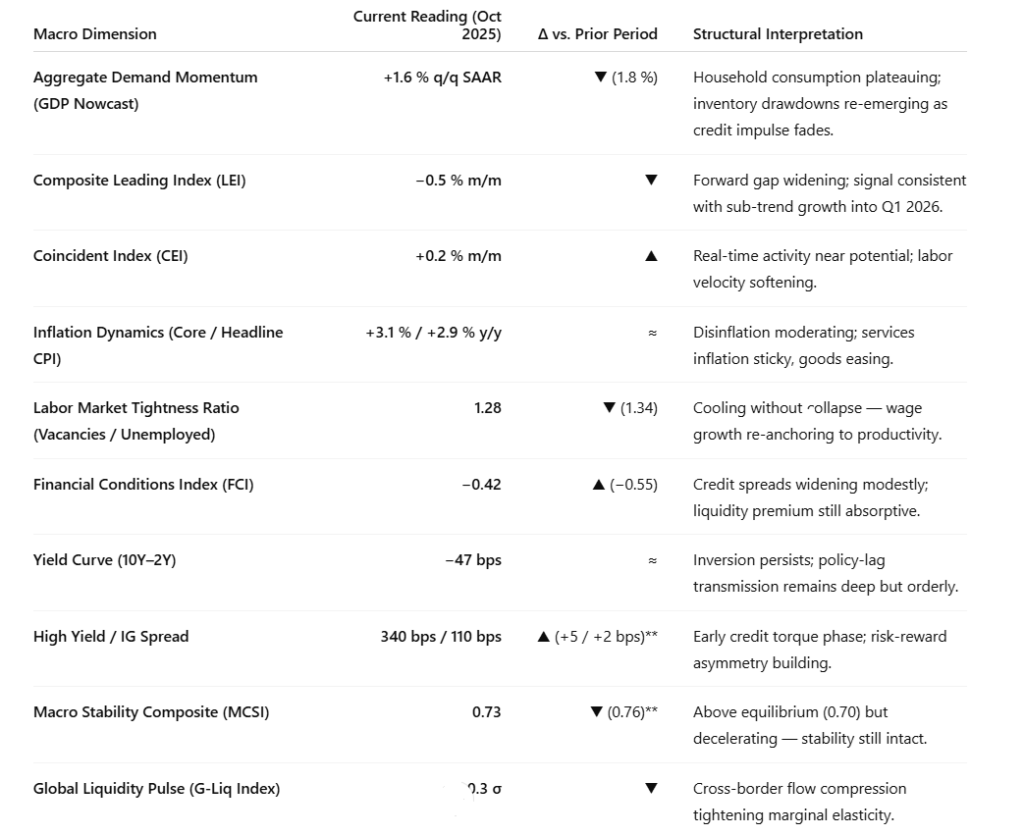
Signal: Macro tone steady, not strong — growth is flattening, not faltering. Liquidity remains functional, credit tightens slowly, and inflation progress stalls near the policy comfort band. The system continues to operate in credit-constrained equilibrium, not stress.
Allocator Note: Maintain moderate exposure while MCSI > 0.70; bias toward IG carry, quality duration, and high-liquidity cyclicals. Fade over-tightening risk premiums if HY < 345 bps.
Structural Takeaway: The macro regime has shifted from liquidity-led resilience to credit-defined persistence — the pre-convex phase where policy lag and tightening torque converge.
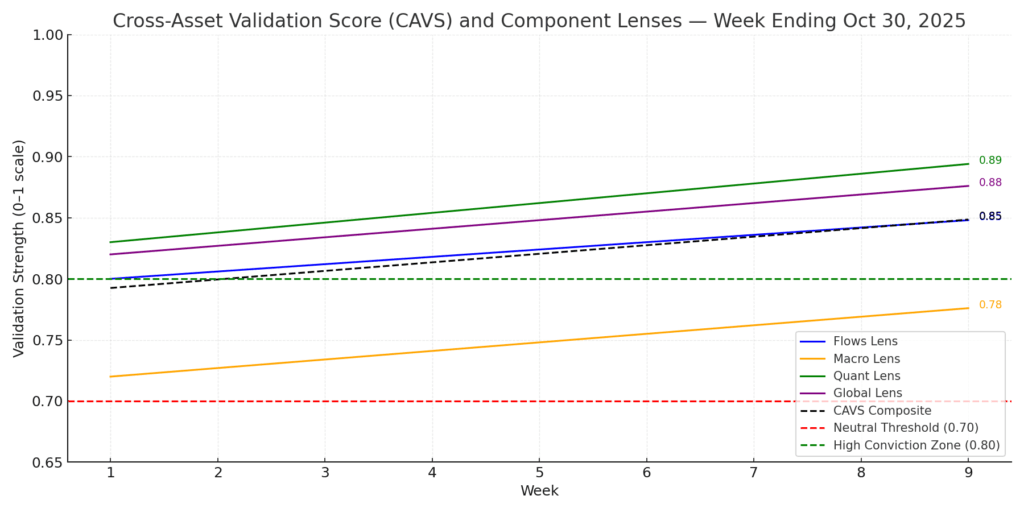
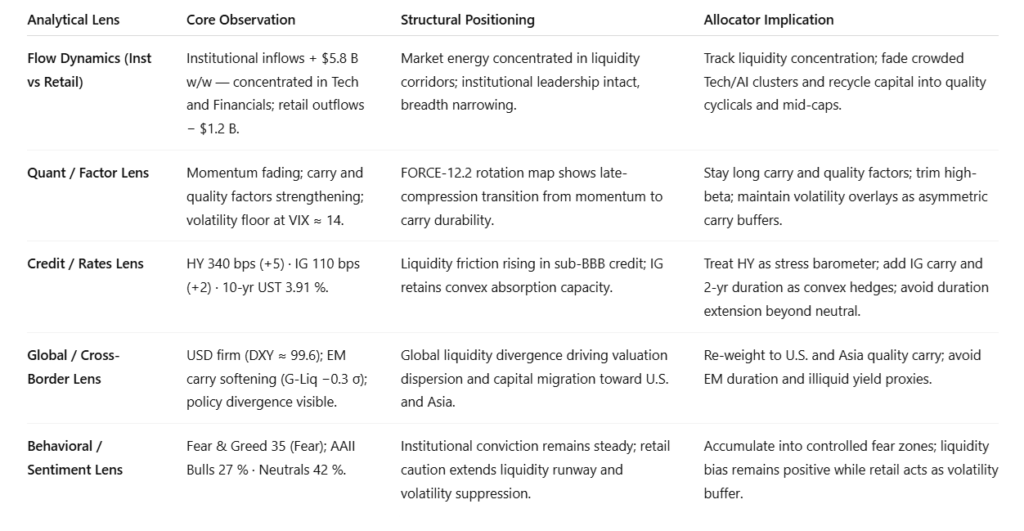
9. Strategic Layers — Multi-Lens Integration
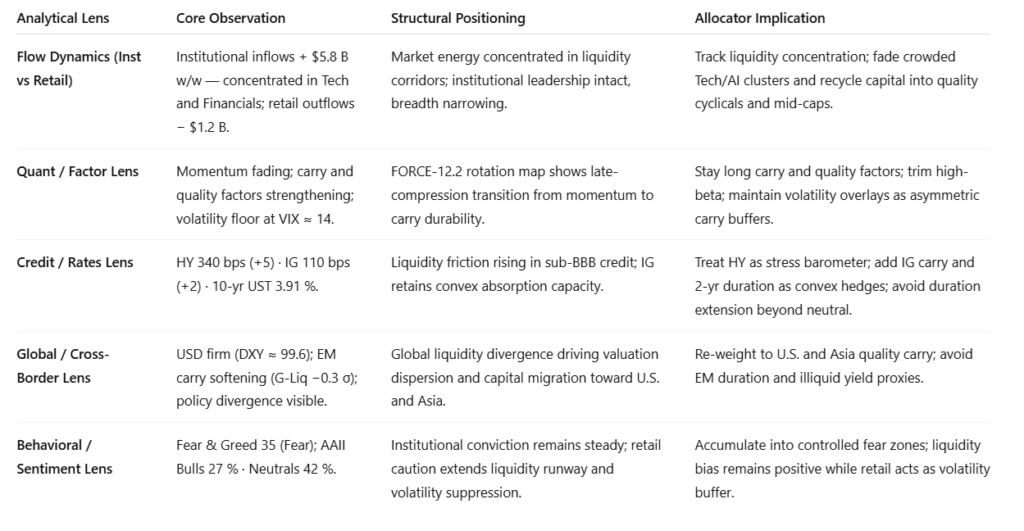
Signal: Cross-lens reinforcement holds. Institutional flows and quality carry offset macro softening. Credit torque is rising but orderly. Liquidity continues to define equilibrium structure.
Allocator Note: CAVS = 0.83 (>0.80) — exposures remain scalable with discipline. Add risk on stress; trim into momentum. Preserve convexity via IG carry, gold, and long duration.
Structural Takeaway: Liquidity anchors persistence; credit sets the boundary. Compression holds; convexity waits.
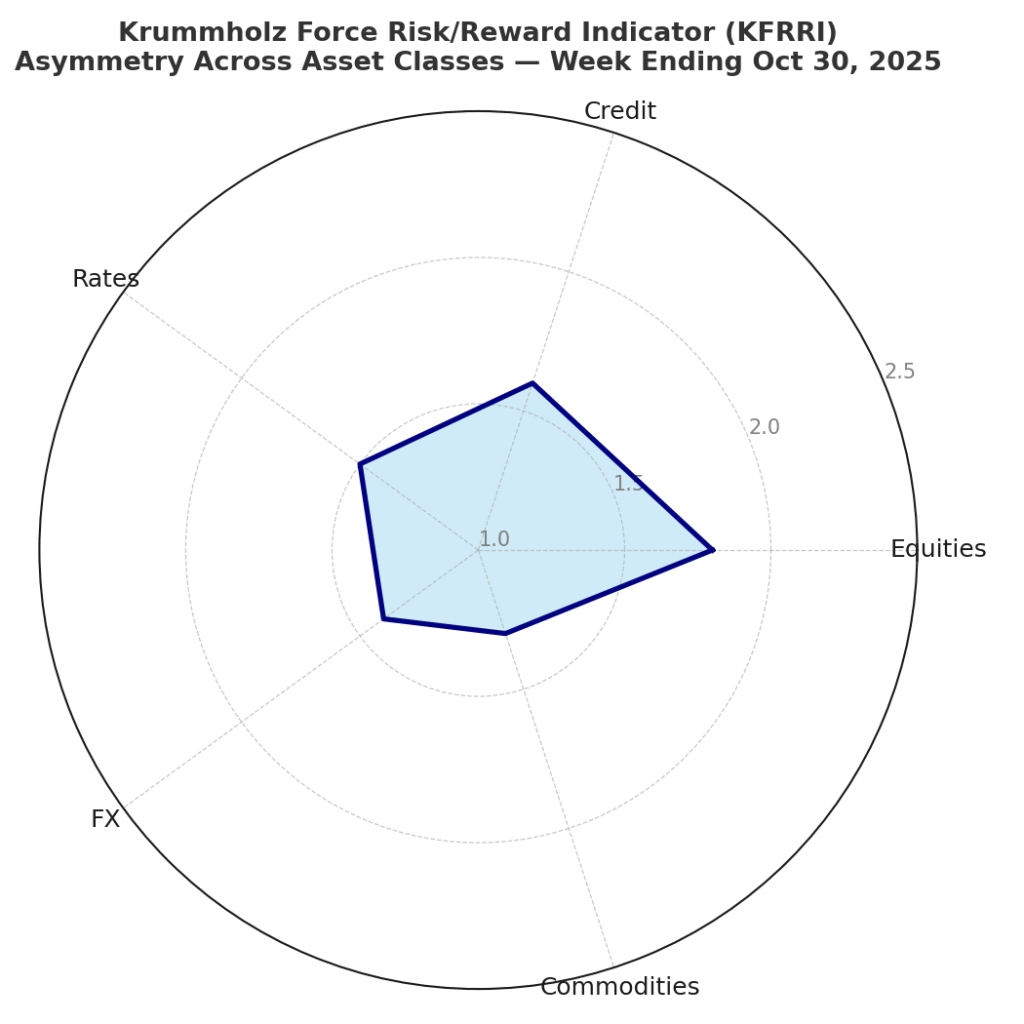
10. Institutional Opportunities
Signal: Cross-asset asymmetry remains investable, but dispersion is widening. Liquidity continues to absorb stress efficiently, while credit torque defines opportunity boundaries.
Allocator Note: Scale risk through overlay structures, not gross exposure. Concentrate convex capture in Industrials, Financials, IG credit, and gold; maintain duration as a stabilizing convex layer.
Structural Takeaway: Liquidity sustains convexity, but the fulcrum has shifted. The late-compression regime now rewards precision and structural discipline — persistence is investable only through asymmetric construction.
Final Word — The System That Buys Time for Itself
Markets still move, but the source of motion has changed. Liquidity no longer funds expansion; it funds endurance. The system’s reflexes — driven by AI flow, passive rebalancing, and rule-based execution — recycle capital faster than conviction can form. Each rotation sustains structure, but not belief.
Credit has become the constraint. Spreads remain tight, yet each basis point carries more torque. The surface is calm because liquidity still clears, but the cost of stability rises underneath. Time is being extended, not earned.
AI amplifies liquidity’s reach but not its depth. Execution is flawless, yet energy is increasingly self-referential — price chasing flow, flow chasing signal. The economy decelerates without disorder, but the feedback loop between liquidity and credit tightens.
This is the new equilibrium: a reflexive market that trades itself — efficient, compressed, dependent on time it did not create. Liquidity can still buy motion, but not momentum. Credit now decides how long the loop can last.
Liquidity sustains. AI accelerates. Credit concludes.
Why We Built VMSI™
VMSI™ doesn’t predict markets — it observes how conviction holds them together. Where most models chase price or sentiment, VMSI™ measures persistence: the strength that keeps motion from breaking when pressure rises.
Markets are not just numbers; they are expressions of belief under constraint. VMSI™ translates those pressures into structure — showing where confidence becomes stability and where credit begins to shape direction. Built on the basic laws of inertia, force, and friction, it turns behavior into something measurable and comparable.
This is not a forecast — it’s a framework: a way to read markets as living systems that think, adapt, and balance their own tension. When VMSI™ rises above anchor levels, it signals endurance, not exuberance — proof that liquidity still carries weight and conviction still has meaning.
Positioning Note: For institutional and private investors alike, VMSI™ offers a steady lens in volatile times. It distinguishes motion from noise, conviction from emotion, and structure from speculation.
Disclaimer: For informational purposes only — not investment advice or a solicitation. Views are as of publication and may change. Past performance is not indicative of future results.
© 2025 VICA Partners — VMSI Economic Physics Model