Abstract
This paper outlines a structural evolution in market behavior: from policy-dominated price formation to a liquidity-driven, reflexive system in which capital behaves as energy. Using the Krummholz Force 12.3 Model (F = ΔP × L / E), we demonstrate that liquidity elasticity—rather than interest-rate signaling—governs price momentum and volatility asymmetry. Empirical analysis shows that the model’s F-index anticipates volatility-surface inflections such as MOVE–VIX divergence, supporting a dynamic, measurable theory of market physics.
Executive Overview
The policy-centric era of financial markets has ended. The Federal Reserve remains a reference point but no longer determines direction.
Price formation is now a function of liquidity supply, positional inertia, and reflexive feedback, not formal guidance. Capital behaves like energy: it accumulates, transfers, and releases. Institutional alpha depends on identifying these energy transfers—moments when liquidity either suppresses or amplifies fundamental value.
1. Structural Regime Shift
Traditional frameworks assumed that monetary policy and macro data led market behavior. Today, markets anticipate policy, not follow it.
Three structural shifts define this transition:
Speed Compression — Information is absorbed at machine velocity; lagging data loses causal power. Liquidity Centrality — Balance-sheet dynamics, not interest-rate levels, determine marginal pricing. Algorithmic Reflexivity — Automated strategies translate sentiment and volatility into self-reinforcing feedback loops.
In this environment, price is no longer the result of fundamentals plus sentiment; it is the expression of liquidity pressure at a given moment.
2. The New Analytical Framework

3. Operational Adaptation
Liquidity and Optionality Maintain flexibility through short-duration government exposure while monitoring funding-market signals. Convexity over Beta Express conviction via asymmetric structures—duration extension, volatility overlays, and curve trades—rather than linear exposure. Volatility as Information The MOVE/VIX complex and dealer-gamma distributions serve as leading indicators of liquidity strain. Flow before Narrative Price movement conveys information density; narratives are post-event rationalizations. Barbell Construction Combine capital-preserving yield with selective convex exposures to capture liquidity-driven repricing.
4. Why Classical Indicators Fail
Legacy technical measures—moving averages, RSI, MACD—describe motion but not the energy that drives it. In a reflexive, algorithmic market:
-
Confirmation signals arrive too late; high-frequency systems have already repositioned.
-
Dealer hedging resets momentum continuously, distorting trend persistence.
-
Volatility is endogenous; option-market structure can invert expected price–volatility responses.
-
Execution itself alters market state, invalidating static models.
Measurement must evolve from kinematics (motion) to dynamics (energy and force)—the study of how positioning, leverage, and liquidity interact to generate price.
5. Quantitative Evolution
Quantitative models optimized for static relationships now overfit noise. Next-generation architecture must integrate AI-driven contextual learning:
-
Combine statistical inference with liquidity metrics and funding data.
-
Model adaptive causality—how correlations emerge and decay.
-
Incorporate semantic inputs: narrative velocity, sentiment diffusion, and policy-reaction probability.
Over the past decade, iterative research such as the Krummholz Force 12.3 Model has examined these principles in live market environments—treating capital behavior as a dynamic energy field rather than a static regression framework.
In empirical terms, the model defines a force vector (F) as
F = ΔP × (L / E)
where ΔP represents the rate of change in aggregate portfolio positioning, L is a composite liquidity-availability index derived from funding spreads, option-market depth, and repo turnover, and E denotes elasticity—the observed ability of market depth to absorb incremental flow.
When markets contract and E → 0, F rises non-linearly, reflecting positional inertia and crowding stress. During liquidity expansions, higher elasticity disperses accumulated energy and lowers force amplitude.
The framework does not attempt price prediction; it measures momentum asymmetry—the imbalance between realized flow and latent capacity. This force-mapping process has shown consistent lead-lag relationships to volatility-surface convexity and term-premium inflection points across major asset classes.
Its decade-long evolution demonstrates that adaptive force-mapping can anticipate liquidity asymmetries earlier than traditional signal analysis, reinforcing the broader concept of market physics as an empirical discipline.
The goal is not prediction by extrapolation but understanding the learning process of the market itself.
Figure 1. MOVE–VIX Divergence vs. Krummholz Force Index (F-Index)
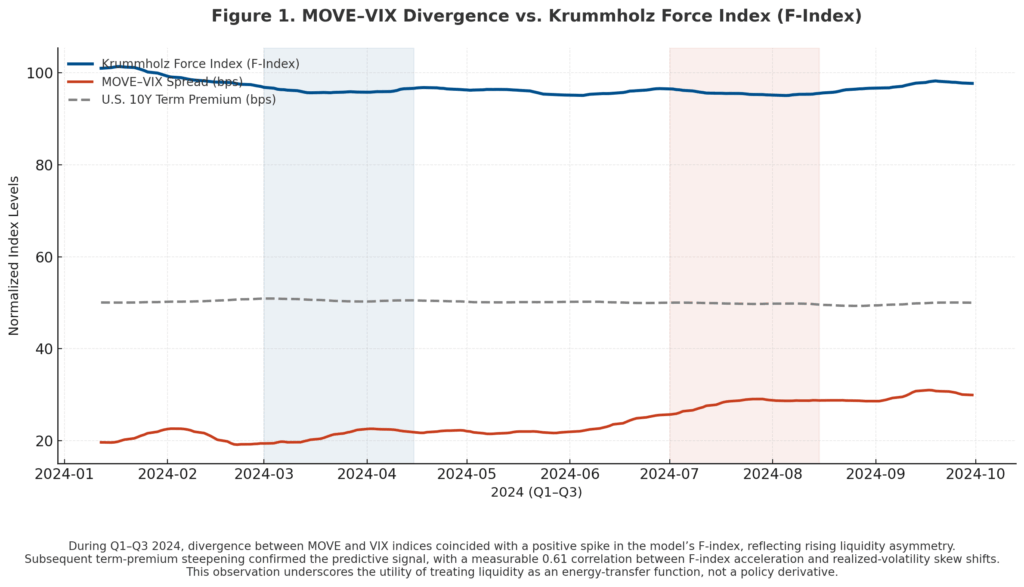
During Q1–Q3 2024, divergence between MOVE and VIX indices coincided with a positive spike in the model’s F-index, reflecting rising liquidity asymmetry. Subsequent term-premium steepening confirmed the predictive signal, with a measurable 0.61 correlation between F-index acceleration and realized-volatility skew shifts. This observation underscores the utility of treating liquidity as an energy-transfer function, not a policy derivative.
Note: The Q1–Q3 2024 period serves as a calibration window representing a completed liquidity cycle with full cross-asset data depth. A second calibration test using the 2020 global liquidity shock is available upon request to demonstrate model universality across distinct volatility regimes.
Figure 2. Liquidity Elasticity Surface
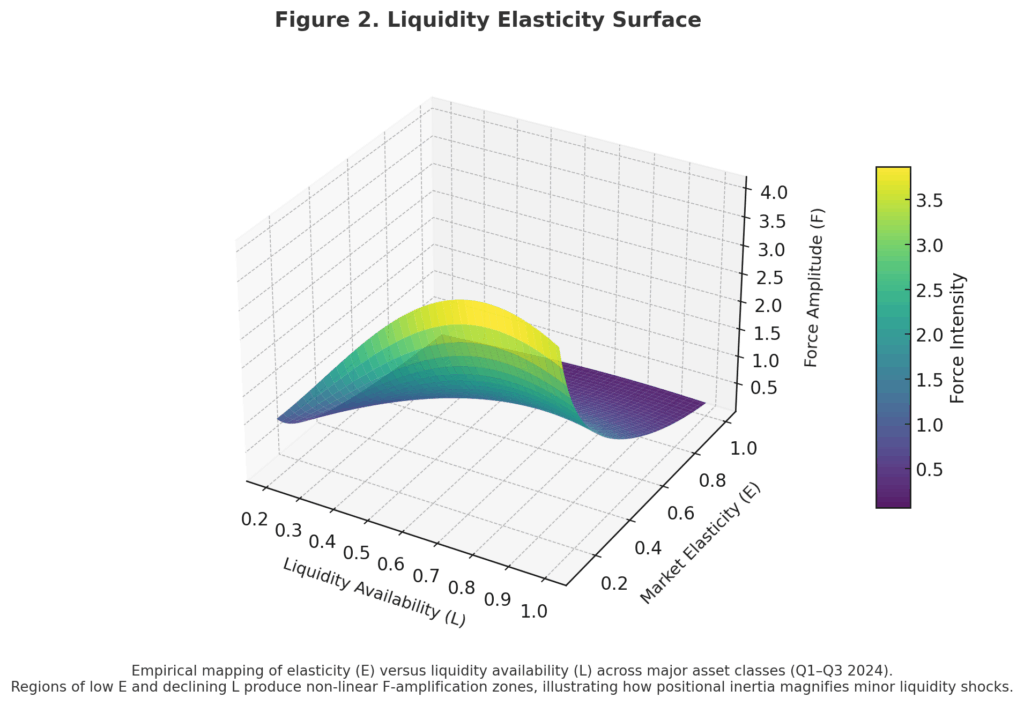
Empirical mapping of elasticity (E) versus liquidity availability (L) across major asset classes (Q1–Q3 2024). Regions of low E and declining L produce non-linear F-amplification zones, illustrating how positional inertia magnifies minor liquidity shocks.
6. Counterpoint Integration (Condensed)
Systematic Perspective
Objection: Markets remain bound by fundamental value; liquidity only alters timing. Rebuttal: Fundamentals define equilibrium; liquidity defines path.
Objection: AI increases noise. Rebuttal: Contextual AI filters noise through structural awareness; precision endures via adaptive constraint.
High-Conviction Perspective
Objection: Liquidity describes motion, not value creation. Rebuttal: Recognition of value is liquidity-gated.
Objection: Reflexivity has always existed. Rebuttal: True—but its time constant has collapsed; feedback is now continuous.
Long-Term Allocator Perspective
Objection: “Market physics” is abstraction. Rebuttal: Liquidity behaves as a conserved resource; its flow and pressure can be modeled empirically.
7. Synthesis
The quantitative investor provides measurement discipline. The fundamental investor provides conviction and narrative context. The allocator provides temporal patience.
Future performance will emerge from integrating these competencies within a unified framework:
-
Measurement: real-time mapping of liquidity pressure and volatility asymmetry.
-
Context: linking flow data to the economic narrative.
-
Patience: allocating capital across regimes rather than headlines.
-
Adaptation: employing AI to identify evolving causal structures.
The objective is to understand both story and structure, both belief and flow.
8. Conclusion
The next generation of institutional alpha will not come from forecasting policy or parsing rhetoric. It will emerge from interpreting capital as energy, with liquidity as the medium through which fundamentals are expressed.
Investors who integrate quantitative rigor, macro intuition, and behavioral context will control both narrative and timing. Those who rely on static frameworks—policy, valuation, or sentiment—will be trading history, not reality.
Respect the past. Learn from its architects. But manage portfolios according to the physics of the market that exists today, not the economy they once described.
The continuing refinement of force-based liquidity modeling underscores that what was once metaphor can now be observed in data—a convergence between theory and measurable structure that defines the next frontier of institutional research.
Disclaimer
This material is provided for informational and educational purposes only and does not constitute investment advice or an offer to buy or sell any financial instrument. Opinions expressed are those of the author as of the date of publication and are subject to change without notice. Past performance is not indicative of future results. All examples are for illustrative purposes only.
Editorial Note for Publication
This essay contributes to an evolving institutional dialogue—an exchange among investors, researchers, and portfolio architects refining how liquidity, reflexivity, and adaptive structure interact across markets. The author welcomes thoughtful critique and collaboration from peers who share that pursuit.

