GOVERNMENT REPORT SERIES
What the PCE tells US is…. reflecting shifts that consumers are making to adjust for those higher prices.
New U.S. data for May showed mitigating relief from the record pace of inflation pushing the Federal Reserve toward another interest rate increase next month, however even pundits believe that the bottom is near.
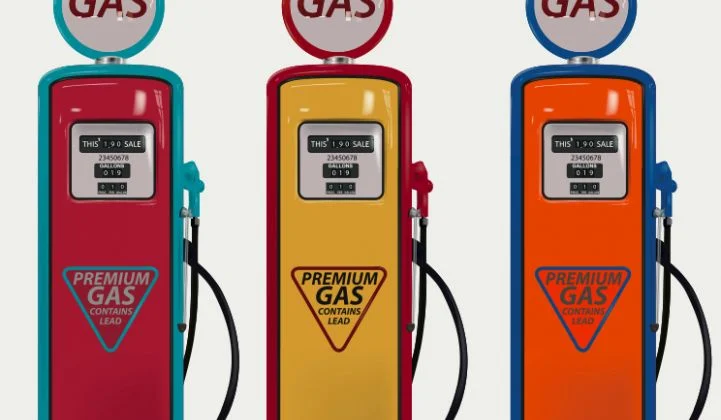
The PCE price index for May increased 6.3 percent from one year ago, reflecting increases in both goods and services. Energy prices increased 35.8 percent while food prices increased 11.0 percent. Excluding food and energy, the PCE price index for May increased 4.7 percent from one year ago.
Personal Income and Outlays, May 2022
Personal income increased$113.4 billion (0.5 percent) in May, according to the Bureau of Economic Analysis. Disposable personal income (DPI) increased$96.5 billion (0.5 percent) and personal consumption expenditures (PCE) increased$32.7 billion (0.2 percent).
Real DPI decreased 0.1 percent in May and, Real PCE decreased 0.4 percent; goods decreased 1.6 percent and services increased 0.3 percent.
The increase in personal income in May primarily reflected increases in compensation and proprietors’ income that were partly offset by a decrease in government social benefits. Within compensation, the increase reflected increases in both private and government wages and salaries. The increase in proprietors’ income was led by nonfarm income. The decrease in government social benefits primarily reflected a decrease in “other” benefits that was partly offset by increases in Medicaid and Medicare. Within “other” benefits, the decrease primarily reflected a decline in transfers to nonprofit health care providers through the Provider Relief Fund.
The $32.7 billion increase in current-dollar PCE in May reflected an increase of $76.2 billion in spending for services that was partly offset by a decrease of $43.5 billion in spending for goods. Within services, increases in housing and utilities (led by housing), “other” services (led by international travel), and health care (led by hospitals) were the largest contributors. Within goods, a decrease in spending on motor vehicles and parts (led by new motor vehicles) was partly offset by an increase in gasoline and other energy goods (led by motor vehicle fuels).
Personal outlays increased$38.3 billion in May. Personal saving was $1.01 trillion in May and the personal saving rate—personal saving as a percentage of disposable personal income—was 5.4 percent.
The PCE price index for May increased 6.3 percent from one year ago, reflecting increases in both goods and services. Energy prices increased 35.8 percent while food prices increased 11.0 percent. Excluding food and energy, the PCE price index for May increased 4.7 percent from one year ago.

