Thursday, US Markets finished higher, S&P 500 +1.22%, DOW +1.26%, NASDAQ +1.15%. All 11 S&P 500 sectors advancing: Health Care +1.55% outperforms/ Real Estate +0.34% lags. On the upside, S&P Banking ETF (KRE), IPO’s, Gold, Bitcoin, Oil Brent and the Bloomberg Commodity Index. In economic news, initial claims remained flat with last week, headline retail sales was better than expected. Regional surveys were mixed, Empire beats while Philly Fed misses. Import /export prices both fell during the month.
Overnight/US Premarket, Asian markets finished higher, Hong Kong’s Hang Seng+1.07%, Japan’s Nikkei 225 +0.66%, China’s Shanghai Composite +0.63%. European markets finished higher, France’s CAC 40 +1.34%, Germany’s DAX +0.41%, London’s FTSE 100 +0.19%. S&P futures were trading at 0.3% above fair-value.
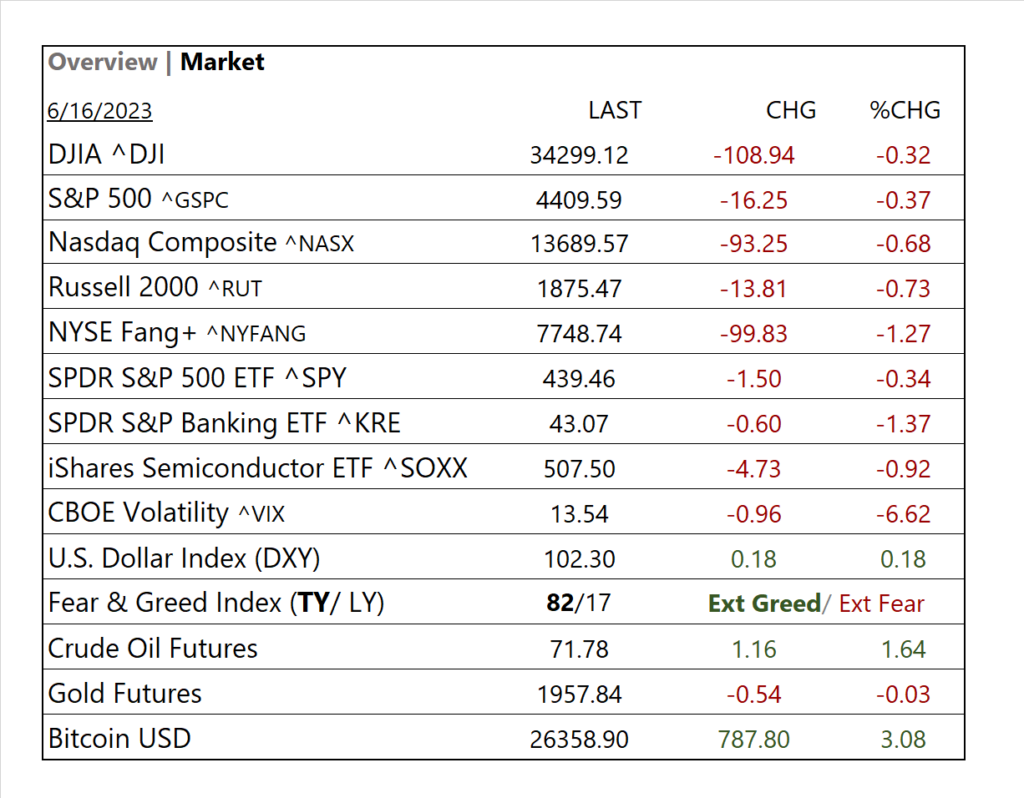
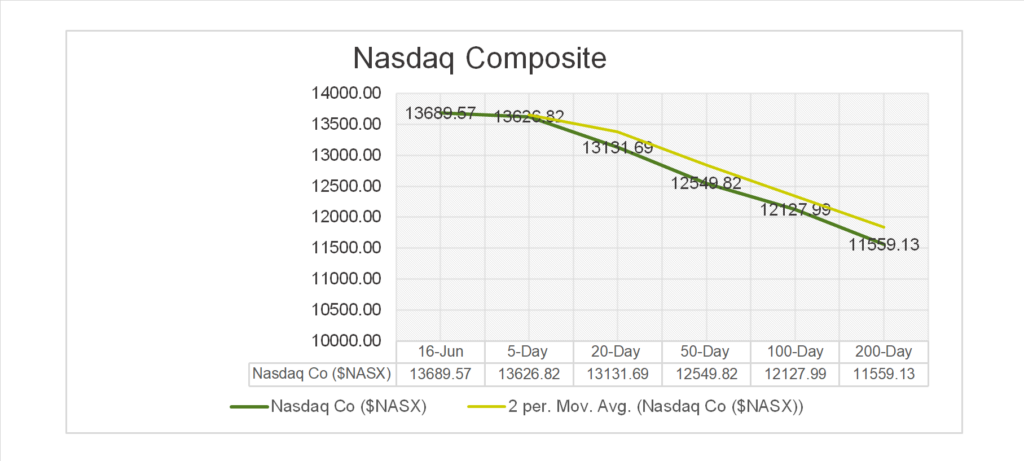
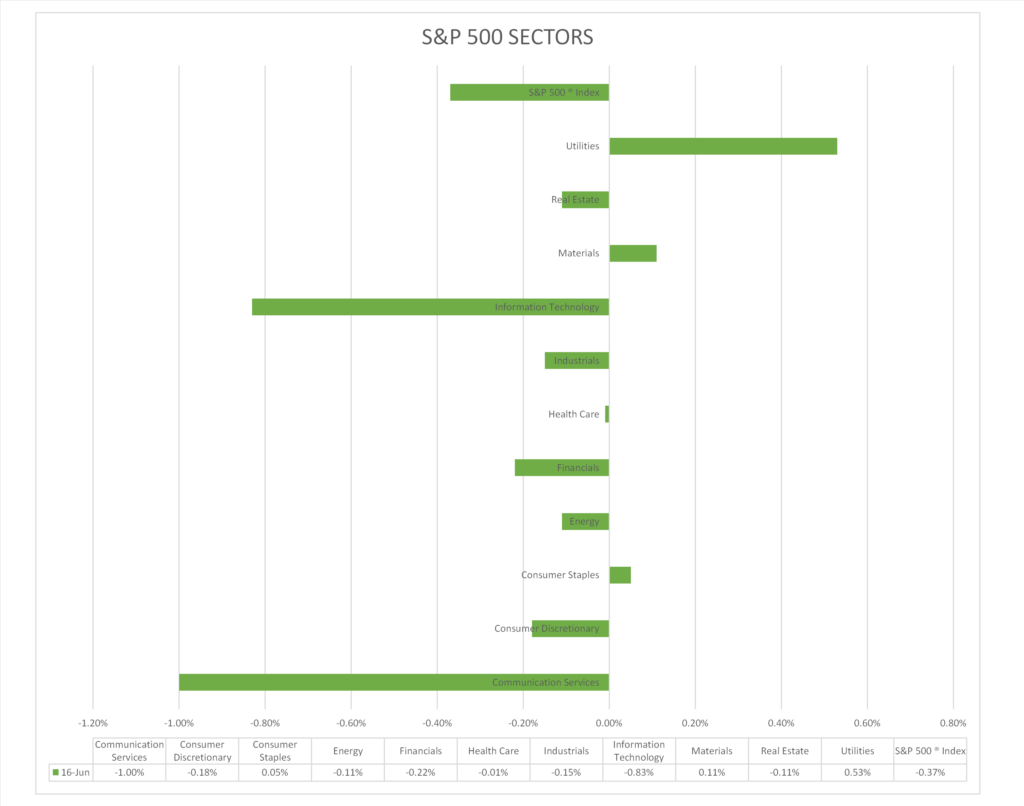
Today US Markets finished lower, S&P 500 -0.37%, DOW -0.32% and the Nasdaq -0.68%. 8 of 11 of the S&P 500 sectors declining: Utilities +0.53% outperforms/ Communication Services -1.00% lags. On the upside, Treasury Yields, USD Index, Bitcoin, Oil and the Bloomberg Commodity Index. In economic news, U of Mich. Sentiment beats as consumers more upbeat on inflation.
Takeaways
- Triple Witch expiration day
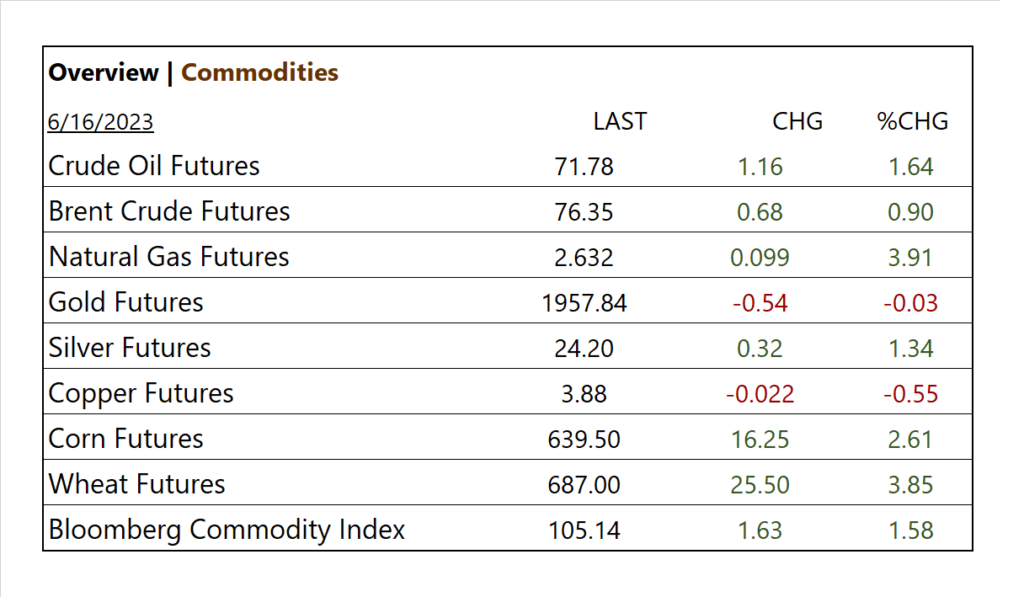
- China stimulus boosts metals markets
- Consumers more upbeat on inflation
- 8 of 11 of the S&P 500 sectors declining: Utilities +0.53% outperforms/ Communication Services -1.00% lags.
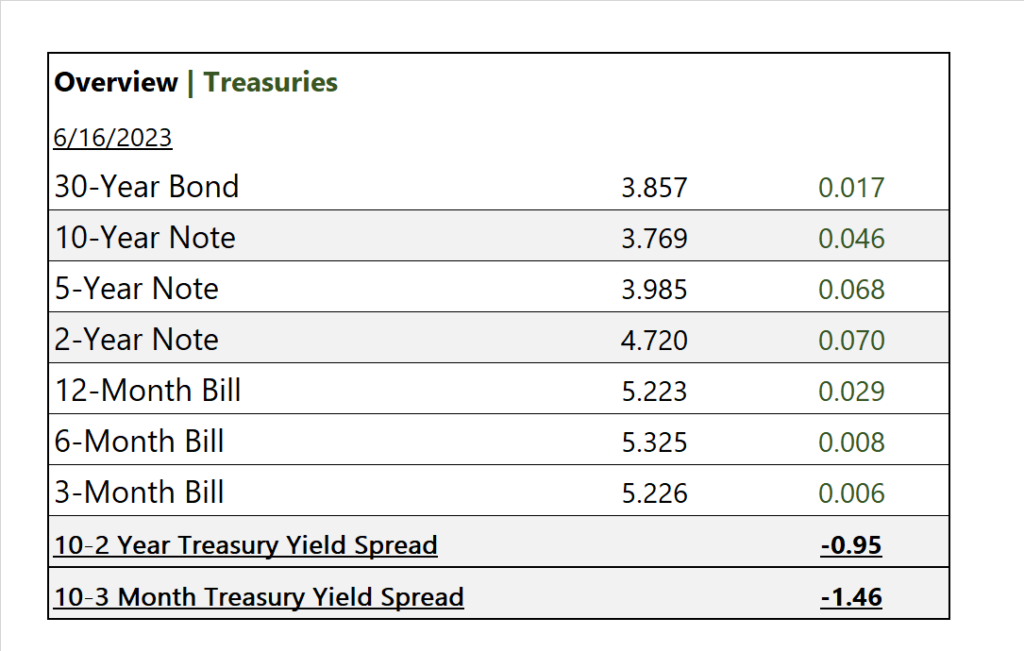
- Treasury Yields rise
- Oil +up
- Drilling stocks got hammered
- Inversion curve increasing/ 10-2year -0.95, 10– 3m -1.46
- Expect some market volatility over a pending Fed July hike
Pro Tip: “Triple Witching Day,” aka “Triple Witching Hour” is a term used in financial markets to describe three types of derivatives contracts expire: stock index futures, stock index options, and stock options. It typically occurs on the third Friday of the months of March, June, September, and December. Its lead to increased trading activity and volatility!
Sectors/ Commodities/ Treasuries
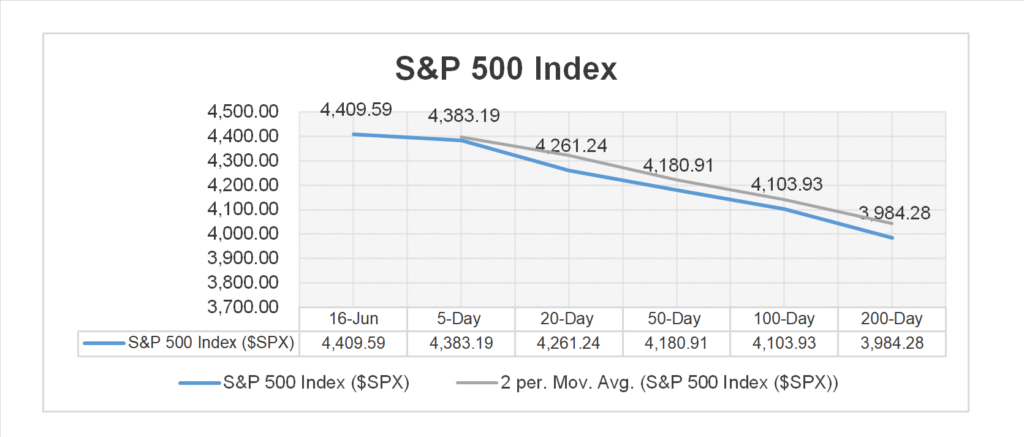
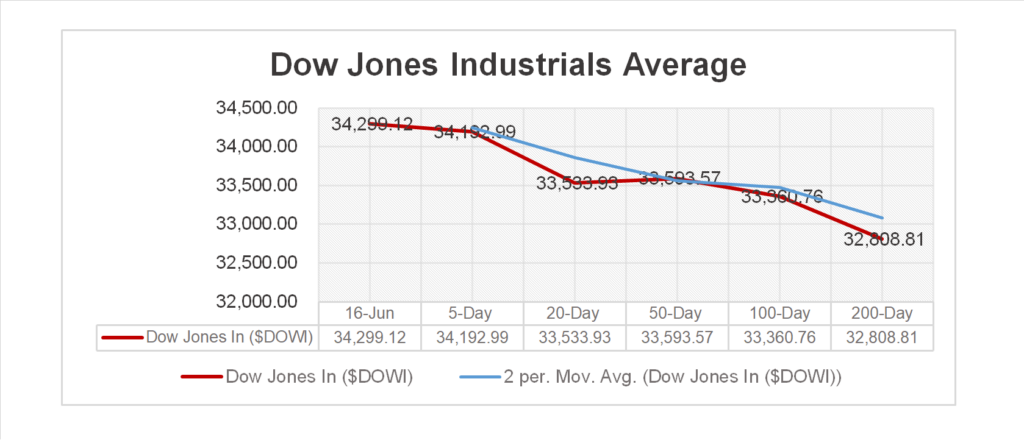
Key Indexes (5d, 20d, 50d, 100d, 200d)
S&P Sectors
- 8 of 11 of the S&P 500 sectors declining: Utilities +0.53% outperforms/ Communication Services -1.00%, Information Technology -0.83% lag.
Commodities
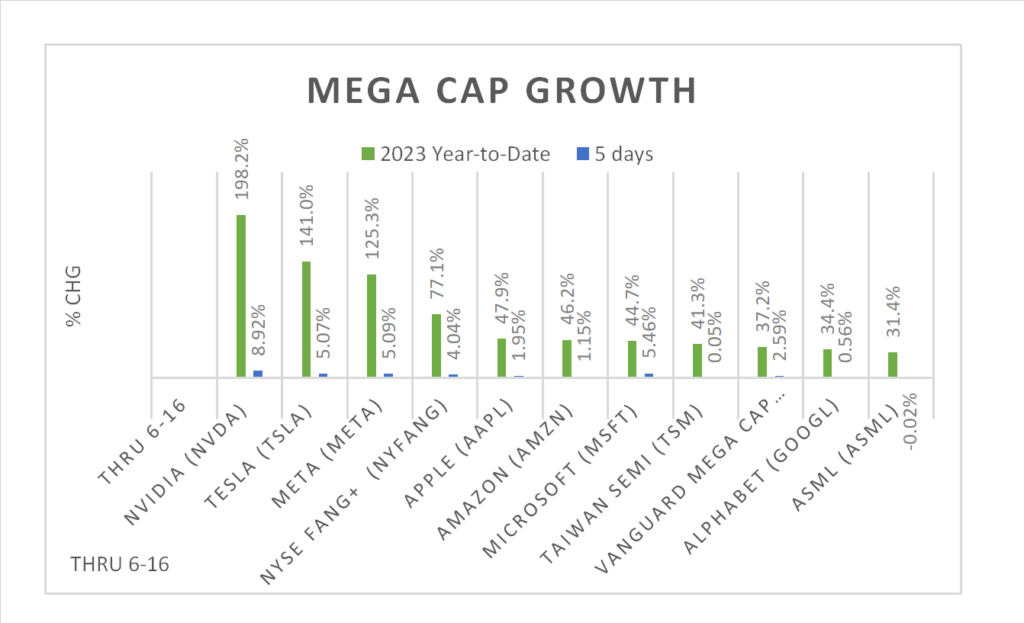
Factor/ Mega Cap Growth Chart (YTD)
US Treasuries
Notable Earnings Today
- +Beat:
- – Miss:
- Pending: Tesco PLC (TSCDY)
- * Strong support – NVIDIA (NVDA), Meta Platforms (META), Microsoft (MSFT), Alphabet (GOOG,GOOGL), Amazon (AMZN), Apple (AAPL), Tesla (TSLA), Taiwan Semi (TSM), ASML Holding NV (ASML), UI Path Inc. (PATH), Broadcom Inc (AVGO), Intel (INTC)
Economic Data
US
- Consumer sentiment; period June, act 63.9, fc 60.8m prior 59.2
Americans expect prices will rise at an annual rate of 3.3% over the next year, the lowest since March 2021- University of Michigan.
News
Company News
- Drilling Stocks Plunge on Bets for Oil Price Slump – WSJ
- Covid Boosters Should Be Updated to Target XBB Strain, US Health Advisers Say – Bloomberg
- Retailers Are Trying to Fix Their Supply-Chain Forecasts – WSJ
Energy/ Materials
- Gas Prices Ease as Americans Hit the Road for Summer Travel – WSJ
- A Cheap Fix to Global Warming Is Finally Gaining Support – Bloomberg
Central Banks/Inflation/Labor Market
- Richmond Fed’s Barkin Warns Against Ending Rate Hikes Too Soon – WSJ
- US Consumer Year-Ahead Inflation Expectations Lowest Since 2021 – Bloomberg
China/ Asia

