“Empowering Your Financial Success”
Daily Market Insights: October 16th, 2023
Global Markets Summary:
Asian Markets:
- Nikkei 225 (Japan): +1.12%
- Hang Seng (Hong Kong): +0.63%
- Shanghai Composite (China): -0.22%
US Futures:
- S&P Futures: opened @ 4342.37 (+0.34%)
European Markets:
- DAX (Germany): +0.34%
- FTSE 100 (London): -0.59%
- CAC 40 (France): -1.42%
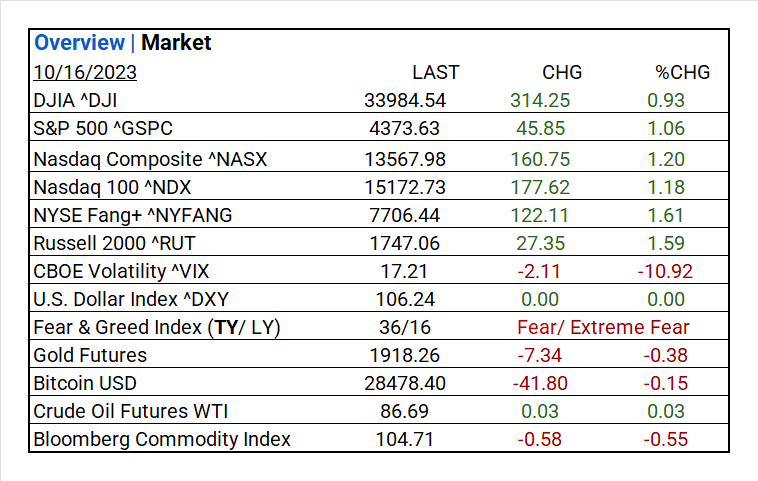
US Market Snapshot:
Key Stock Market Indices:
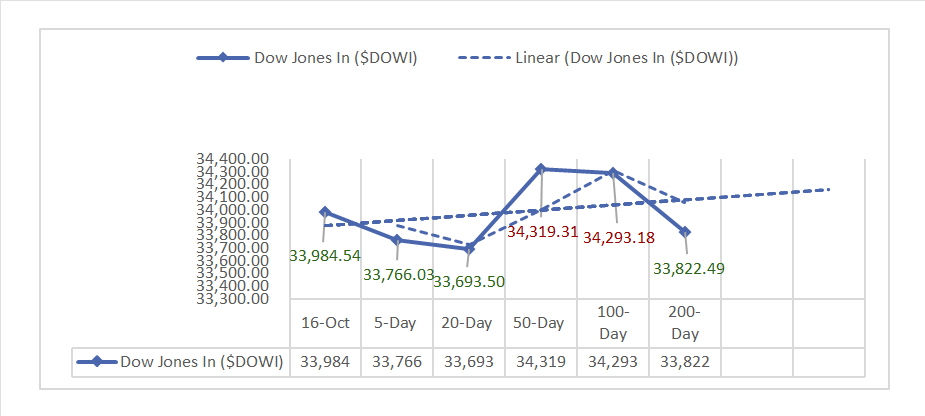
- DJIA ^DJI: 33,984.54 (+314.25, +0.93%)
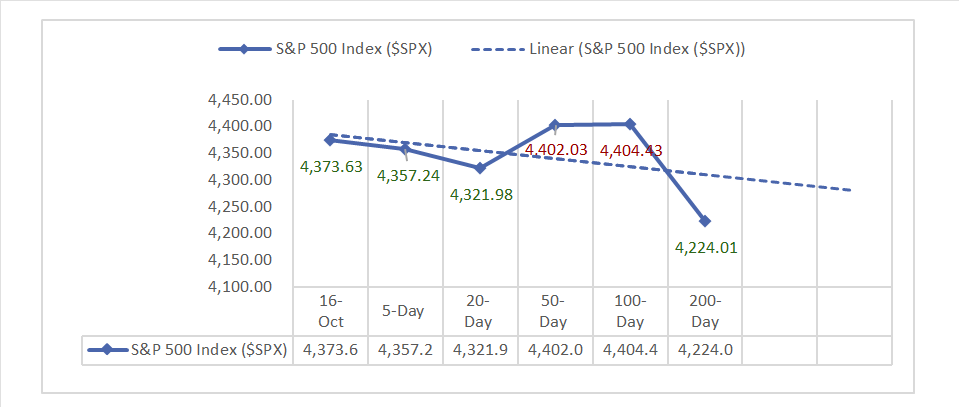
- S&P 500 ^GSPC: 4,373.63 (+45.85, +1.06%)
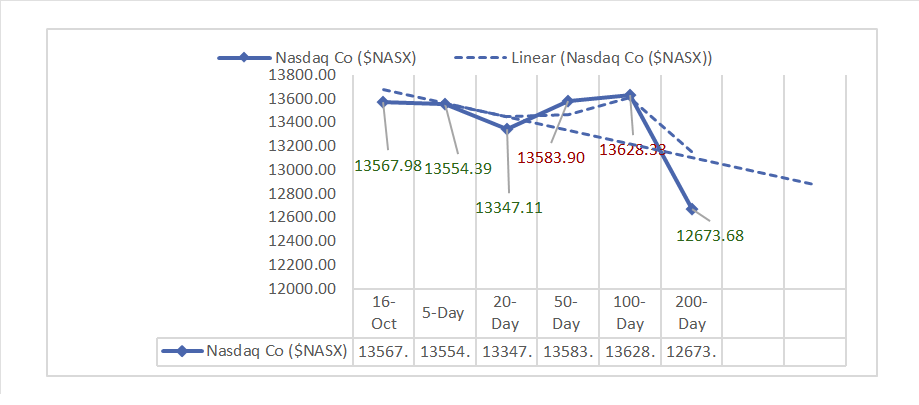
- Nasdaq Composite ^NASX: 13,567.98 (+160.75, +1.20%)
- Nasdaq 100 ^NDX: 15,172.73 (+177.62, +1.18%)
- NYSE Fang+ ^NYFANG: 7,706.44 (+122.11, +1.61%)
- Russell 2000 ^RUT: 1,747.06 (+27.35, +1.59%)
Market Insights: Performance, Sectors, and Trends:
- Economic Data: In October, the Empire Manufacturing Index came in lower than expected at -4.6, and a decline from the previous reading of 1.9.
- Market Indices: Major U.S. indices had positive gains: DJIA up 0.93%, S&P 500 up 1.06%, Nasdaq Composite up 1.20%, Nasdaq 100 up 1.18%, NYSE Fang+ up 1.61%, and Russell 2000 up 1.59%.
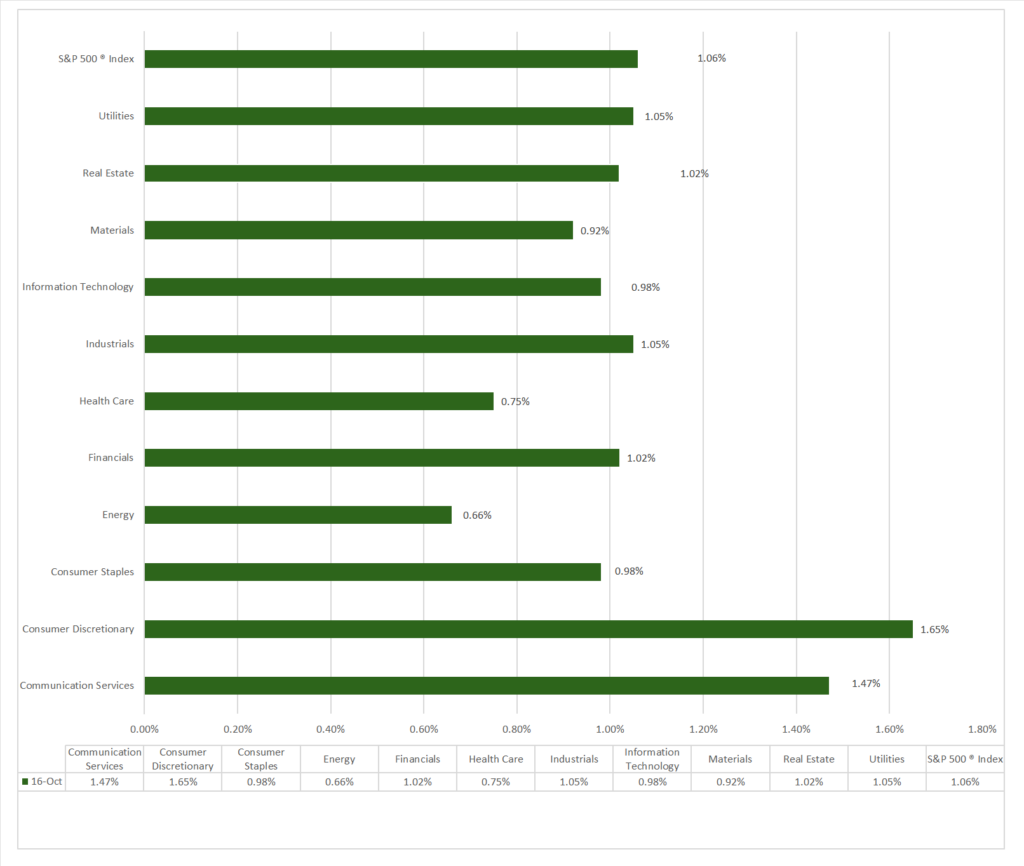
- Sector Performance: All sectors advanced, with Consumer Discretionary leading at (+1.65%), and Energy lagging at (+0.66%). Top industry: Independent Power and Renewable Electricity Producers (+4.18%).
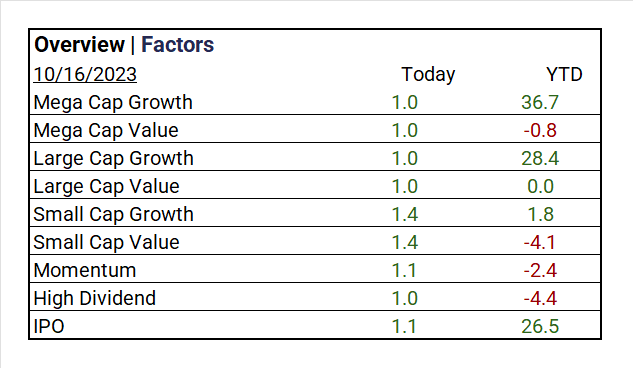
- Factors: Small Caps lead.
- Top ETF: Direxion Daily Semiconductor Bull 3X Shares ^SOXL +4.37.
- Worst ETF: ProShares Ultra VIX Short Term Futures ETF ^UVXY -14.25%.
- Treasury Markets: Yields fell: 30-Year Bond 4.854%, 10-Year Note 4.707%, 2-Year Note 5.097%. Yield spreads tightened, especially 10-2 Year (-0.39) and 10-3 Month (-0.78).
- Currency and Volatility: The U.S. Dollar Index up, CBOE Volatility pulls-back -10.92%, and the Fear & Greed reading: Fear.
- Commodity Markets: Oil up while Gold prices, Bitcoin, and the Bloomberg Commodity Index fall.
Sectors:
- All 11 Sectors gained, Consumer Discretionary (+1.65%) outperformed, while Energy (+0.66%) lagged. Top Industry: Independent Power and Renewable Electricity Producers (+4.18%), Hotel & Resort REITs (+2.59%), and Textiles, Apparel & Luxury Goods (+2.25%).
Treasury Yields and Currency:
- Yields across various Treasury maturities declined. The 30-Year Bond dipped to 4.854%, the 10-Year Note to 4.707%, and the 2-Year Note saw the most significant drop to 5.097%. Yield spreads tightened, notably the 10-2 Year at -0.39 and the 10-3 Month at -0.78.
- The U.S. Dollar Index ^DXY: 106.24 (+0.00, +0.00%)

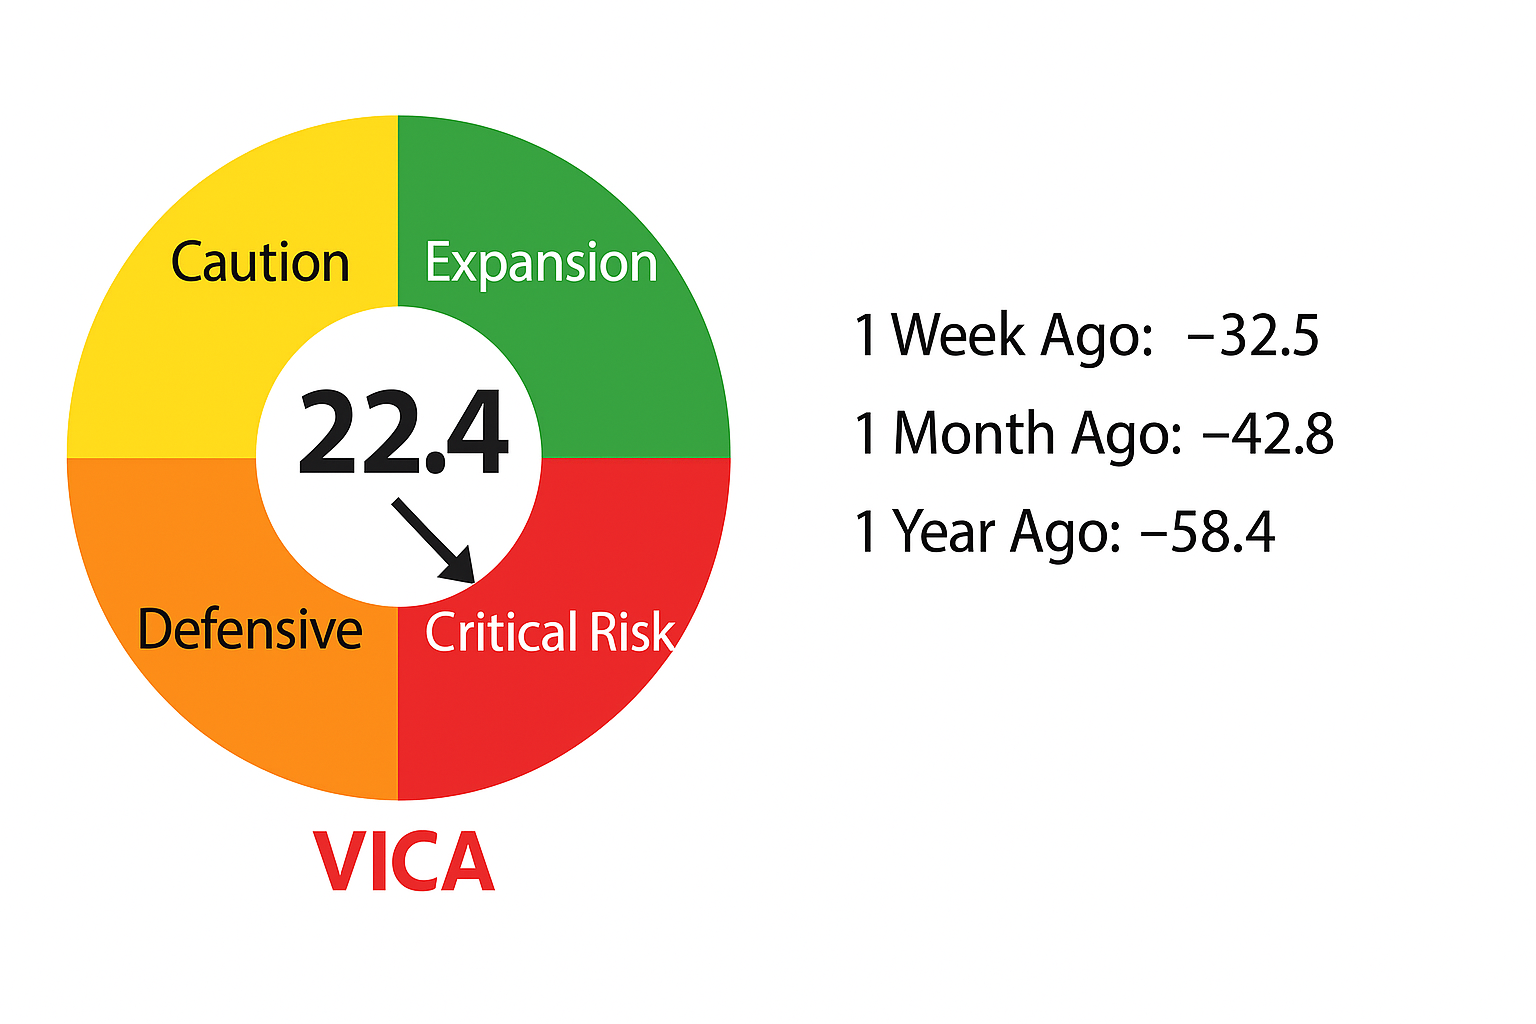
Market Volatility and Sentiment:
- CBOE Volatility ^VIX: 17.21 (+2.11, -10.92%)
- Fear & Greed Index (TY/LY): 36/16 (Fear/ Extreme Fear).
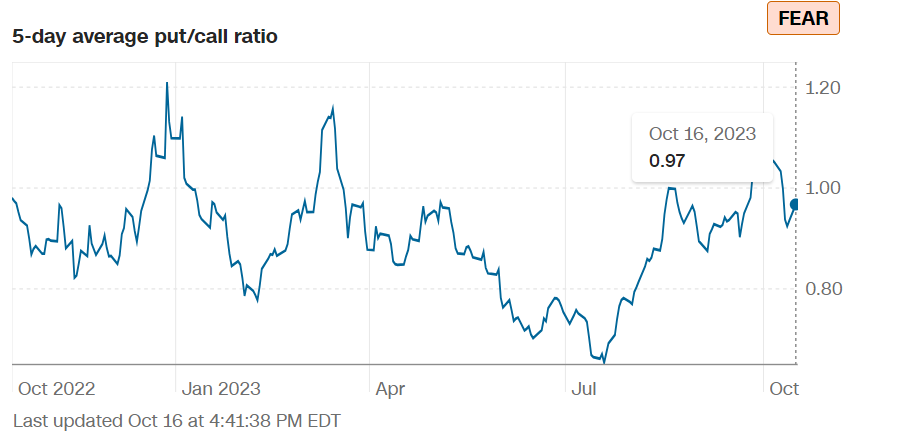
Source: CNN Fear and Greed Index
Commodities:
- Gold Futures: 1,918.26 (-7.34, -0.38%)
- Bitcoin USD: 28,478.40 (-41.80, -0.15%)
- Crude Oil Futures WTI: 86.69 (+0.03, +0.03%)
- Bloomberg Commodity Index: 104.71 (-0.58, -0.55%)
Factors:
- Small Caps tops all (+1.4%) lag.
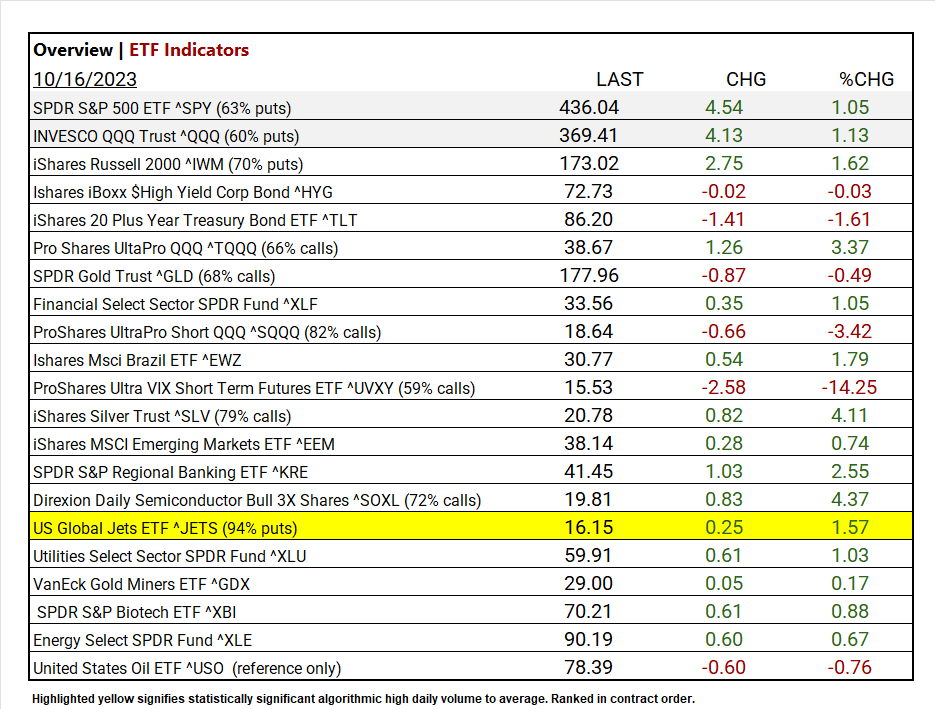
ETF Performance:
Top 3 Best Performers:
- Direxion Daily Semiconductor Bull 3X Shares ^SOXL +4.37
- iShares Silver Trust ^SLV +4.11%
- Pro Shares UltaPro QQQ ^TQQQ +3.37%
Top 3 Worst Performers:
- ProShares Ultra VIX Short Term Futures ETF ^UVXY -14.25%
- ProShares UltraPro Short QQQ ^SQQQ -3.42%
- iShares 20 Plus Year Treasury Bond ETF -1.61%
US Major Economic Data
October
- Empire Manufacturing: -4.6 (versus -3.0 consensus), previously 1.9.
Earnings:
- Q1 ’23: 79% of companies beat analyst estimates.
- Q2 Forecast/Actual: Predicted <7.2%> FY 2023 S&P 500 EPS decline; FY 2023 EPS flat YoY. By 7-28, 51% reported Q2 2023, results; 80% beat EPS estimates, above 5-year (77%) and 10-year (73%) averages. Earnings exceeded estimates by 5.9%, slightly below the 5-year (8.4%) and 10-year (6.4%) averages.
- Q3 Forecast: 116 companies in the index have issued EPS guidance for Q3 2023, Of these 116 companies, 74 have issued negative EPS guidance and 42 have issued positive EPS guidance. The percentage of S&P 500 companies issuing negative EPS guidance for Q3 2023 is 64% (74 out of 116), which is above the 5-year average of 59% but equal to the 10-year average of 64%. Eight of the eleven sectors are expected to see year-over-year earnings growth, with Communication Services and Consumer Discretionary leading the way. Conversely, three sectors, mainly Energy and Materials, are expected to experience earnings declines.
Notable Earnings Today:
- Beat: Equity Lifestyle (ELS)
- Miss: Charles Schwab (SCHW), ServisFirst Bancshares (SFBS), FB Financial (FBK)
Resources:
- What’s Expected in October
- Vica Partners Economics Forecast
News
Investment and Growth News
- LinkedIn lays off 668 employees in second cut this year – SCMP
- Netflix Will Lead Streamers Into Uncharted Territory – WSJ
- Rakuten’s Rally From Record Lows Clouded by Looming Bond Deadlines – Bloomberg
- EQT-Backed Health Payments Software Maker Waystar Files for IPO – Bloomberg
Infrastructure and Energy
- Wall Street’s Surprising Quest for Ways to Finance Coal Again – Bloomberg
- The Oil Price Has a Safety Valve. Gas Doesn’t – WSJReal Estate Market Updates
Real Estate
- Real Estate Brokers Pocketing Up to 6% in Fees Draw Antitrust Scrutiny – Bloomberg
Central Banking and Monetary Policy
- Fed Should Stop Rate Increases With US Small Businesses Struggling, Harker Says – Bloomberg
- Home Sales on Track for Slowest Year Since Housing Bust – WSJ
International Market Analysis (China)
- China’s central bank chief vows to seize economic momentum to boost confidence – SCMP