
TECHNICAL ANALYSIS
US Dollar Index Weekly H-L-C

In our update in early October we speculated: The big question is, could we be looking at an intermediate and perhaps even longer term high in the US Dollar? One indicator is that there was critical timing indicated for September 23rd to the 26th for all the financial markets… At this juncture, the weekly is in a steep downtrend and the daily is building a small flagging pattern under oversold conditions. On the long-term charts, prices are testing a key area of support at 10500/10495. Also note that this week’s low of 10448 hit the 50-week moving average…currently at 10450.
US Dollar Index Daily H-L-C
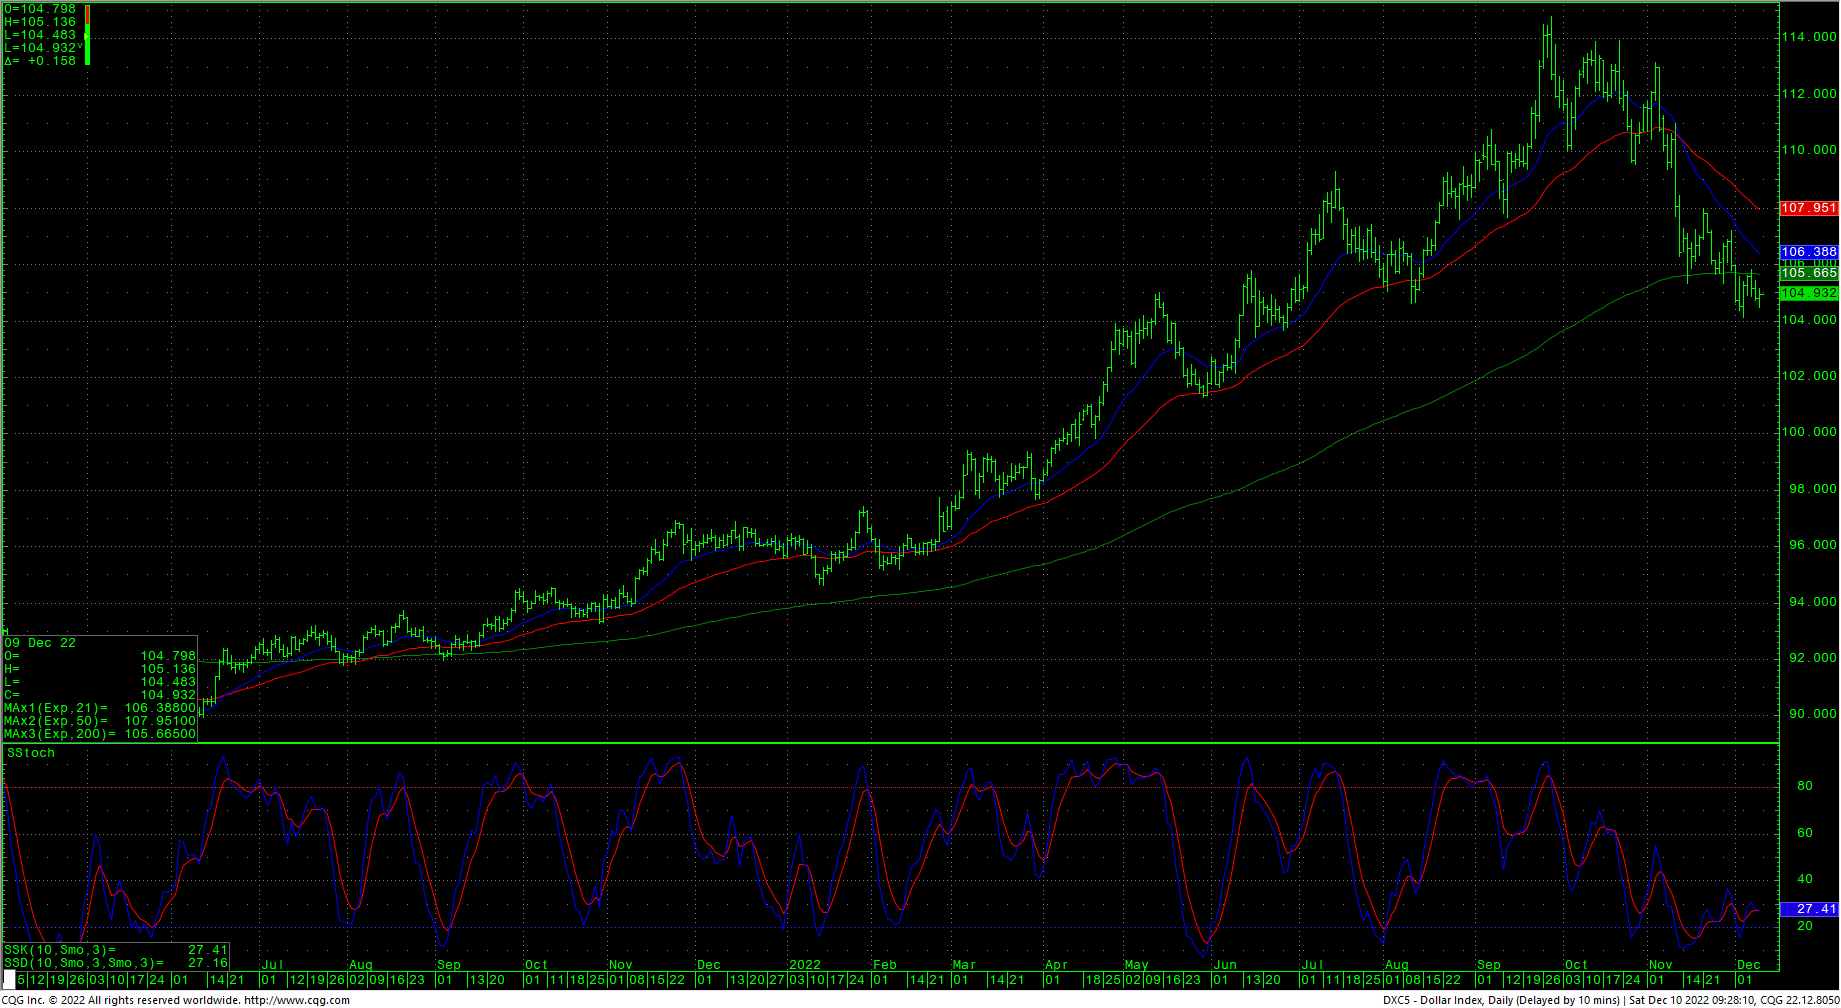
Just below is support that runs from 10403 to 10363. A further breakdown with closes under 10363 suggests a move to 10199/10151 with a key swing low at 10129. Critical monthly support runs from 9897 to 9830, an area that also represents the current 200-week moving average. Closes under 9830 would take prices into a wide band of monthly support that runs from 9560 to 9450.
Short-term resistance is 10572/10583. A drive back over 10583 can test 10662. Resistance is 10754 and short-term pivotal against the 10818/10840 level. Closes back over 10840 will open counts to 10935/10944 with potential to critical short-term resistance of 11070/11100. Daily closes over 11100 open counts to 11226 with longer-term counts to the recent tops of 11315 and 11478.
Support
- 10403 **
- 10363 *** ↓
- 10199/10151 *** ↓
- 9897/9830 *** ↓
- 9560 **
- 9450 *** ↓
Resistance
- 10572/10583 **
- 10662 *** ↑
- 10754 **
- 10818/10840 *** ↑
- 10935/10944 **
- 11070/11100 *** ↑
- 11226 ** ↑
- 11315 *** ↑
- 11470/11480 *** ↑
Charts courtesy of CQG, Inc.


