VICA Partners | August 20, 2025
Markets are pricing an ~85% chance of a 25bp cut at the September 16–17 FOMC.
- Upside: limited if Powell delivers what’s already priced
- Downside: sharper if he stalls or pushes cuts out
This playbook gives you:
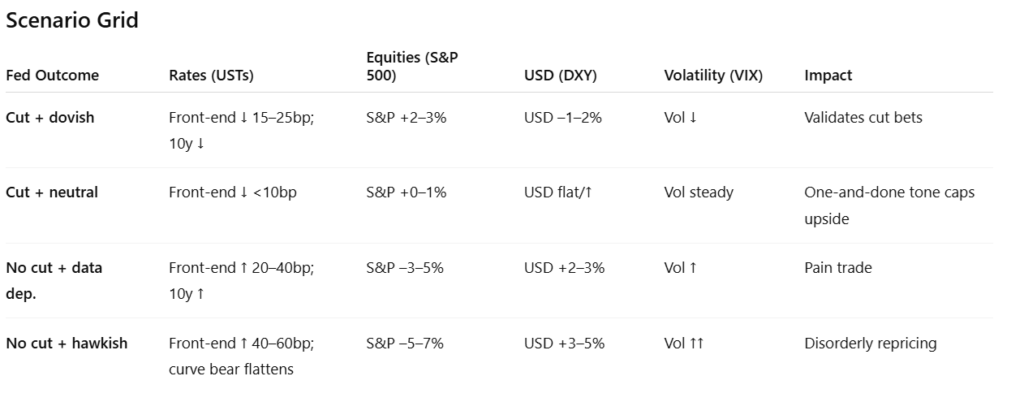
- A scenario grid mapping Fed outcomes to market impact
- A visual chart for instant reference
- A way for retail to see the Fed like institutions — outcomes, not headlines
Skip the press. Focus on outcomes.
Visual Map: Seeing the Fed Like Institutions Do
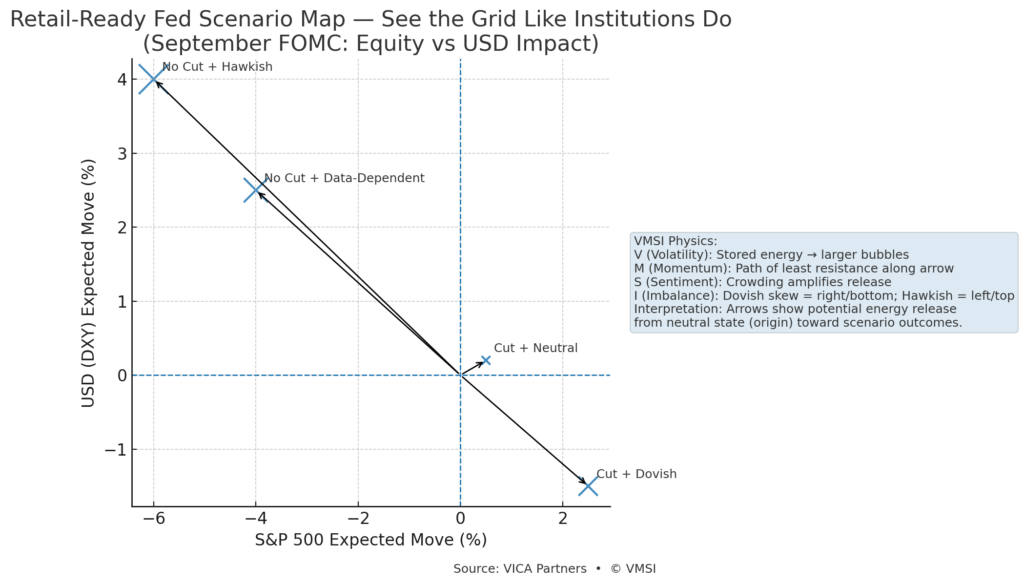
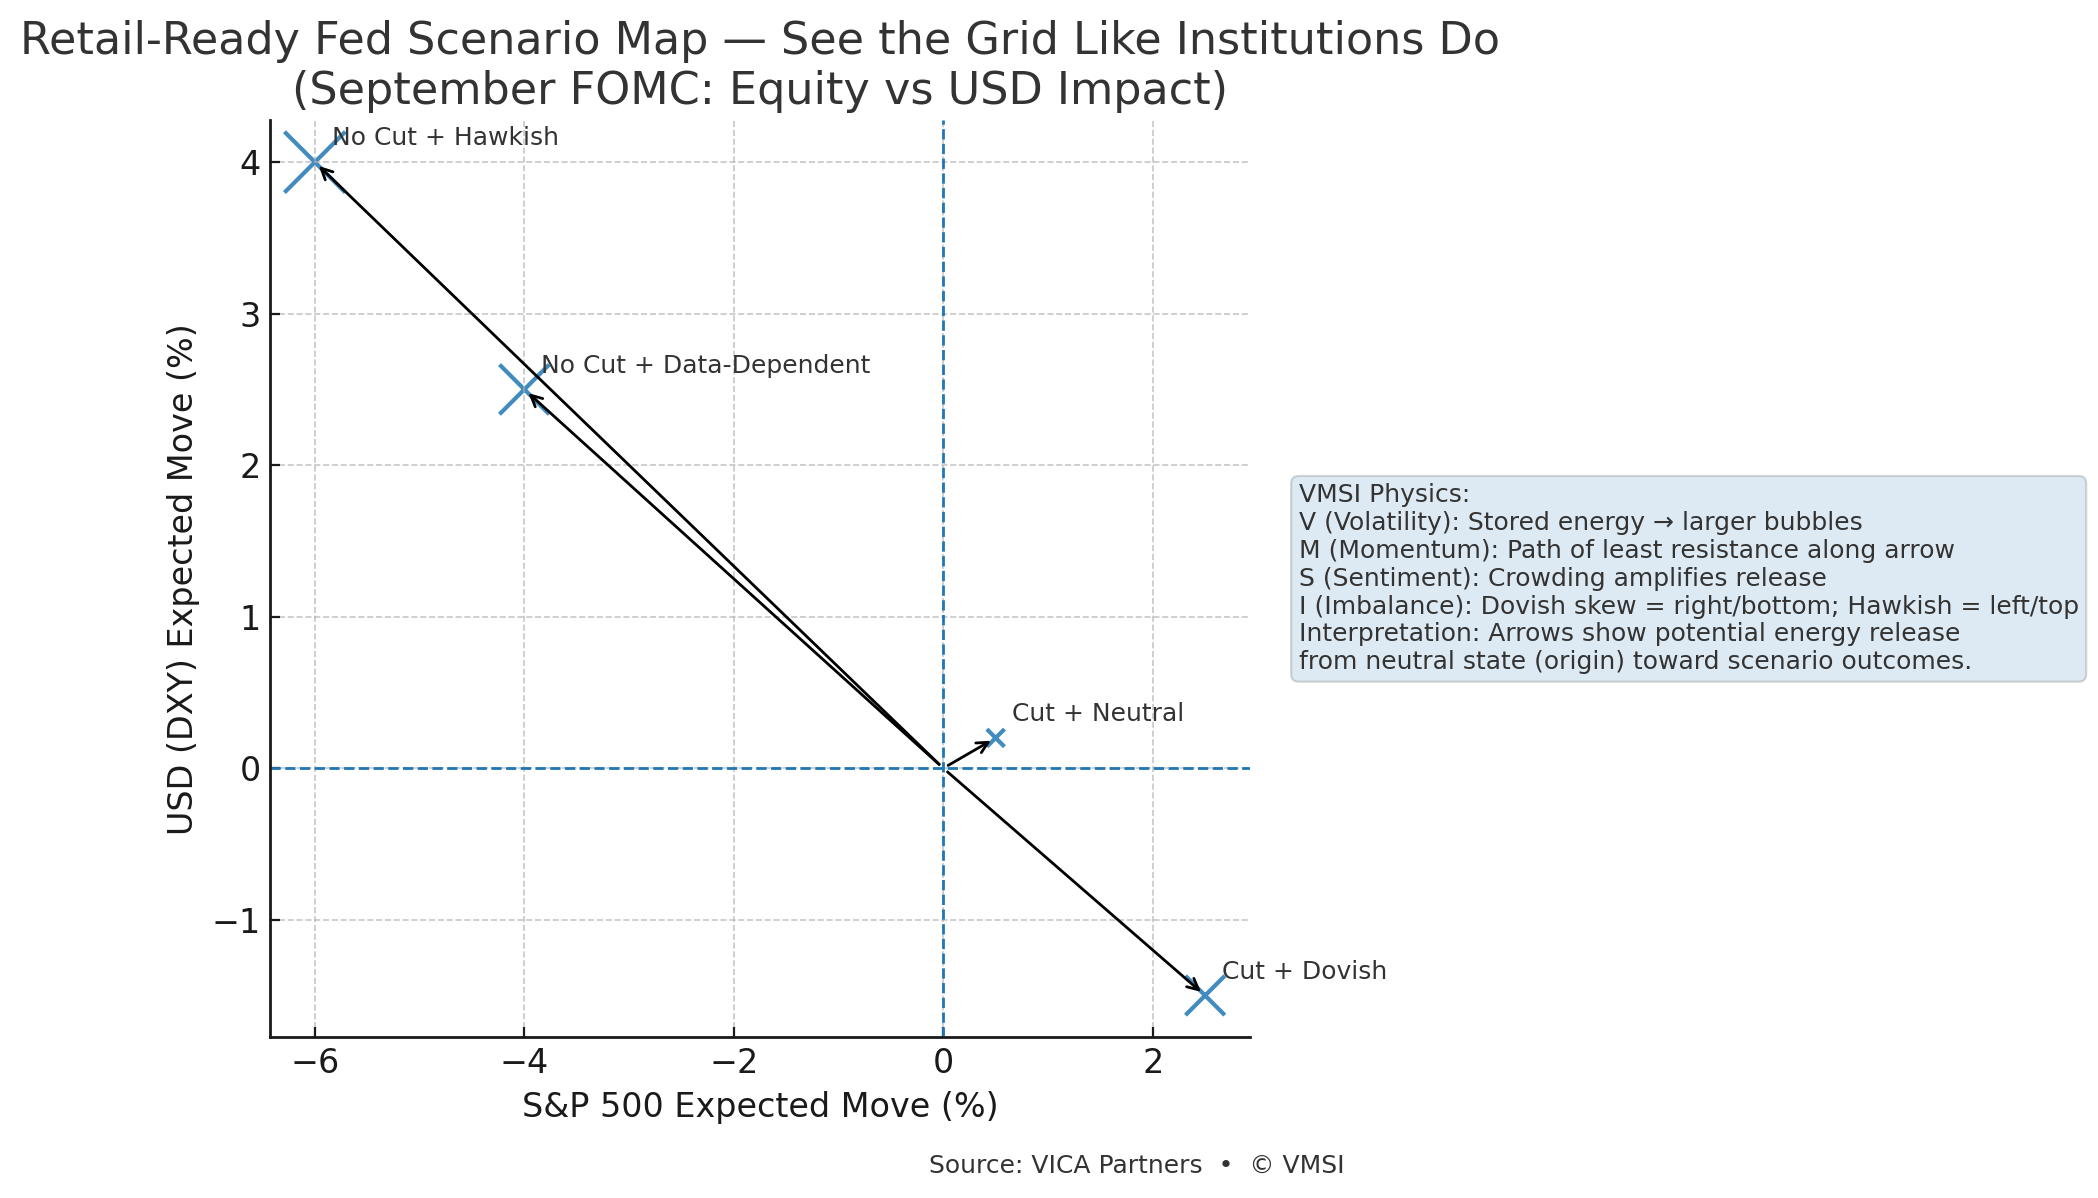
The chart compresses the Fed meeting into one picture: x-axis = S&P move, y-axis = USD move, bubble size = volatility, arrows = directional force.
The takeaway is clear: markets are asymmetrically priced — capped reward, open risk.
Reward Capped, Risk Open
Markets lean on cuts, leaving little upside if Powell confirms but sharp downside if he hesitates.
- Crowded trades: equities, duration
- Cleaner upside: USD, volatility, defensives
Question for readers:
How are you positioning into the September Fed meeting — leaning with the consensus, or preparing for the pain trade?
Disclaimer
This material is for informational and educational purposes only and does not constitute investment advice, a recommendation, or a solicitation to buy or sell any securities. Markets involve risk, including the potential loss of capital. Past performance is not indicative of future results. Readers should conduct their own analysis or consult a qualified advisor before making investment decisions.
© 2025 VICA Partners • VMSI Framework. All rights reserved

