
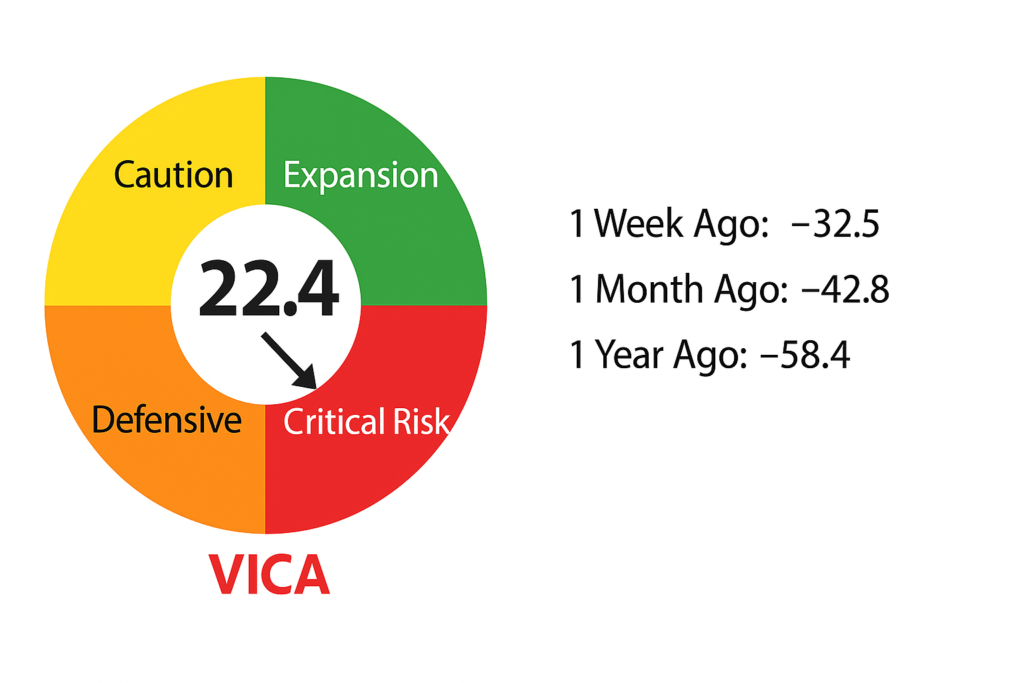
VMSI Gauge Chart — Displaying Current Sentiment and Risk Level
The VMSI gauge indicates a current sentiment score of 22.4, placing it deep within the Critical Risk Zone. The dial now sits firmly in the red quadrant, underscoring a decisive shift into extreme risk-off conditions. One week ago, sentiment stood at 32.5, one month ago at 42.8, and a year ago at 58.4. This confirms a sharp deterioration in risk appetite, driven by escalating selling pressure and heightened volatility across global markets.
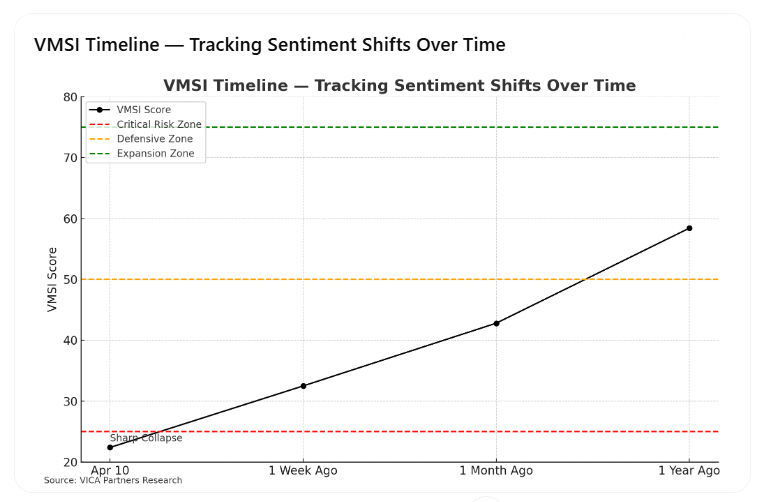
VMSI Timeline — Tracking Sentiment Shifts Over Time
The VMSI timeline shows sentiment at 22.4 as of April 10, down from 32.5 last week, erasing the tentative recovery seen in late March. The line remains far below the 50 neutral mark and has now reached levels typically associated with market capitulation. As volatility surges and capital retreats, sentiment has reset to its lowest level in over a year.
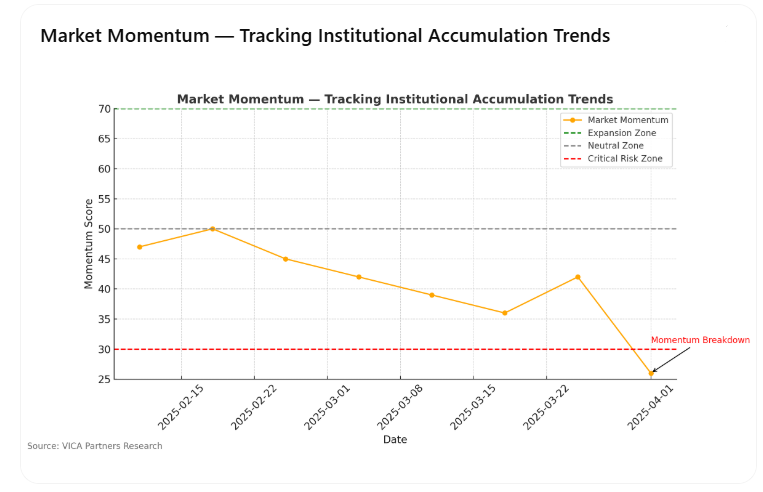
Market Momentum — Tracking Institutional Accumulation Trends
Momentum has broken down again, falling to ~26 from last week’s ~28. This confirms another leg of institutional distribution. Equity outflows are widespread, and even previously resilient sectors are under pressure. The reading now sits below the critical threshold (30), consistent with a deeply defensive stance.
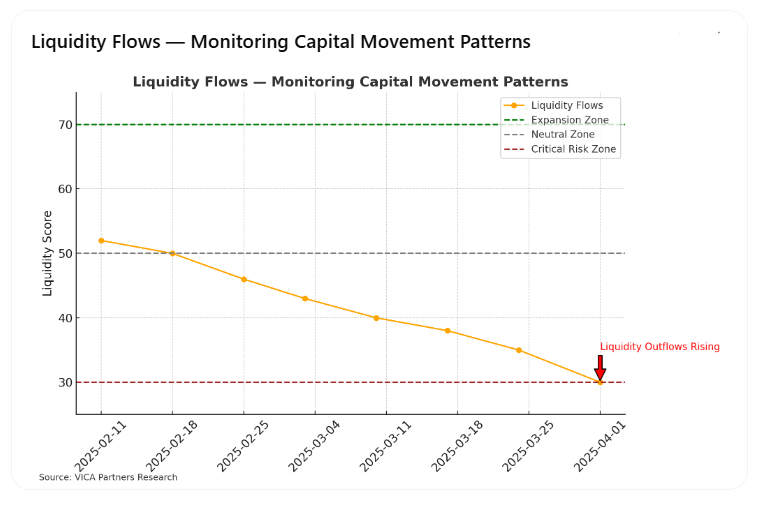
Liquidity Flows — Monitoring Capital Movement Patterns
Liquidity remains in retreat, slipping from ~30 to ~28. Outflows from ETFs and mutual funds have resumed, margin balances are being reduced, and large allocators are moving to cash. While not collapsing, the data suggests no return of risk appetite and a continued preference for liquidity preservation.
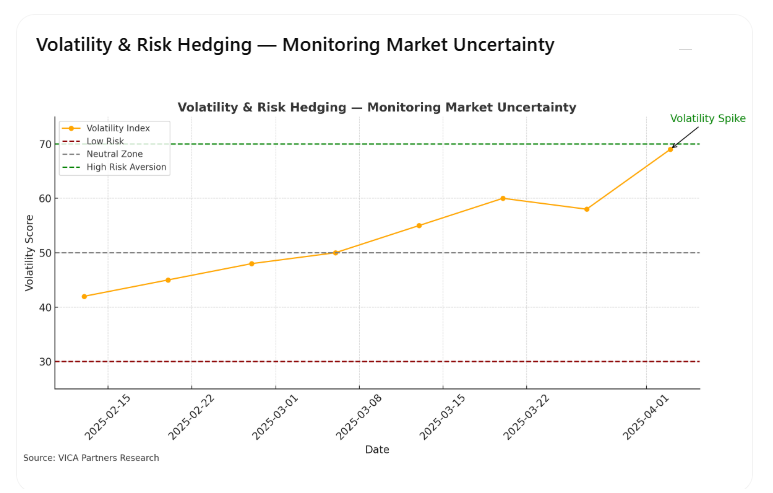
Volatility & Risk Hedging — Monitoring Market Uncertainty
Volatility has climbed from the high-50s to ~69, just below the high-risk-aversion threshold. Indicators such as the VIX and credit default spreads are elevated, confirming aggressive hedging behavior. The brief stabilization seen last week has fully reversed, and the surge reflects renewed concern among institutional players.
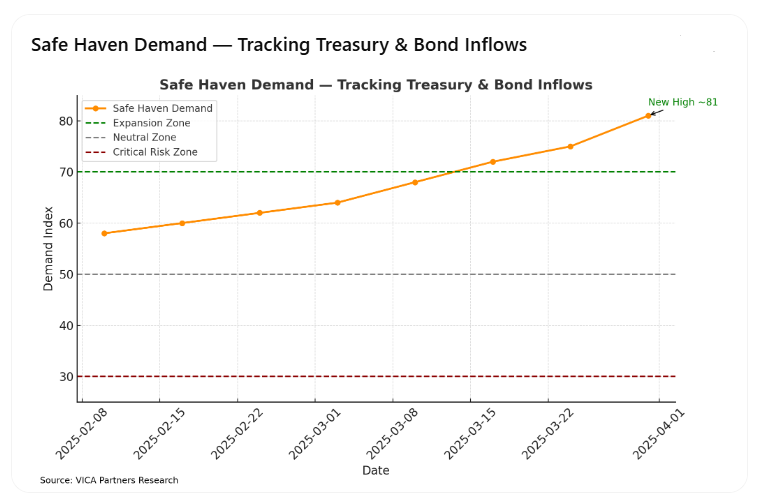
Safe Haven Demand — Tracking Treasury & Bond Inflows
Safe-haven flows continue to rise. The index has climbed from ~75 to 81, reaching the highest level of this cycle. Treasuries and gold are attracting strong inflows, and yield curves are flattening again. The data clearly shows capital rotating out of equities and into safety.
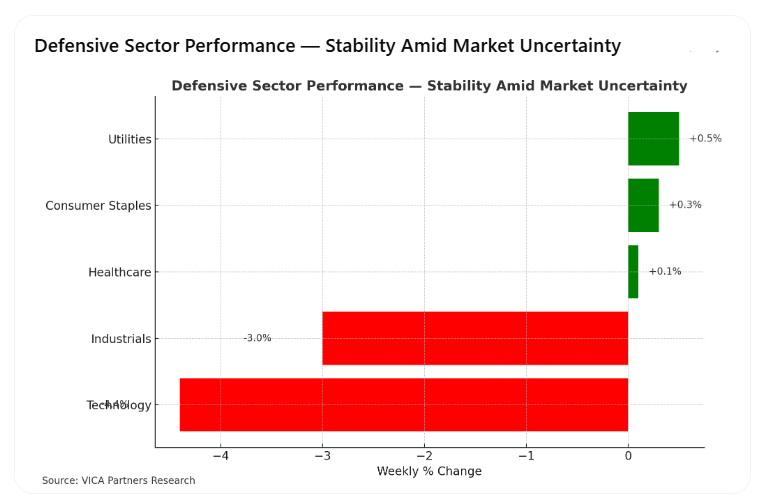
Defensive Sector Performance — Stability Amid Market Uncertainty
Defensive sectors remain relatively stable. Utilities (+0.5%), Consumer Staples (+0.3%), and Healthcare (+0.1%) all outperformed cyclicals. Meanwhile, Technology (-4.4%) and Industrials (-3.0%) declined sharply. Investors continue to favor sectors with strong cash flows and lower volatility, consistent with a risk-off environment.
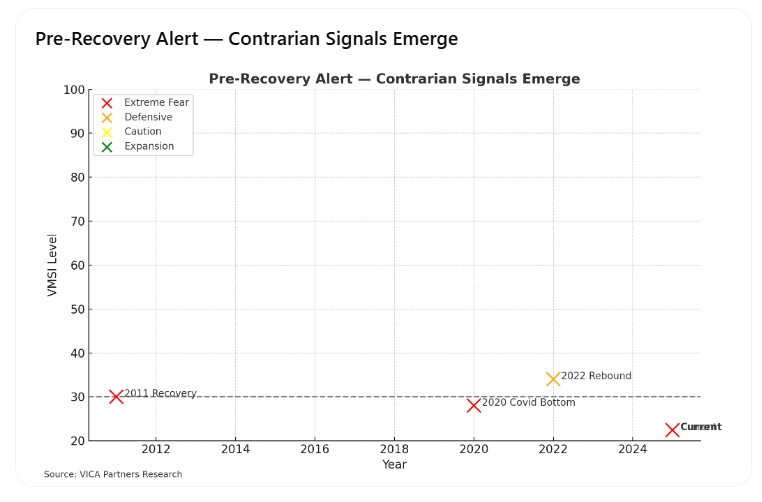
Pre-Recovery Alert — Contrarian Signals Emerge
The VMSI and its sub-indices are approaching historical extremes. While no bottom is confirmed, the setup is forming: extreme risk aversion, high safe-haven flows, and collapsing momentum typically precede turning points. A rebound will require signs of policy support, stabilizing flows, or volatility compression. Until then, caution is warranted.
VMSI Index FAQs — VICA Market Sentiment Indicator
What is the VMSI?
The VMSI (VICA Market Sentiment Indicator) is a proprietary multi-factor index that measures institutional market sentiment, capital flow behavior, and systemic risk posture. Unlike headline-driven retail sentiment tools, VMSI focuses on actionable signals for allocators, strategists, and risk managers.
How is VMSI Calculated?
VMSI aggregates six weighted components: Market Momentum, Capital Liquidity, Volatility & Hedging, Safe Haven Demand, Defensive Sector Performance, and Pre-Recovery Signals. Each input is normalized and scored to produce a single index reading from 0 (Extreme Risk Aversion) to 100 (Super Expansion). Scores below 35 often indicate capitulation; above 70 signal stretched optimism.
How often is the VMSI updated?
The index is updated weekly based on institutional data and market behavior through Thursday’s market close. All visuals, thresholds, and sentiment commentary are aligned with VICA’s tactical cycle framework.
How should investors use the VMSI?
VMSI offers a strategic overlay to traditional technical and macroeconomic models. It is built for professional use — to track crowding, de-risking, and positioning inflection points. While not predictive in isolation, it provides a critical input for timing exposure shifts, managing downside risk, and validating macro narratives.
Source: VICA Partners Research
#VMSIindex #InstitutionalSentiment #VICAresearch


