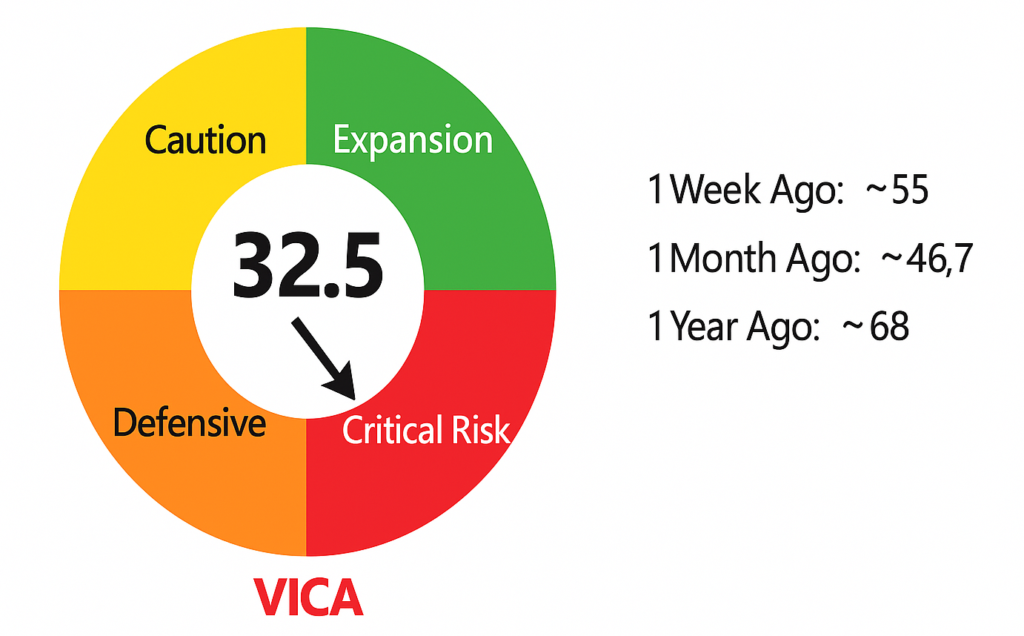
VMSI Gauge Chart — Displaying Current Sentiment and Risk Level
The VMSI gauge shows a sentiment score of 32.5, placing it in the Critical Risk Zone. The dial points into the red “Critical” sector, reflecting extreme risk aversion. The gauge’s quadrants (green for expansionary confidence, yellow for cautious optimism, orange for defensive, red for critical risk aversion) confirm sentiment has shifted into its most risk-off stance. Side markers show ~55 one week ago (Caution), ~46.7 one month ago (Defensive), and ~68 one year ago (Optimistic). Sentiment has rapidly weakened from last week’s caution to its lowest level in a year.
VMSI Gauge Chart
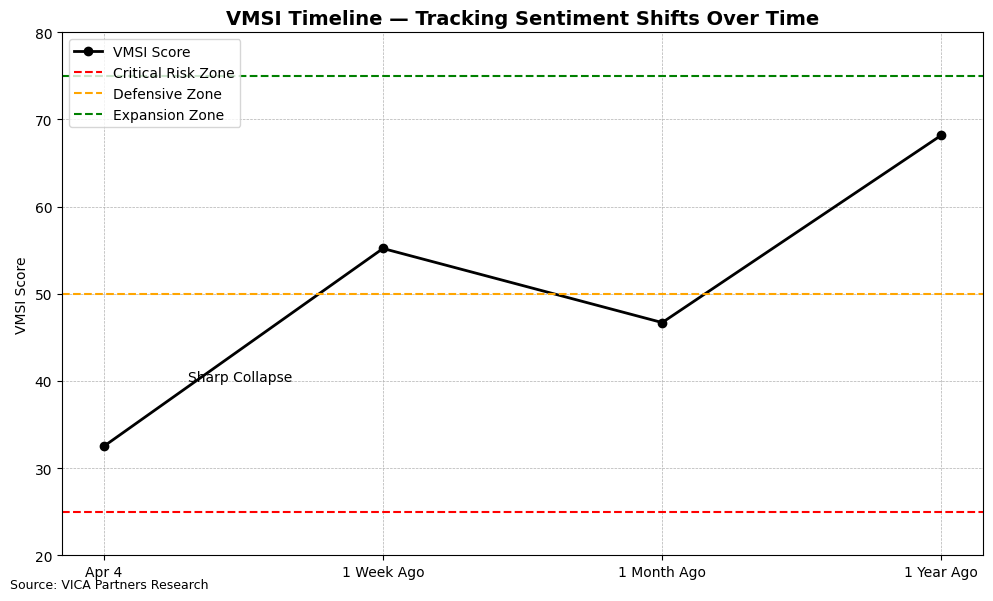
VMSI Timeline — Tracking Sentiment Shifts Over Time
The timeline shows VMSI at 32.5 on April 4, compared to ~55 a week ago, ~46.7 a month ago, and ~68 a year ago. The chart illustrates a steep decline from last week’s levels. Key zone markers: above 75 (green) for high confidence, below 25 (red) for extreme fear, and 50 (orange) for neutral. The recent drop below 50 erases prior gains and reflects a sharp return to risk-off sentiment.
VMSI Timeline
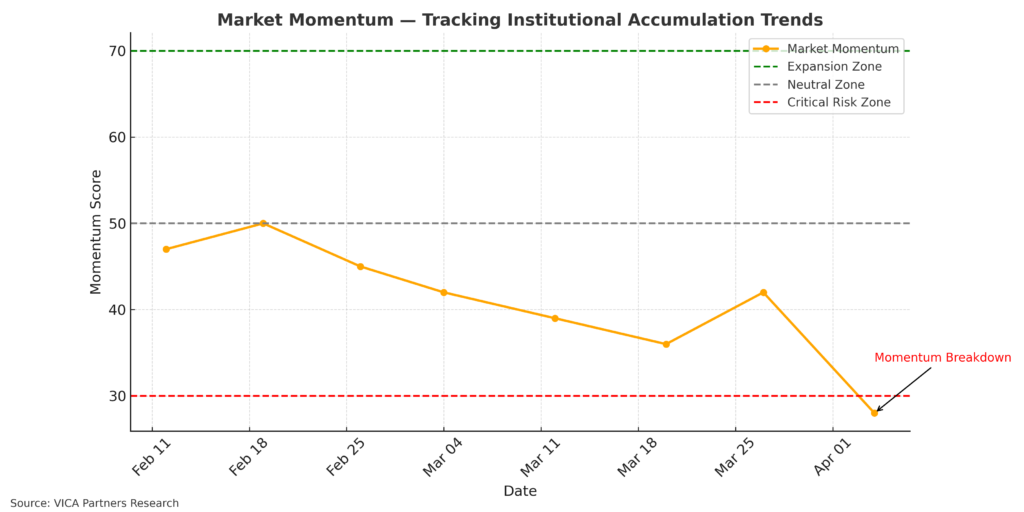
Market Momentum — Tracking Institutional Accumulation Trends
Market momentum (yellow-orange line) has declined to ~28 from ~42, falling below the weak threshold (30). The downward move signals broad selling pressure. Previously selective accumulation has flipped to active distribution by institutions. With momentum in bearish territory, even resilient segments have faced liquidation.
Market Momentum
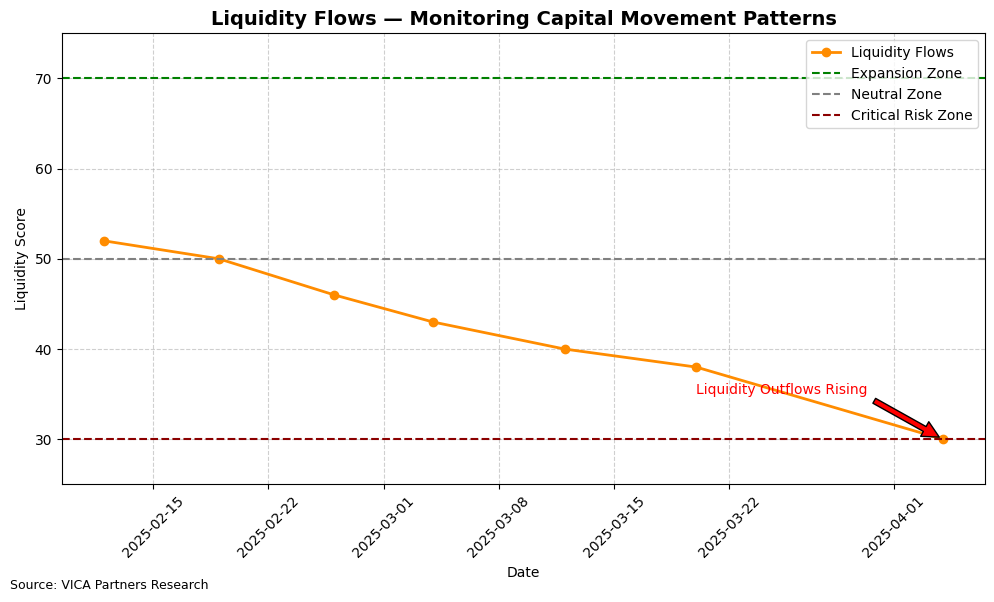
Liquidity Flows — Monitoring Capital Movement Patterns
Liquidity has dropped to ~30 from ~38, reversing a short-lived improvement. The red arrow shows capital outflows and deleveraging resumed. ETF and mutual fund outflows and trimmed margin exposure signal rising cash preference. The index remains well below neutral (50), consistent with defensive positioning.
Liquidity Flows
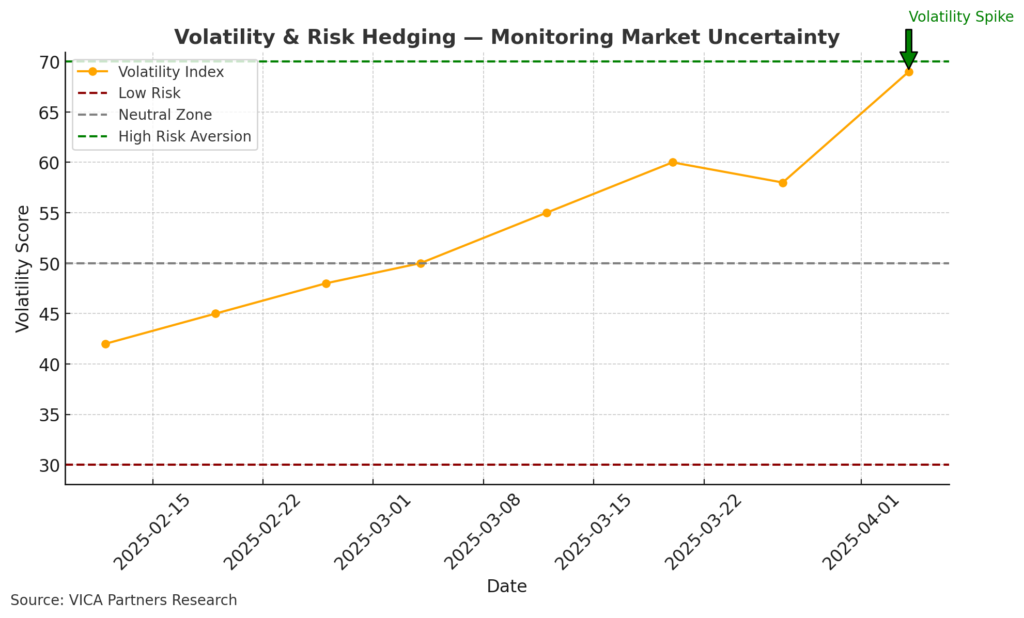
Volatility & Risk Hedging — Monitoring Market Uncertainty
Volatility has climbed from the high-50s to ~69, nearing the high risk-aversion threshold (70). The spike reflects a rise in hedging activity and stress indicators like the VIX and CDS spreads. While there were signs of easing last week, this renewed jump shows persistent fear and risk-hedging dominance.
Volatility & Risk Hedging
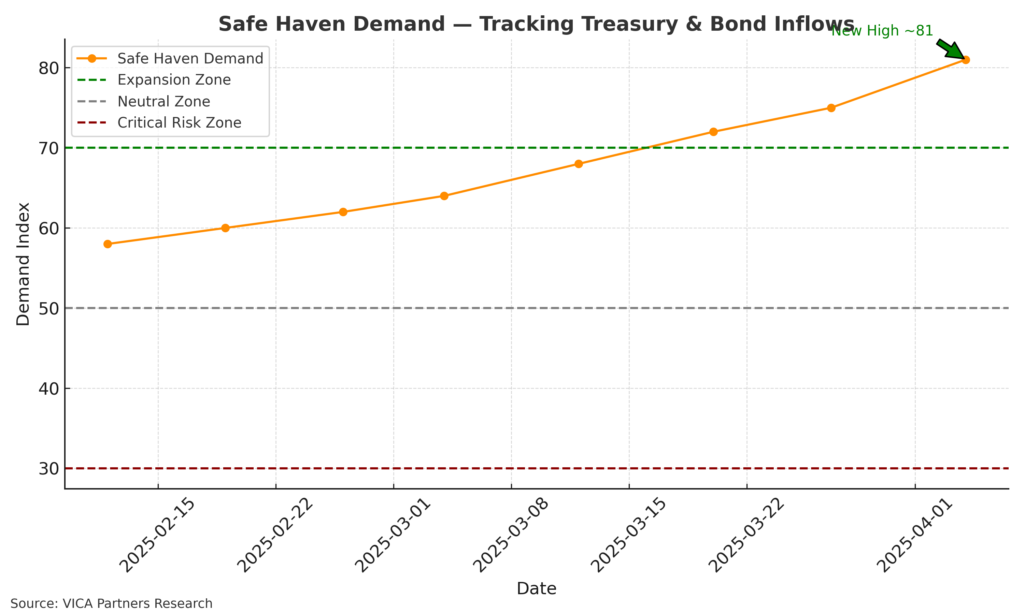
Safe Haven Demand — Tracking Treasury & Bond Inflows
The safe-haven index has risen from the mid-70s to ~80+, the highest of this cycle. Treasury and gold inflows continue as investors seek protection. The index remains deep in the green Expansion zone. Institutions are prioritizing safety despite more attractive equity valuations.
Safe Haven Demand
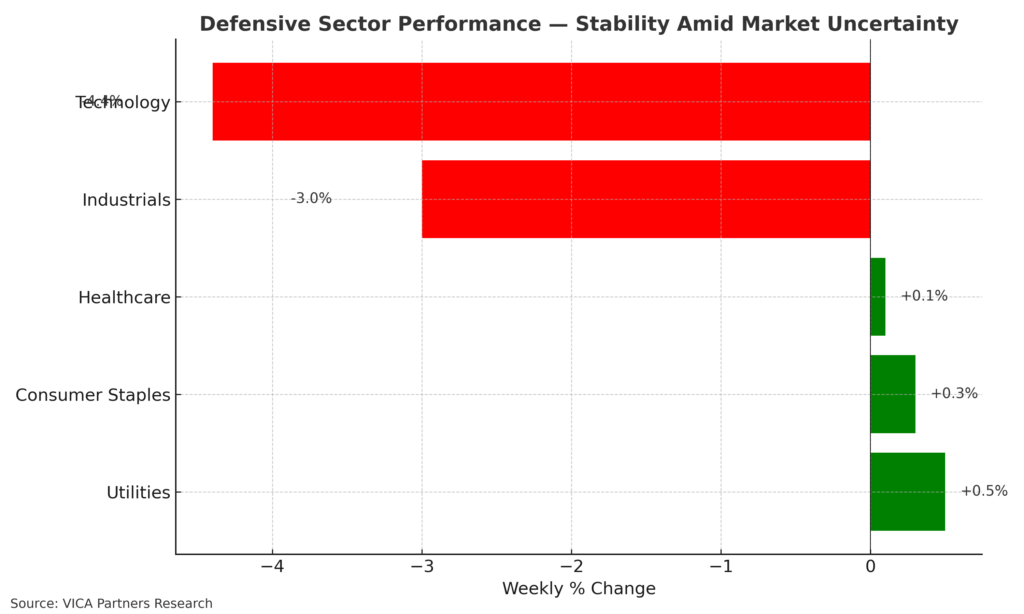
Defensive Sector Performance — Stability Amid Market Uncertainty
Defensive sectors led relative performance: Utilities (+0.5%), Consumer Staples (+0.3%), Healthcare (+0.1%). In contrast, Technology (-4.4%) and Industrials (-3.0%) fell hard. Investors rotated to stable, cash-generative sectors. This aligns with risk-off sentiment reflected in the VMSI.
Defensive Sector Performance
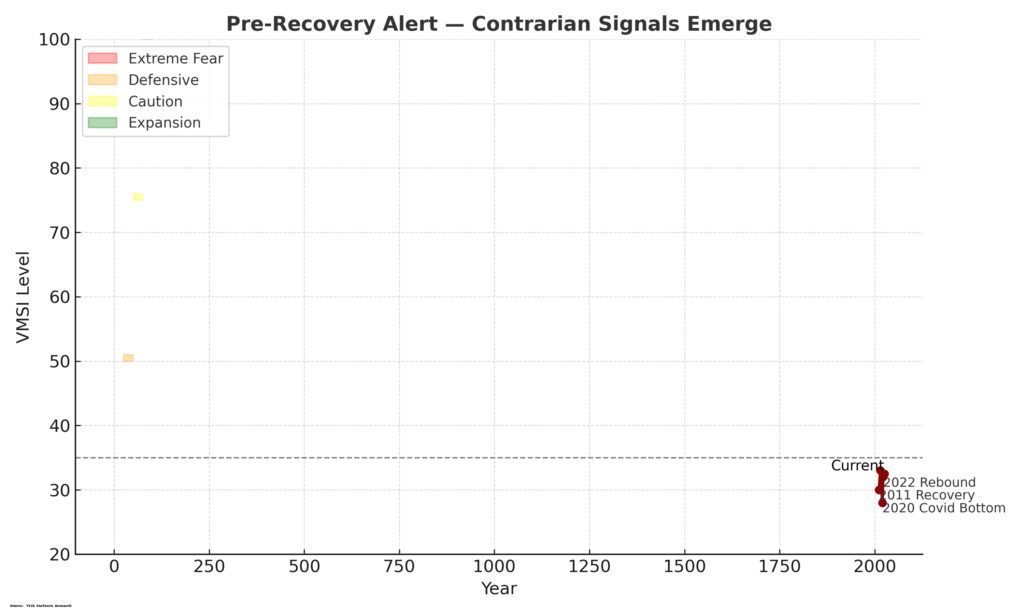
Pre-Recovery Alert — Contrarian Signals Emerge
Sentiment has reached levels historically associated with capitulation. Surging volatility, extreme safe-haven flows, and a VMSI below 35 suggest a turning point may be forming. Past cycles show similar conditions often precede recoveries, but no timing signal is confirmed. Watch for stabilizing liquidity, falling volatility, or supportive policy as potential reversal triggers.
Pre-Recovery Alert
Market Notes
-
Tariff Shock & Selloff: Trump’s sweeping tariff plan (10–54%) drove a major selloff. The S&P 500 dropped 3.5% in one session, now down ~6.8% YTD, and broke below its 200-day average. Risk appetite collapsed in response.
-
Flight to Safety: Treasury yields fell and gold surged. Credit spreads widened. The VIX jumped above 30. Fear of economic damage and a hawkish Fed added to the defensive shift.
-
Upcoming Catalysts: Q1 earnings season could influence direction. Guidance on tariffs and economic outlook will be key. Markets may stabilize if policies soften or the Fed signals support.
Comments welcome below. Source: VICA Partners Research.


