What is VMSI?
The VICA Market Sentiment Index tracks institutional capital flows, risk posture, and macro volatility weekly. Built for tactical allocation — not behavioral shifts.
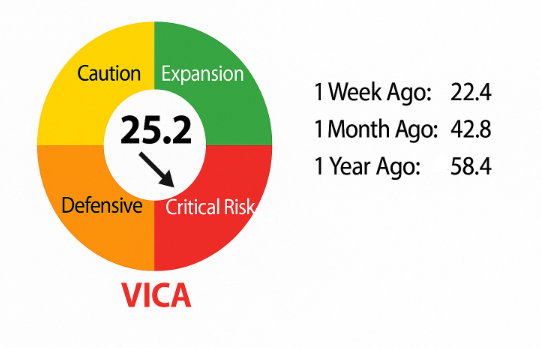
VMSI Gauge Chart — Displaying Current Sentiment and Risk Level
The VMSI gauge indicates a current sentiment score of 25.2, still deep within the Critical Risk Zone. The dial remains anchored in the red quadrant, underscoring an environment of persistent risk aversion. One week ago, sentiment stood at 22.4, one month ago at 42.8, and a year ago at 58.4. While there is a marginal uptick this week, the overall picture remains dominated by caution, capital preservation, and volatility hedging.
Key Insight: Sentiment remains at capitulation levels despite stabilizing modestly.
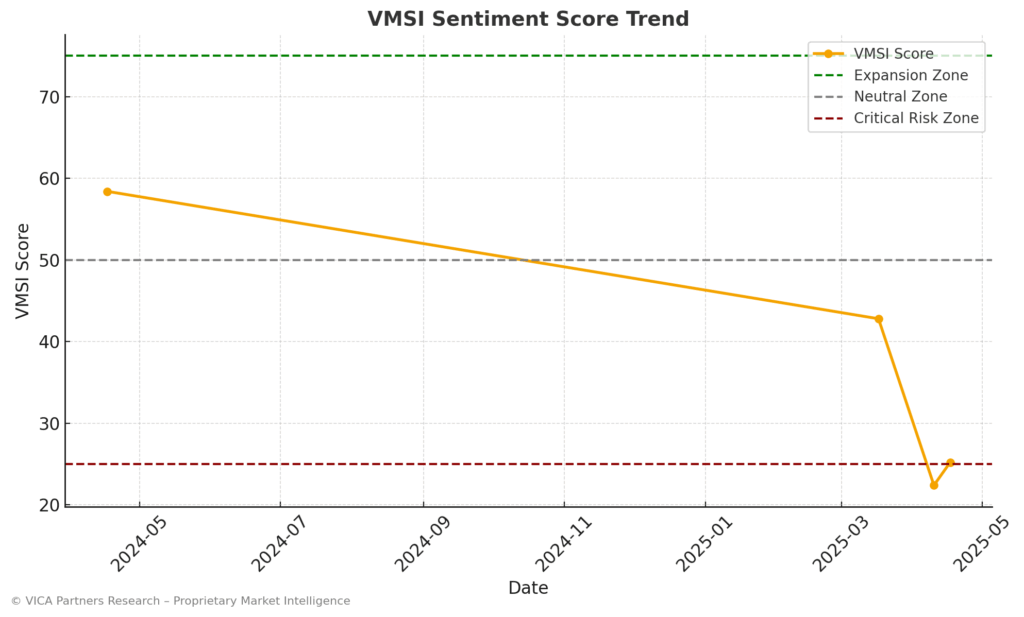
VMSI Timeline – Sentiment Shifts Over Time
The VMSI timeline shows sentiment at 25.2 as of April 17, slightly up from 22.4 last week, yet still near the lowest levels in over a year. The line remains well below the 50 neutral mark and deep within risk-off territory. This modest gain does little to reverse the sharp sentiment deterioration observed over the past six weeks.
Key Insight: Sentiment has stabilized but remains deeply bearish.
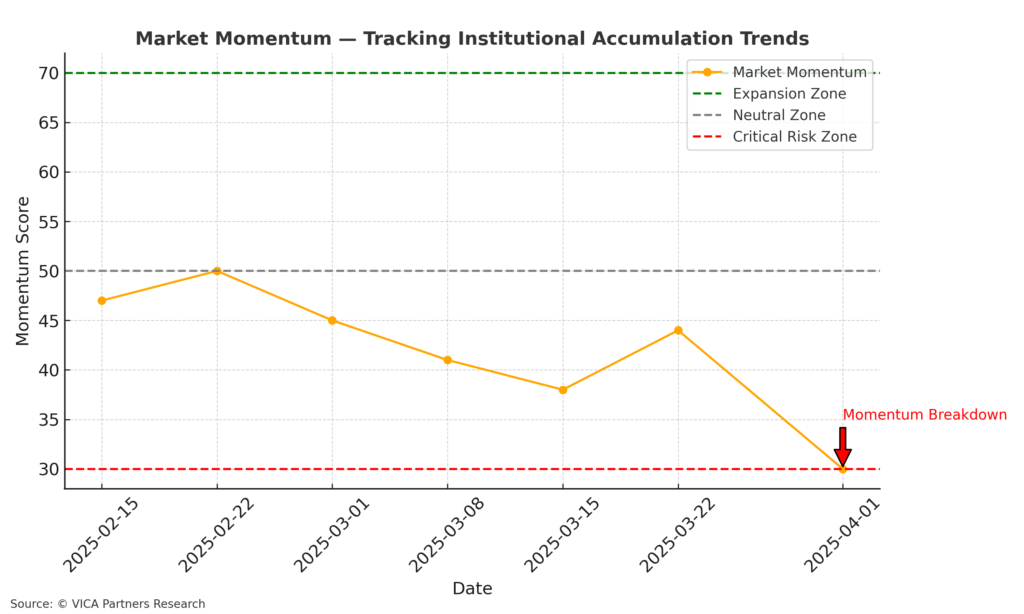
Market Momentum – Institutional Accumulation Trends
Market momentum remains weak but is stabilizing after an extended breakdown. In early April, this indicator slipped below the critical 30 threshold, confirming heavy institutional selling pressure. As of this week, momentum has inched back upward to the low-30s, following a rebound in equities off last week’s lows. This uptick suggests that institutional investors slowed their selling and selectively dipped back into the market. However, momentum is still in a defensive posture.
Key Insight: Institutional outflows have slowed, but meaningful accumulation has not returned.
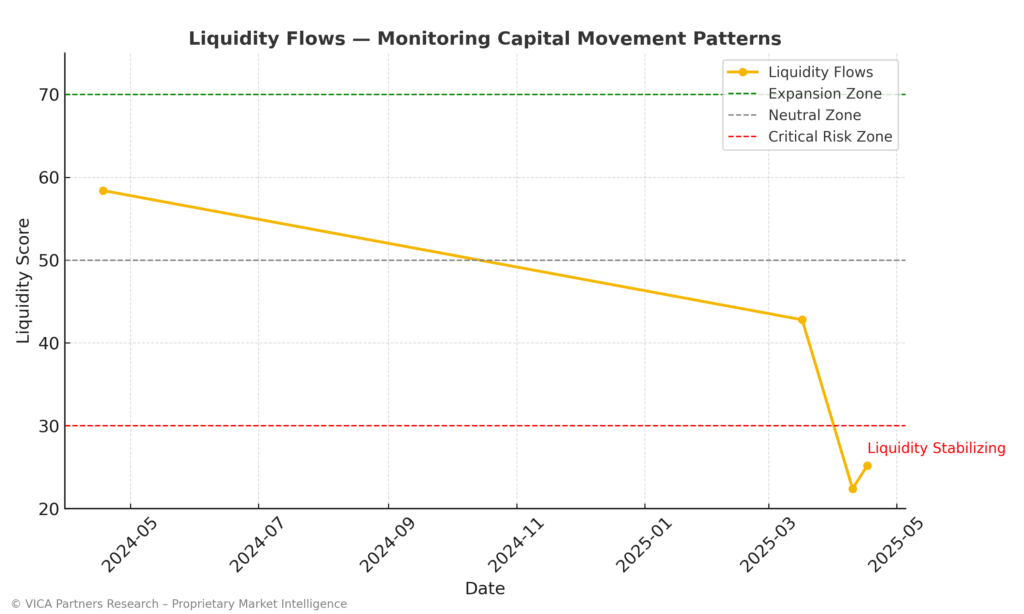
Liquidity Flows – Capital Movement Patterns
Liquidity remains constrained, but there are early signs of stabilization. Over the past several weeks, this index had been sliding steadily as investors pulled money out of equities and reduced leverage. In the latest data, liquidity outflows have eased slightly. This week the liquidity sub-index ticked up from the high-20s into the low-30s, indicating that the pace of withdrawals slowed and some modest inflows reappeared. Conditions remain far from normal, but the shift is encouraging.
Key Insight: Cash is returning selectively — but liquidity trends remain fragile.
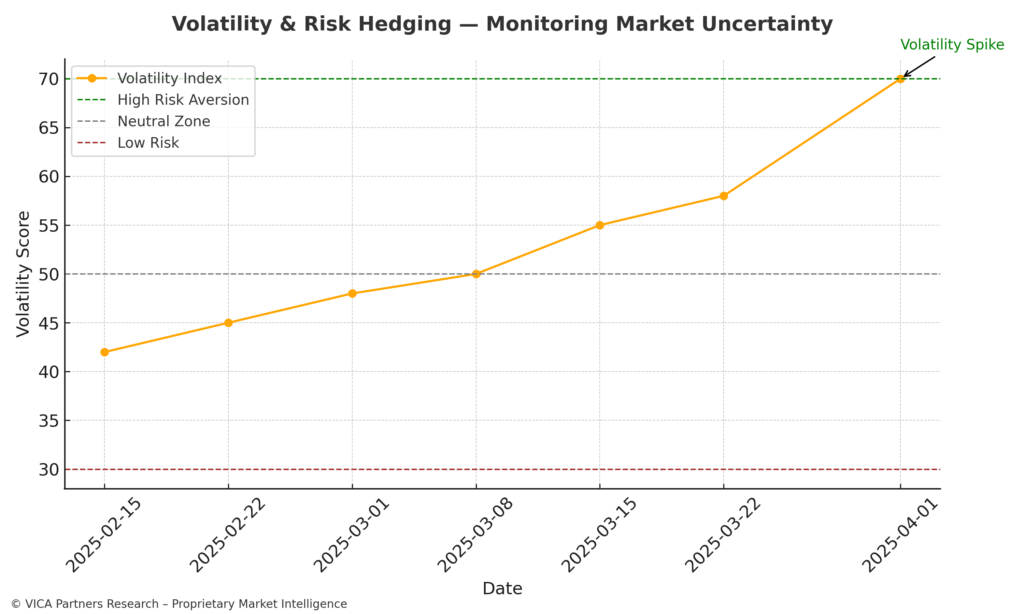
Volatility & Risk Hedging – Market Uncertainty Barometer
Volatility has pulled back slightly from extreme highs but remains elevated. Last week’s VIX spike above 40 has now retreated to around 30, signaling that immediate panic is abating. Despite this, the volatility index remains in the high-50s, well above its long-term average. Institutions are still paying premiums for downside protection and credit spreads remain elevated. The risk hedging component continues to flash High Risk Alert.
Key Insight: Hedging demand remains intense even as VIX cools from peak.
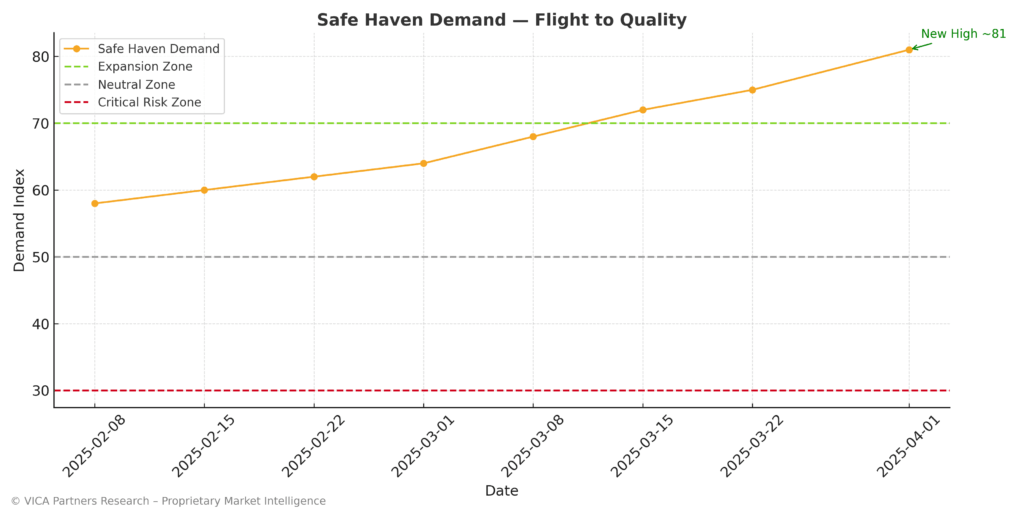
Safe Haven Demand – Flight to Quality
Demand for safe havens remains at peak levels. The index sits in the low-80s – around the highest level of this cycle. This is supported by Treasury and gold inflows, yield curve flattening, and strong demand for short-duration bonds. Institutions continue to allocate defensively, emphasizing capital protection over risk-taking.
Key Insight: Safe-haven appetite remains elevated, showing no shift toward risk-taking.
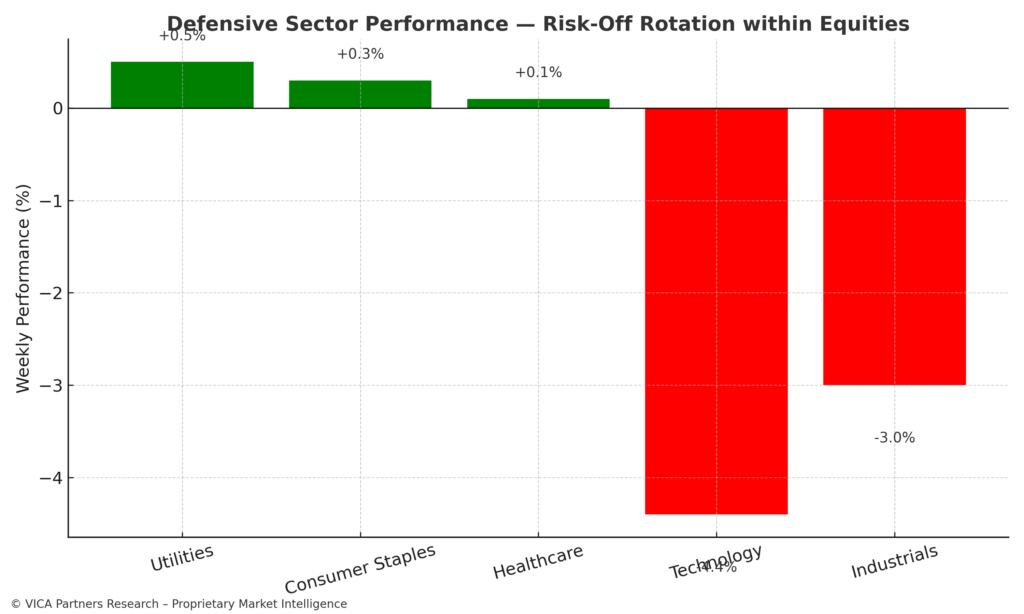
Defensive Sector Performance – Risk-Off Rotation within Equities
Defensive sectors continued to outperform. Utilities (+0.5%), Consumer Staples (+0.3%), and Healthcare (+0.1%) all held relatively steady. Cyclical sectors like Technology (-4.4%) and Industrials (-3.0%) faced sharp losses. This reinforces the prevailing risk-off sentiment and investor preference for stable, dividend-paying companies.
Key Insight: Capital continues rotating into low-volatility, cash-flow stable sectors.
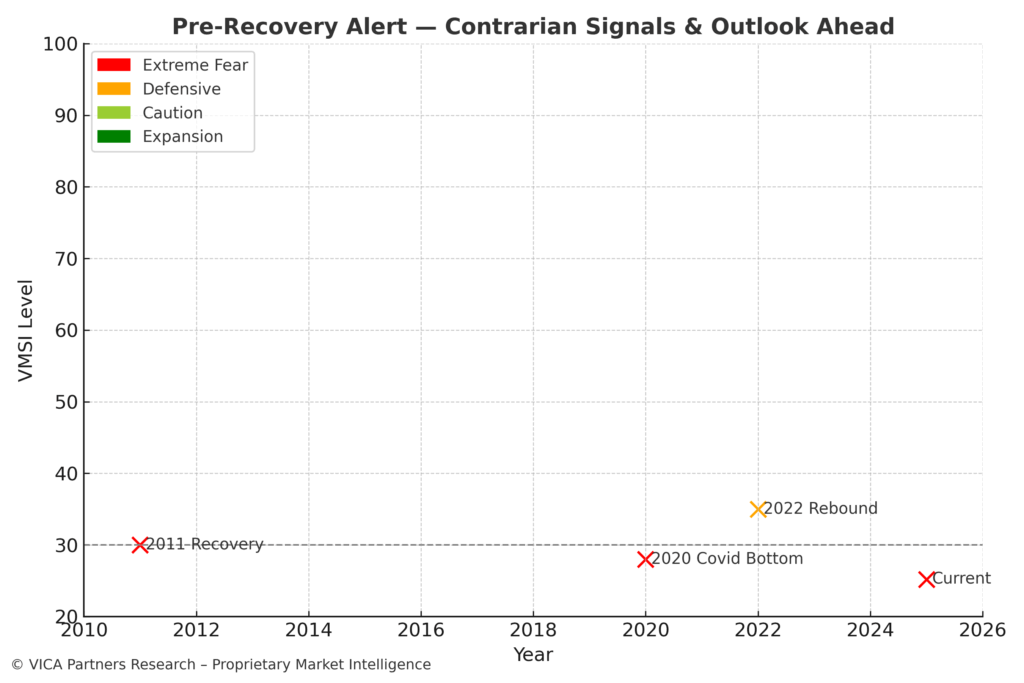
Pre-Recovery Alert – Contrarian Signals & Outlook Ahead
Contrarian indicators are flashing caution and optimism simultaneously. Sentiment, momentum, and volatility are near extremes historically associated with market bottoms. However, a confirmed recovery requires policy support or macro improvement. The VMSI composite remains on high alert for a reversal, but timing remains uncertain.
Key Insight: Setup is forming for a rebound, but no clear catalyst has emerged.
About the VICA Market Sentiment Index (VMSI)
The VMSI is VICA Research’s proprietary sentiment gauge designed to track shifts in institutional risk behavior, capital flow posture, and macro-driven volatility signals.
Each weekly score reflects a multi-factor model that incorporates a blend of market structure, flow dynamics, defensive rotation, and volatility hedging — calibrated against key technical and behavioral thresholds.
Index scale:
- 0–25: Critical Risk Zone
- 26–49: Defensive
- 50–74: Cautionary Optimism
- 75–100: Expansion / High Confidence
The VMSI is engineered for institutional-grade capital positioning. It reflects real-money sentiment shifts — not behavioral cues or media headlines.
The VMSI updates every Thursday following market close.
Disclaimer: This report and the proprietary VICA Market Sentiment Index (VMSI) are confidential works of authorship protected by intellectual property laws. Unauthorized reproduction, copying, redistribution, or use without express permission from VICA Research is strictly prohibited and monitored.
Data sources include: Nasdaq Market Stats, WSJ Market Data Center, ETF.com Flows Dashboard, NYSE/Nasdaq Short Interest, CFTC Commitment of Traders, VIX Technicals, Major Index Performance (S&P 500, Nasdaq, Dow), Michigan Consumer Sentiment, CPI Data, Treasury Yield Curves, Credit Spreads, and Proprietary VICA “Pro Dashboard” analytics.
Source: VICA Partners Research – Proprietary Index Model