April 24, 2025 | VICA Research
Weekly Snapshot
VMSI Score: 31.2 (Defensive)
S&P 500: +2.03% | Nasdaq: +2.74% | Dow: +1.23%
VIX: 26.49
Momentum: 37 | Liquidity: 29.4 | Volatility: 59 | Safe Haven Demand: 78
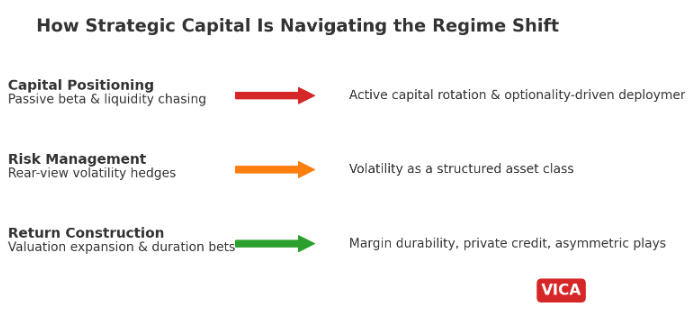
Despite sharp intraday equity gains, the VICA Market Sentiment Index confirms that institutional behavior remains deeply risk-averse. Volatility persists, flows are cautious, and macro conviction remains elusive.
What is VMSI?
The VICA Market Sentiment Index tracks institutional capital flows, risk posture, and macro volatility weekly. Built for tactical allocation — not behavioral shifts.
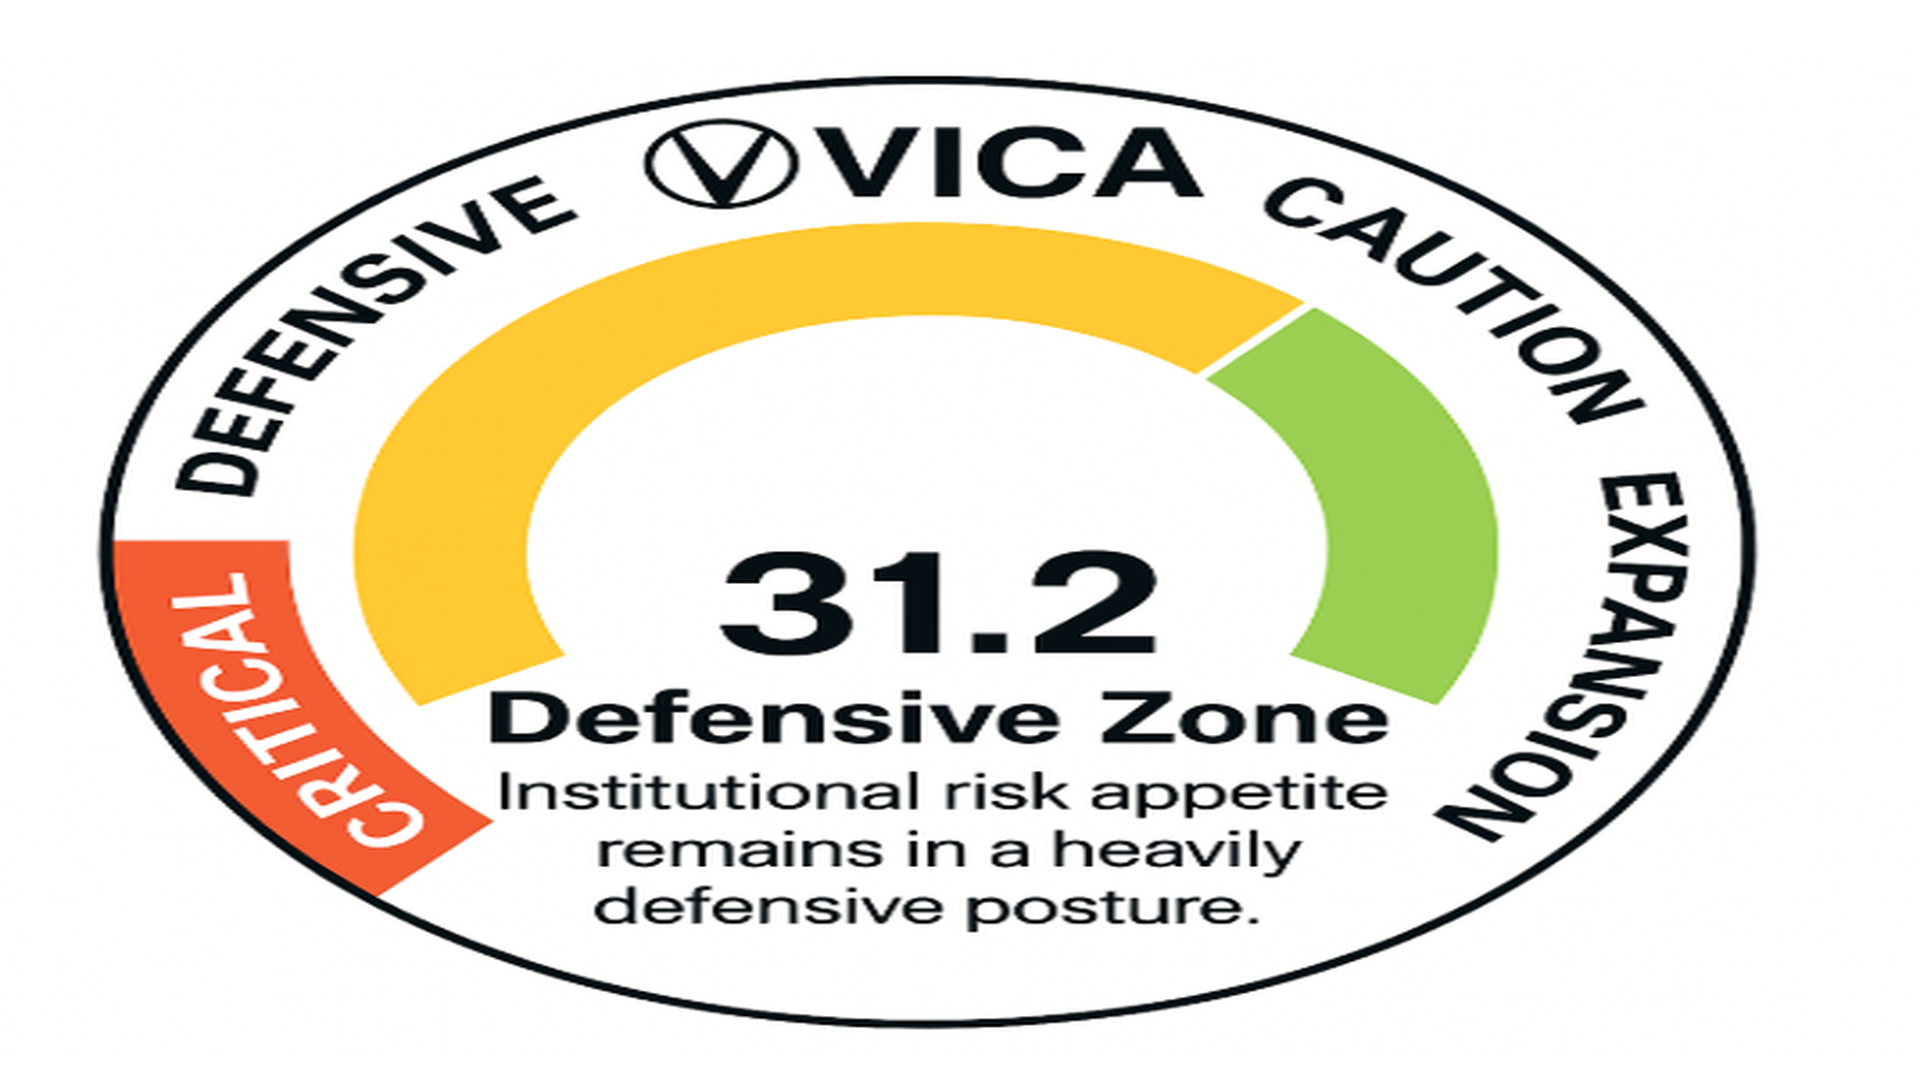
VMSI Gauge Chart — Displaying Current Sentiment and Risk Level
VMSI Index Scale:
- 🟥 0–25: Critical
- 🟧 26–49: Defensive
- 🟨 50–74: Caution
- 🟩 75–100: Expansion
VMSI Gauge Score – Apr 24, 2025
Sentiment Score: 31.2 (Defensive Zone)
The VMSI gauge reflects a score of 31.2, marking a slight improvement over last week’s 25.2 reading, but still firmly entrenched in the Defensive Zone. Despite today’s sharp equity rebound, institutional appetite remains muted and the broader posture is defined by caution and protection.
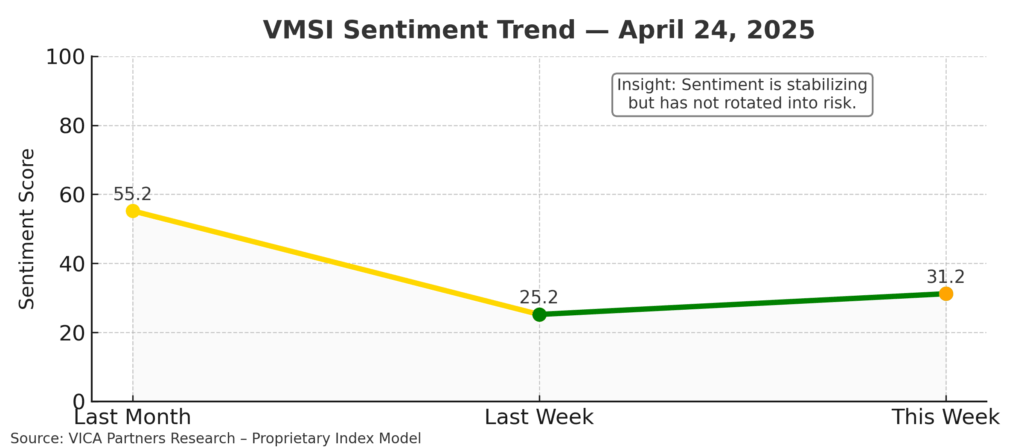
Insight: Institutional sentiment is stabilizing, but has not rotated into risk.
VMSI Timeline – Sentiment Shifts Over Time
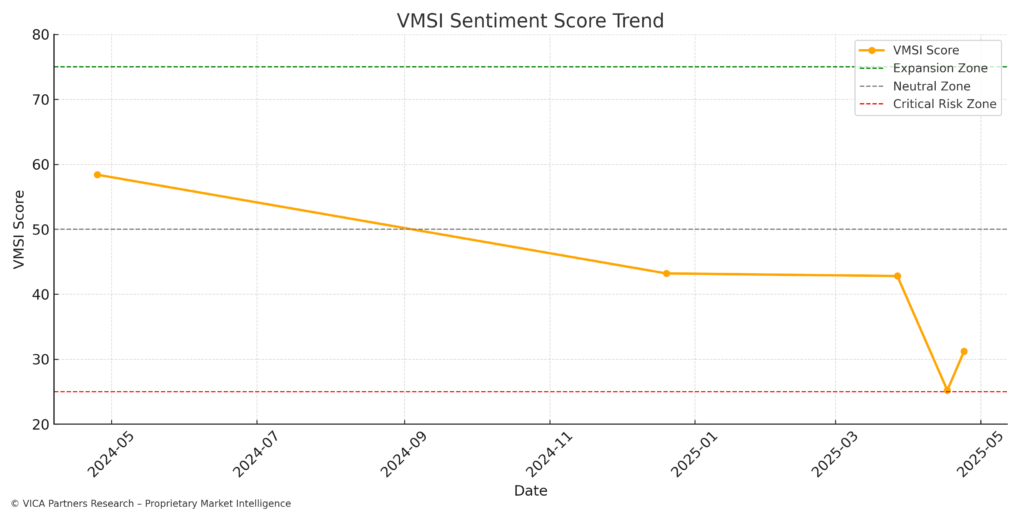
VMSI Score Timeline Trend – Apr 24, 2025
The current VMSI reading of 31.2 is a modest gain from 25.2 last week, and well below the 55.2 one month ago. This confirms that while sentiment may have bottomed in the near term, conviction remains absent. Traders continue to position for downside volatility, and institutions are not yet reallocating aggressively.
Insight: Recovery signals are forming, but institutional conviction has not returned.
Market Momentum – Institutional Accumulation Trends
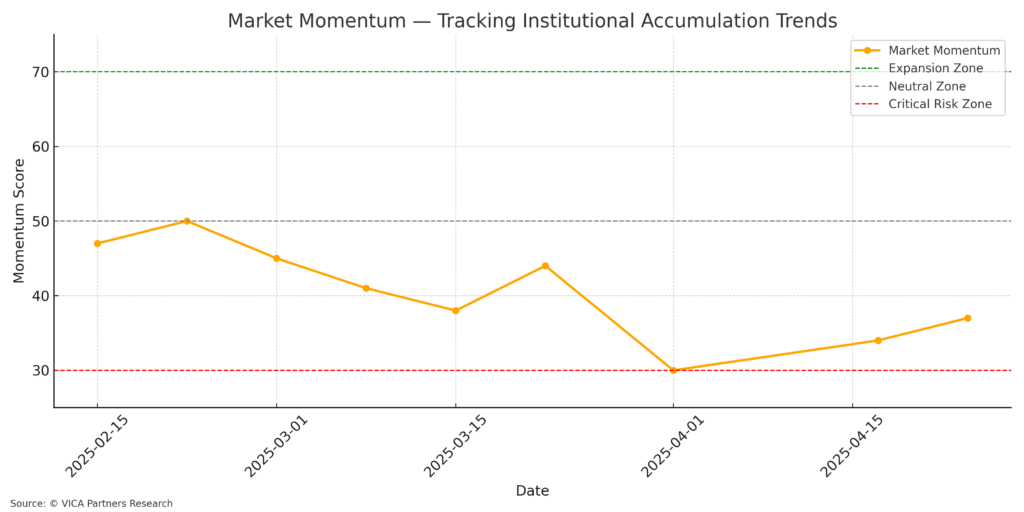
Market Momentum Trend – Apr 24, 2025
All three major indexes rebounded on April 24 — S&P 500 rose 2.03% to 5,484.79, Nasdaq advanced 2.74% to 17,166.04, and Dow added 1.23% to 40,093.40. However, each index remains below their 50- and 100-day moving averages. Nasdaq volume surged, indicating short-covering and tactical participation, but MACD and RSI readings suggest the trend remains structurally weak. Notably, stochastic oscillators are near overbought territory, indicating the bounce may be unsustainable without flow support.
Insight: Institutional selling has slowed, but accumulation remains weak.
Liquidity Flows – Capital Movement Patterns
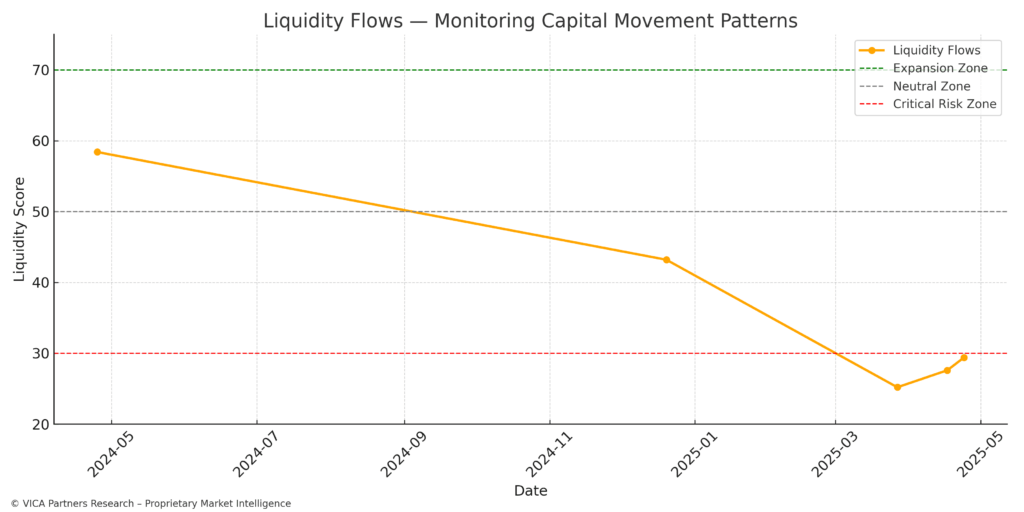
Liquidity Flows Trend – Apr 24, 2025
Liquidity remains fragile. ETF.com flow data confirms continued redemptions from core equity products such as SPY and QQQ. Most new inflows have concentrated in ultra-short Treasuries and Treasury-backed ETFs such as BIL and SGOV. Meanwhile, sector-specific flows show selective tech exposure (notably SMH), but broader fund flows indicate a continued risk-off environment.
Insight: Cash is rotating selectively into defense. Broad equity liquidity is still under stress.
Volatility & Risk Hedging – Market Uncertainty Barometer
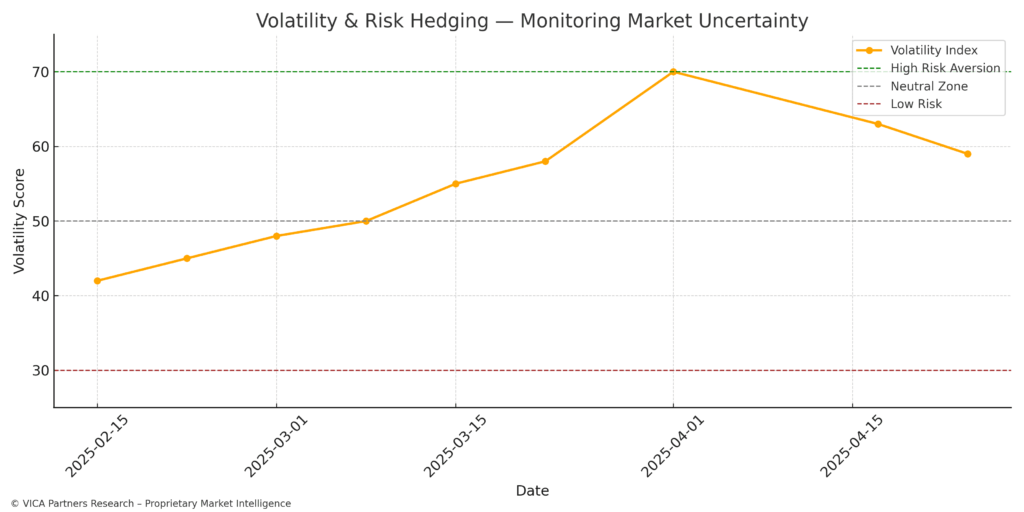
Volatility & Risk Hedging Trend – Apr 24, 2025
The VIX closed at 26.49 today, down 6.89%, and well off its early April peak near 45. However, historic volatility and technical momentum remain elevated. The MACD oscillator for the VIX remains negative, and the RSI sits near 47 — suggesting the panic phase is cooling but not resolved. CFTC COT reports confirm that non-commercial traders remain net short VIX futures, while hedgers maintain long volatility positions.
Insight: Volatility has cooled, but hedge demand remains strong and elevated.
Safe Haven Demand – Flight to Quality
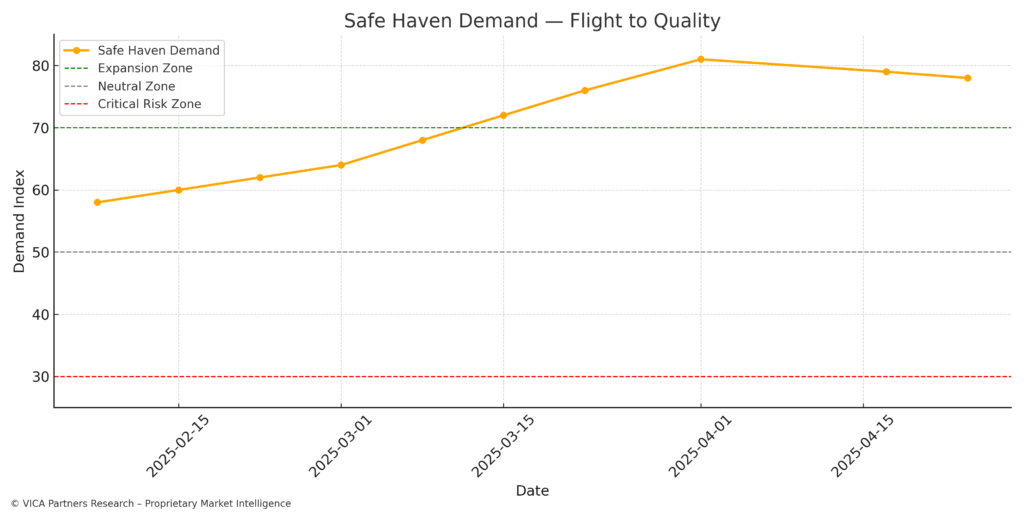
Safe Haven Demand Trend – Apr 24, 2025
Treasury inflows, gold strength, and rate futures positioning all point to a strong preference for capital preservation. Asset managers remain net long in 10-Year Note futures while leveraged funds are aggressively short. The bifurcation in rate sentiment implies institutional caution continues to dominate.
Insight: Safe-haven appetite is high across both bond and precious metal markets.
Defensive Sector Performance – Risk-Off Rotation within Equities
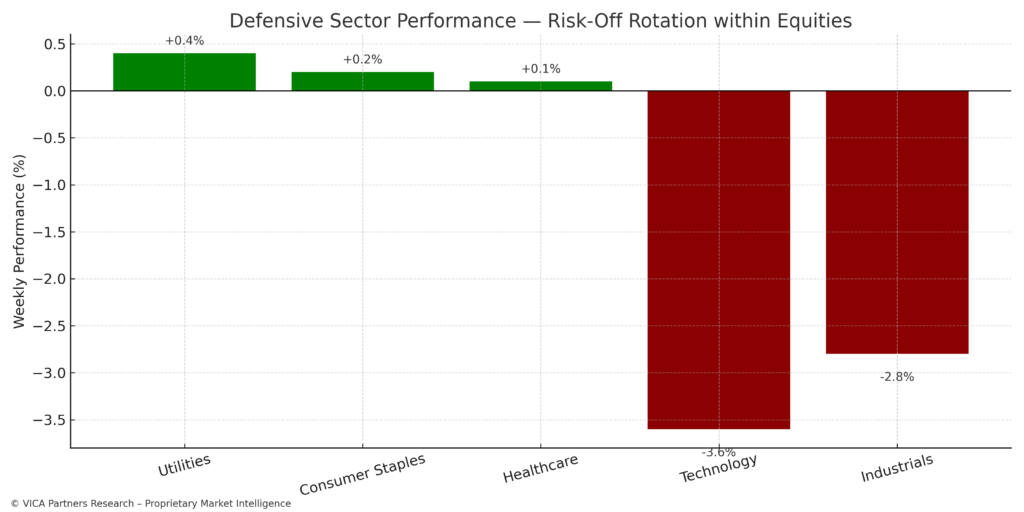
Sector Rotation Performance – Apr 24, 2025
Defensive sectors continue to lead equity market returns. Consumer Staples and Utilities remain the top-performing S&P sectors year-to-date, while Technology and Discretionary sectors lag sharply. ETF flows into defensive segments have slowed slightly, but outperformance continues, confirming that institutional capital is still parked in stable yield plays.
Insight: The equity rotation remains risk-off. Stability is being favored over beta.
Institutional Positioning (as of April 24)
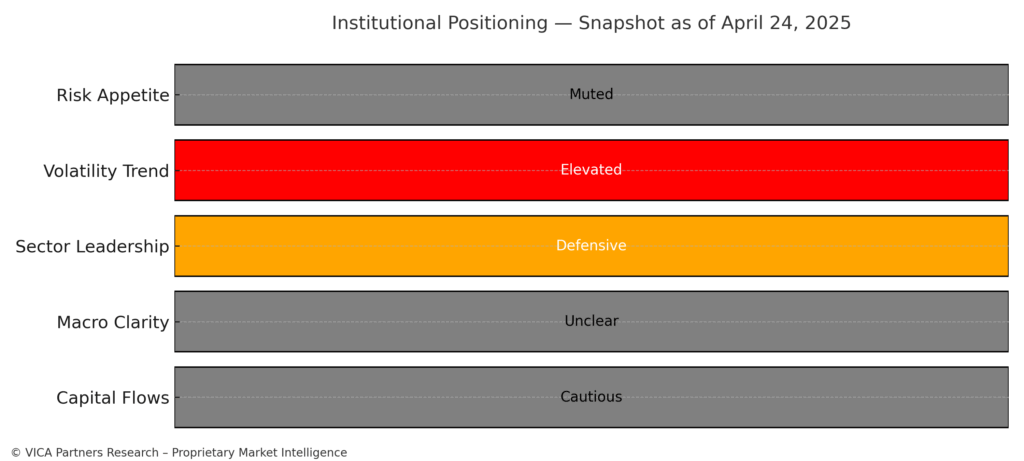
Institutional Positioning Snapshot – Apr 24, 2025
Institutional behavior remains cautious and defensive. Nasdaq short interest has increased, and the NYSE has reported a parallel uptick. CFTC data shows leveraged funds have moved net short S&P futures, while asset managers remain long. Across VIX and Treasury markets, institutions are hedging downside and favoring yield.
Insight: Institutions are sheltering in defensiveness. No sector or flow evidence supports a risk-on reentry. Positioning remains highly risk-managed.*
Pre-Recovery Alert – Contrarian Signals & Outlook Ahead
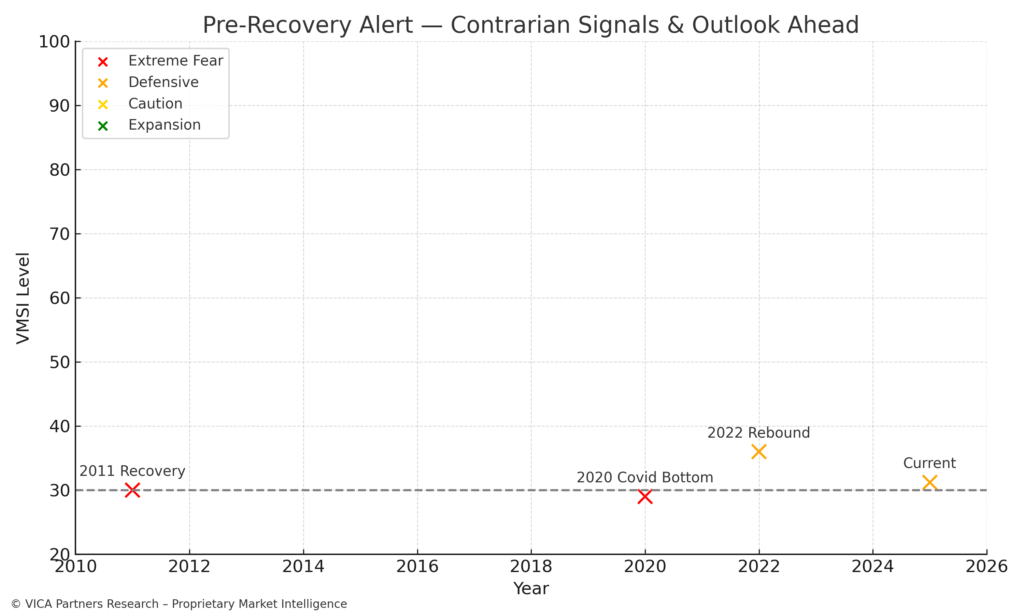
Pre-Recovery Signal Reference Chart – Apr 24, 2025
Extreme sentiment, historic volatility, and rising short interest all signal a potential bottoming formation. But without macro catalysts or policy inflection, institutional conviction remains on pause. The VMSI reflects this uncertainty — defensive posture remains dominant while potential recovery signals gather at the edge.
Insight: Setup is forming, but there is no green light for risk just yet.
About the VICA Market Sentiment Index (VMSI)
The VICA Market Sentiment Index (VMSI) is a proprietary multi-factor sentiment model developed by VICA Research. It is designed to measure institutional risk behavior, capital allocation posture, and volatility positioning — calibrated for forward-looking asset deployment, not emotional or media-based reaction.
Each weekly score integrates structural market indicators, liquidity patterns, sector rotations, and volatility metrics. These signals are weighted dynamically across tactical and strategic timeframes.
VMSI Index Scale:
- 🟥 0–25: Critical
- 🟧 26–49: Defensive
- 🟨 50–74: Caution
- 🟩 75–100: Expansion
VMSI is engineered for institutional-grade positioning and recalibrates weekly based on the latest cross-market data.
The Index is published every Thursday following U.S. market close.
Disclaimer: This report and the proprietary VICA Market Sentiment Index (VMSI) are confidential works of authorship protected by intellectual property laws. Unauthorized reproduction, copying, redistribution, or use without express permission from VICA Research is strictly prohibited and monitored.
Primary Data Inputs: Nasdaq Market Stats, WSJ Market Data Center, ETF Flows Dashboard, NYSE/Nasdaq Short Interest, CFTC Commitment of Traders, VIX Technicals, Major U.S. Index Performance (S&P 500, Nasdaq, Dow), Treasury Yield Curves, CPI Data, Credit Spreads, Michigan Sentiment, and VICA “Pro Dashboard” analytics.
Source: VICA Partners Research – Proprietary Index Model